Composition and property tunable ternary coacervate: branched polyethylenimine and a binary mixture of a strong and weak polyelectrolyte†
Mengmeng
Zhao
a,
Xuhui
Xia
a,
Jingyi
Mao
a,
Chao
Wang
 a,
Mahesh B.
Dawadi
b,
David A.
Modarelli
b and
Nicole S.
Zacharia
 *a
*a
aDepartment of Polymer Engineering, University of Akron, 250 S. Forge St, Akron, OH 44325, USA. E-mail: nzacharia@uakron.edu
bDepartment of Chemistry, University of Akron, OH 44325, USA
First published on 13th December 2018
Abstract
The formation of a composition- and property-tunable complex ternary coacervate was achieved by combining branched polyethylenimine (BPEI) and a binary mixture of polyacrylic acid (PAA) and poly(4-styrenesulfonic acid) (SPS). Presented here is a systematic study on how the ionic strength, stoichiometry, molecular weight and the presence of the cationic dye methylene blue (MB) can influence the composition and properties of the ternary coacervate. An increase in the ionization degree of PAA induced by increasing the ratio of BPEI to polyanion and by increasing the ionic strength leads to a higher incorporation of PAA into the coacervate. An increase in the molecular weight of PAA increases the proportion of SPS in the coacervate phase, likely due to reduced PAA chain mobility at high molecular weight. By introducing MB to the ternary polyelectrolyte system, the incorporation of SPS into ternary coacervate is significantly promoted, due to the interactions between MB and SPS such as π–π interactions that do not happen between MB and PAA. The hydrophobicity within the ternary coacervate is also significantly enhanced by the presence of accumulated MB. This study also shows that the ternary coacervate has promise as a material to stabilize solutes by efficiently inhibiting the complexation of solutes with transition metal ions such as copper ions. This might be applicable in retaining activity for enzymes that are sensitive to heavy metal ions. In addition, dynamic rheological measurements suggest that the rheological properties of the complex coacervates are tunable by varying polyanion composition as well as ionic strength, allowing for design of coacervates with a range of desired viscoelastic properties.
Design, System, ApplicationThis manuscript deals with the design of a 3 polyelectrolyte complex coacervate material and the optimization of its properties through understanding the phase diagram for the complex coacervation and using tools such as ionic strength solvent polarity. This should be applicable to charged, multivalent systems with multiple components such as colloids, surfactants, and charged macromolecules. These coacervate materials have potential use for the encapsulation or removal of solutes from aqueous solution. In order to gain specificity, it is not enough to just include positively and negatively charged macromolecules, but a greater control over the chemical environment within the coacervate is required (i.e. chemical functionality, polarity, density and therefore transport properties). Since the coacervate is defined by a thermodynamic phase transition, this process also defines the constraints as to the system's composition and functionality. |
1. Introduction
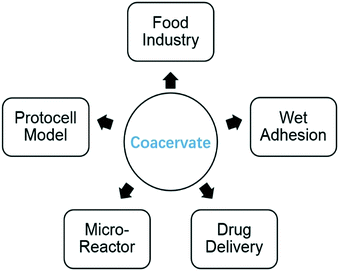
The association of oppositely charged polyelectrolytes can be used to design macromolecular materials with a range of functions. This association can lead to a phase separation which can be liquid–liquid (complex coacervation) or liquid–solid (precipitation), depending on factors such as the ratio of charges or ionic strength.1–3 Polyelectrolyte complex coacervation is generally considered to be entropically driven by the release of small counter ions,4,5 producing polyelectrolyte-rich liquid drops.6 Coalescence of the liquid droplets leads to a polymer-rich (complex coacervate) phase, coexisting at equilibrium with a dilute, solvent-rich (aqueous) phase. The coacervate phase exhibits very low interfacial energy in aqueous solution,7,8 which allows for low energy transport across the phase boundary.9–12 Furthermore, the concentration of the polyelectrolyte chains leads to a phase that is hydrophobic relative to the aqueous phase. These two facts make coacervate materials ideal for sequestration and concentration of water soluble organic or biological molecules in solution, useful in pharmaceuticals or food processing.13,14 The coacervation process has also been suggested as a model system for origin of life studies, creating compartmentalization of chemicals or proteins in solution like a type of primitive proto-cell without a membrane.9,15–17 Coacervate droplets have also been proposed as an attractive option for micro-reactors, with increased reaction rates and yields reported in previous studies.18–20 It is believed that protein coacervation is involved in the formation of the mechanical gradient in a squid's beak, and other organisms such as mussels or the sandcastle worm use coacervation as the basis of the wet adhesives they fabricate.21 Mussels attach to rocks using mussel adhesive proteins (MAPs), rich in 3,4-dihydroxyphenylalanine (DOPA), which enables MAPs to crosslink via chelation or covalent bonds.22 Highly concentrated MAP as a coacervate is excreted by the mussel and is not dispersed into seawater, but instead easily wets the surface to attach to due to its low interfacial tension, and is then hardened by catechol-mediated cross-linking.23,24 Complex coacervation therefore has broad application in both nature and industrial fields, described in Scheme 1. There has been increasing interest in understanding the coacervation process, how it is influenced by encapsulation of small molecules or biomacromolecules, and the mechanical or rheological properties of coacervates and how they depend on factors such as stoichiometry of oppositely charged polyelectrolytes, ionic strength, pH and molecular weight of polyelectrolytes.2,25The ability to tune the chemical environment of the polyelectrolyte complex coacervate as well as its mechano-rheological properties may lead to increased ability to sequester small molecules and other applications of these materials. One way to achieve this might be by combining three or more polymers. There are some literature reports of ternary systems in both polyelectrolyte complex and polyelectrolyte layer-by-layer (LbL) work, a coating method related to polyelectrolyte coacervation. Trinh et al. presented the formation of binary and ternary polyelectrolyte complexes (PECs) from synthetic polyelectrolytes.26 Caruso et al. reported the preparation of LbL assembled thin film by incorporating poly(allylamine hydrochloride) (PAH) as the polycation and a mixture of poly(4-styrenesulfonic acid) (SPS) and DNA as the polyanion, which demonstrates that film composition can be tuned by adjusting the blending solution composition, solvent polarity and polyanion molecular weight.27 In these examples, only water-insoluble complexes were formed and studied. Tirrell et al. described the formation of complex coacervate by combining a mixture of PAH and branched polyethylenimine (BPEI) with polyacrylic acid (PAA) or poly(N,N-dimethylaminoethyl methacrylate) (PDMAEMA) and studied the rheological property and viscoelastic behavior of the complex coacervates.25 However, there is still more to learn about how coacervate composition can be controlled by a use of factors such as stoichiometry and salt concentration, and how that composition can then further dictate properties. To better understand this, both strong and weak polyelectrolyte containing systems should be considered, as well as different types of salts which can interact differently with different polyelectrolyte systems, as shown by very different solubility of polyelectrolyte complexes in different salt solutions.28 Furthermore, working with synthetic polyelectrolytes can be used to gain insight to more complex systems. For example, DNA is a strong polyelectrolyte and proteins are weak polyelectrolytes. Optimising synthetic materials of weak and strong polyelectrolytes will lead to a better understanding of working with these biological materials as well.
In this work, knowledge of complex coacervation in a two polymer electrostatic system was extended to a more complicated ternary polyelectrolyte system that includes BPEI as the polycation, and a binary mixture of PAA and SPS. The composition of this system was measured under varying conditions, with the aim of understanding how to control that composition and how that then controls other properties such as viscoelasticity. In addition to the above mentioned factors, how solutes to be encapsulated (such as dyes) might impact the coacervate composition was also considered.
2. Materials and methods
2.1 Materials
Branched polyethylenimine (BPEI, Mw = 25![[thin space (1/6-em)]](https://www.rsc.org/images/entities/char_2009.gif) 000 with a polydispersity index (PDI) of 3.1) and poly(4-styrenesulfonic acid) (SPS, Mw = 75
000 with a polydispersity index (PDI) of 3.1) and poly(4-styrenesulfonic acid) (SPS, Mw = 75![[thin space (1/6-em)]](https://www.rsc.org/images/entities/char_2009.gif) 000 with a PDI of 3.6) were purchased from Sigma-Aldrich. Polyacrylic acid (PAA, Mw = 50
000 with a PDI of 3.6) were purchased from Sigma-Aldrich. Polyacrylic acid (PAA, Mw = 50![[thin space (1/6-em)]](https://www.rsc.org/images/entities/char_2009.gif) 000 with a PDI of 4.1, 345
000 with a PDI of 4.1, 345![[thin space (1/6-em)]](https://www.rsc.org/images/entities/char_2009.gif) 000 with a PDI of 3.7 and 1
000 with a PDI of 3.7 and 1![[thin space (1/6-em)]](https://www.rsc.org/images/entities/char_2009.gif) 000
000![[thin space (1/6-em)]](https://www.rsc.org/images/entities/char_2009.gif) 000 with a PDI of 3.0) were purchased from Polysciences, Inc. PAA (Mw = 100
000 with a PDI of 3.0) were purchased from Polysciences, Inc. PAA (Mw = 100![[thin space (1/6-em)]](https://www.rsc.org/images/entities/char_2009.gif) 000 with PDI of 3.4) was purchased from Sigma-Aldrich. The molecular weight and PDI of polyelectrolytes were determined by gel permeation chromatography using polyethylene oxide standards. Dyes including methylene blue (MB), 8-anilino-1-naphalenesulfonic acid (ammonium salt, ANS) and 1,4-dihydroxyanthraquinone (DHAQ) were purchased from Sigma-Aldrich. All other materials were purchased from Sigma-Aldrich unless otherwise noted. All water was dispensed from a Milli-Q water system at a resistivity of 18.2 MΩ cm. The polyelectrolytes were used as received without further purification.
000 with PDI of 3.4) was purchased from Sigma-Aldrich. The molecular weight and PDI of polyelectrolytes were determined by gel permeation chromatography using polyethylene oxide standards. Dyes including methylene blue (MB), 8-anilino-1-naphalenesulfonic acid (ammonium salt, ANS) and 1,4-dihydroxyanthraquinone (DHAQ) were purchased from Sigma-Aldrich. All other materials were purchased from Sigma-Aldrich unless otherwise noted. All water was dispensed from a Milli-Q water system at a resistivity of 18.2 MΩ cm. The polyelectrolytes were used as received without further purification.
2.2 Preparation of ternary complex coacervate
Stock solutions of BPEI (40 mM with respect to repeat unit) and mixture of PAA–SPS (total concentration of 40 mM with respect to repeat unit, with a stoichiometry of 1![[thin space (1/6-em)]](https://www.rsc.org/images/entities/char_2009.gif) :
:![[thin space (1/6-em)]](https://www.rsc.org/images/entities/char_2009.gif) 1 for PAA to SPS), either with or without the addition of NaCl and MB were prepared and adjusted to pH 6.5. Complex coacervate were prepared by mixing BPEI stock solution with PAA–SPS stock solution with a volume ratio of 1
1 for PAA to SPS), either with or without the addition of NaCl and MB were prepared and adjusted to pH 6.5. Complex coacervate were prepared by mixing BPEI stock solution with PAA–SPS stock solution with a volume ratio of 1![[thin space (1/6-em)]](https://www.rsc.org/images/entities/char_2009.gif) :
:![[thin space (1/6-em)]](https://www.rsc.org/images/entities/char_2009.gif) 10, 1
10, 1![[thin space (1/6-em)]](https://www.rsc.org/images/entities/char_2009.gif) :
:![[thin space (1/6-em)]](https://www.rsc.org/images/entities/char_2009.gif) 5, 1
5, 1![[thin space (1/6-em)]](https://www.rsc.org/images/entities/char_2009.gif) :
:![[thin space (1/6-em)]](https://www.rsc.org/images/entities/char_2009.gif) 2 and 1
2 and 1![[thin space (1/6-em)]](https://www.rsc.org/images/entities/char_2009.gif) :
:![[thin space (1/6-em)]](https://www.rsc.org/images/entities/char_2009.gif) 1 respectively. After mixing BPEI stock solution with PAA–SPS stock solution, the coacervate samples were stirred for 3 h before centrifugation. To ensure that 3 h stirring is sufficient to provide complex coacervate in an equilibrium state, dynamic light scattering (DLS) measurement of the ternary coacervate prepared at a BPEI
1 respectively. After mixing BPEI stock solution with PAA–SPS stock solution, the coacervate samples were stirred for 3 h before centrifugation. To ensure that 3 h stirring is sufficient to provide complex coacervate in an equilibrium state, dynamic light scattering (DLS) measurement of the ternary coacervate prepared at a BPEI![[thin space (1/6-em)]](https://www.rsc.org/images/entities/char_2009.gif) :
:![[thin space (1/6-em)]](https://www.rsc.org/images/entities/char_2009.gif) polyanion ratio of either 1
polyanion ratio of either 1![[thin space (1/6-em)]](https://www.rsc.org/images/entities/char_2009.gif) :
:![[thin space (1/6-em)]](https://www.rsc.org/images/entities/char_2009.gif) 10 or 1
10 or 1![[thin space (1/6-em)]](https://www.rsc.org/images/entities/char_2009.gif) :
:![[thin space (1/6-em)]](https://www.rsc.org/images/entities/char_2009.gif) 1 was performed on a Zeta PALS instrument (Brookhaven, USA) over 24 h, as shown in Fig. S1.† As the stirring time increases gradually from 1 h to 24 h, the hydrodynamic diameter of the ternary coacervate remains unchanged, indicating that at least with a stirring time of 3 h, the ternary coacervate has reached a plateau value. In addition, the zeta potential of the ternary coacervate prepared with a stirring time of 1 h is −46.3 ± 2.4 mV and −38.8 ± 3.8 mV, for the coacervate prepared at BPEI
1 was performed on a Zeta PALS instrument (Brookhaven, USA) over 24 h, as shown in Fig. S1.† As the stirring time increases gradually from 1 h to 24 h, the hydrodynamic diameter of the ternary coacervate remains unchanged, indicating that at least with a stirring time of 3 h, the ternary coacervate has reached a plateau value. In addition, the zeta potential of the ternary coacervate prepared with a stirring time of 1 h is −46.3 ± 2.4 mV and −38.8 ± 3.8 mV, for the coacervate prepared at BPEI![[thin space (1/6-em)]](https://www.rsc.org/images/entities/char_2009.gif) :
:![[thin space (1/6-em)]](https://www.rsc.org/images/entities/char_2009.gif) polyanion ratio of 1
polyanion ratio of 1![[thin space (1/6-em)]](https://www.rsc.org/images/entities/char_2009.gif) :
:![[thin space (1/6-em)]](https://www.rsc.org/images/entities/char_2009.gif) 10 and 1
10 and 1![[thin space (1/6-em)]](https://www.rsc.org/images/entities/char_2009.gif) :
:![[thin space (1/6-em)]](https://www.rsc.org/images/entities/char_2009.gif) 1, respectively, which indicates good stability of the ternary coacervate droplets. While it is possible that the materials are kinetically trapped, it is certain that properties no longer change after three hours of stirring, and given that the polymers are in a water rich solution, mobility should be high enough for chains to find an equilibrium state even if the initial associations are not in equilibrium.
1, respectively, which indicates good stability of the ternary coacervate droplets. While it is possible that the materials are kinetically trapped, it is certain that properties no longer change after three hours of stirring, and given that the polymers are in a water rich solution, mobility should be high enough for chains to find an equilibrium state even if the initial associations are not in equilibrium.
2.3 FTIR
The composition of the dried ternary coacervate was assessed using Fourier transform infrared spectroscopy (FTIR, Thermo Scientific Nicolet iS50 FTIR spectrometer). The ternary coacervate were prepared following the method mentioned before. After 3 h stirring, samples were centrifuged for 3 h at 8000 rpm (Allegra X-30R Centrifuge, Beckman Coulter). The ternary complex coacervate were dried for 24 hours at 80 °C after 3 h centrifugation before the FTIR test.For the FTIR analysis of PAA in the form of dried coacervate, two distinct absorption bands of the carboxylic acid functional group of PAA were considered; ν = 1565–1542 cm−1 (asymmetric stretching band of COO−) and ν = 1710–1700 cm−1 (C![[double bond, length as m-dash]](https://www.rsc.org/images/entities/char_e001.gif) O stretching of COOH),29 which are marked with blue dashed lines in Fig. S2a.† In BPEI–PAA/SPS coacervate, peaks at around 1630 cm−1 and 1500 cm−1 marked with red dashed lines were assigned to the asymmetric and symmetric bending vibrations of −NH3+ respectively,29,30 which overlap with the peaks for carboxylic acid functional groups of PAA. To separate these peaks, origin was used to fit Gaussian distributions to each peak, as shown in Fig. S2b.† The band intensity was estimated by using maximum peak height of each adsorption band.31 Assuming the same extinction coefficients for the pronated carboxyl at ∼1710 cm−1 and the deprotonated carboxyl at ∼1560 cm−1, the degree of ionization of PAA (α) was calculated from eqn (1),32
O stretching of COOH),29 which are marked with blue dashed lines in Fig. S2a.† In BPEI–PAA/SPS coacervate, peaks at around 1630 cm−1 and 1500 cm−1 marked with red dashed lines were assigned to the asymmetric and symmetric bending vibrations of −NH3+ respectively,29,30 which overlap with the peaks for carboxylic acid functional groups of PAA. To separate these peaks, origin was used to fit Gaussian distributions to each peak, as shown in Fig. S2b.† The band intensity was estimated by using maximum peak height of each adsorption band.31 Assuming the same extinction coefficients for the pronated carboxyl at ∼1710 cm−1 and the deprotonated carboxyl at ∼1560 cm−1, the degree of ionization of PAA (α) was calculated from eqn (1),32
 | (1) |
In Fig. S2a,† the peak at 836 cm−1 and 773 cm−1 (marked with black dash lines) were attributed to C–H out-of-plane vibration for para-disubstituted benzene and out-of-plane skeleton bending vibrations of benzene ring respectively.33 In order to better estimate the band intensity for the adsorption band of C–H out-of-plane vibration for SPS, Fig. S2c† shows the deconvolution of the FTIR data using Gaussian distribution as well. Fig. S3† shows the calibration curve plotted using SPS/PAA repeat unit ratio versus SPS/PAA peak intensity ratio, using the peak intensity at ∼836 cm−1 for SPS and the sum of peak intensity at ∼1710 cm−1 and ∼1560 cm−1 for PAA, which is further used to quantify the molar ratio of SPS to PAA in the coacervate phase.
2.4 Elemental analysis
Elemental analysis of carbon, nitrogen and hydrogen of the dried ternary coacervate were carried in an elemental analyzer, model Perkin Elmer 2400 series II.2.5 Determining dye sequestration into coacervates
Complex coacervates were prepared by simply mixing BPEI stock solution with PAA–SPS stock solution at a volume ratio from 1![[thin space (1/6-em)]](https://www.rsc.org/images/entities/char_2009.gif) :
:![[thin space (1/6-em)]](https://www.rsc.org/images/entities/char_2009.gif) 10 to 1
10 to 1![[thin space (1/6-em)]](https://www.rsc.org/images/entities/char_2009.gif) :
:![[thin space (1/6-em)]](https://www.rsc.org/images/entities/char_2009.gif) 1 with the presence of 0.01 mM MB at different NaCl concentrations to study the partition coefficient of MB as a function of the coacervate composition. Ternary coacervates were also prepared by mixing BPEI stock solution with PAA–SPS stock solution at a volume ratio of 1
1 with the presence of 0.01 mM MB at different NaCl concentrations to study the partition coefficient of MB as a function of the coacervate composition. Ternary coacervates were also prepared by mixing BPEI stock solution with PAA–SPS stock solution at a volume ratio of 1![[thin space (1/6-em)]](https://www.rsc.org/images/entities/char_2009.gif) :
:![[thin space (1/6-em)]](https://www.rsc.org/images/entities/char_2009.gif) 1, with the presence of MB varying from 0 to 1 mM, to study how MB concentration itself influences the partition coefficient. After stirring for 3 h, samples were centrifuged for 3 h at 8000 rpm (Allegra X-30R Centrifuge, Beckman Coulter). After centrifugation, the supernatant was removed using a micropipette and the coacervate phase was left in the bottom of the centrifuge tube. UV-vis measurements (Agilent 8453 Spectrophotometer) were used to determine the dye content of the supernatant.
1, with the presence of MB varying from 0 to 1 mM, to study how MB concentration itself influences the partition coefficient. After stirring for 3 h, samples were centrifuged for 3 h at 8000 rpm (Allegra X-30R Centrifuge, Beckman Coulter). After centrifugation, the supernatant was removed using a micropipette and the coacervate phase was left in the bottom of the centrifuge tube. UV-vis measurements (Agilent 8453 Spectrophotometer) were used to determine the dye content of the supernatant.
To study the effect of solvent dielectric constant on the partitioning of MB into BPEI–PAA or BPEI–SPS binary coacervate, complex coacervates were prepared by simply mixing BPEI stock solution and PAA stock solution or SPS solution at a mixing ratio of BPEI![[thin space (1/6-em)]](https://www.rsc.org/images/entities/char_2009.gif) :
:![[thin space (1/6-em)]](https://www.rsc.org/images/entities/char_2009.gif) PAA or BPEI
PAA or BPEI![[thin space (1/6-em)]](https://www.rsc.org/images/entities/char_2009.gif) :
:![[thin space (1/6-em)]](https://www.rsc.org/images/entities/char_2009.gif) SPS of 1
SPS of 1![[thin space (1/6-em)]](https://www.rsc.org/images/entities/char_2009.gif) :
:![[thin space (1/6-em)]](https://www.rsc.org/images/entities/char_2009.gif) 2 with the presence of 0.01 mM MB. Stock solutions of BPEI, PAA or SPS were prepared in ethanol–water mixtures (with volume percentage of ethanol of 0%, 10% and 20%) at a concentration of 40 mM with pH adjusted to 6.5.
2 with the presence of 0.01 mM MB. Stock solutions of BPEI, PAA or SPS were prepared in ethanol–water mixtures (with volume percentage of ethanol of 0%, 10% and 20%) at a concentration of 40 mM with pH adjusted to 6.5.
2.6 Fluorescence spectroscopy
Steady state emission spectra of ANS within ternary coacervate droplets with or without accumulated MB in the coacervate were measured using a Horiba FluoroMax 4 Spectrofluorometer with an excitation wavelength of 350 nm. Fluorescence emission was measured from 365 to 650 nm in quartz cuvettes for micro-droplet dispersions prepared with mixing BPEI stock solution and PAA–SPS stock solution at 1![[thin space (1/6-em)]](https://www.rsc.org/images/entities/char_2009.gif) :
:![[thin space (1/6-em)]](https://www.rsc.org/images/entities/char_2009.gif) 1 volume ratio, with the addition of 0.5 mM ANS at various MB concentration of the suspension system. All fluorescence was attributed to ANS within the micro-droplets, as ANS fluorescence was quenched in water. Steady state emission spectra of DHAQ in aqueous solution as well as in BPEI–PAA, BPEI–SPS, and BPEI–(PAA/SPS) coacervate with the addition of 0 to 1.0 equivalents of Cu2+ were measured with an excitation wavelength of 470 nm to determine the extent of complexation between DHAQ and Cu2+. Steady state emission spectra of DHAQ were also performed to study the sequestration of DHAQ into BPEI–PAA, BPEI–SPS and BPEI–(PAA/SPS) coacervate by studying the fluorescence intensity of DHAQ in the supernatant using centrifugation for separation of coacervate phase and aqueous phase.
1 volume ratio, with the addition of 0.5 mM ANS at various MB concentration of the suspension system. All fluorescence was attributed to ANS within the micro-droplets, as ANS fluorescence was quenched in water. Steady state emission spectra of DHAQ in aqueous solution as well as in BPEI–PAA, BPEI–SPS, and BPEI–(PAA/SPS) coacervate with the addition of 0 to 1.0 equivalents of Cu2+ were measured with an excitation wavelength of 470 nm to determine the extent of complexation between DHAQ and Cu2+. Steady state emission spectra of DHAQ were also performed to study the sequestration of DHAQ into BPEI–PAA, BPEI–SPS and BPEI–(PAA/SPS) coacervate by studying the fluorescence intensity of DHAQ in the supernatant using centrifugation for separation of coacervate phase and aqueous phase.
2.7 Rheological measurements
The coacervate samples were prepared by mixing 40 mM BPEI stock solution (pH = 6.5) prepared at 0 or 200 mM NaCl and 40 mM polyanion stock solution (PAA, SPS, or a mixture of PAA and SPS with a ratio of PAA![[thin space (1/6-em)]](https://www.rsc.org/images/entities/char_2009.gif) :
:![[thin space (1/6-em)]](https://www.rsc.org/images/entities/char_2009.gif) SPS = 1
SPS = 1![[thin space (1/6-em)]](https://www.rsc.org/images/entities/char_2009.gif) :
:![[thin space (1/6-em)]](https://www.rsc.org/images/entities/char_2009.gif) 1, pH = 6.5) prepared at 0 or 200 mM NaCl at 1
1, pH = 6.5) prepared at 0 or 200 mM NaCl at 1![[thin space (1/6-em)]](https://www.rsc.org/images/entities/char_2009.gif) :
:![[thin space (1/6-em)]](https://www.rsc.org/images/entities/char_2009.gif) 1 volume ratio, and then collected by centrifuging the mixtures at 8000 rpm for 3 h (Allegra X-30R Centrifuge, Beckman Coulter). The dynamic rheological properties of the collected coacervates were characterized using a TA Instruments ARES-G2 rheometer in parallel plate geometry using an 8.00 mm diameter aluminium upper plate and 43.9 mm diameter aluminium lower plate along with a solvent trap. For dynamic rheological experiments, a constant strain amplitude of 0.6%, which is within the linear viscoelastic response region for all the collected coacervate samples, was used. The frequency was swept from 0.1–100 rad per s for these dynamic measurements.
1 volume ratio, and then collected by centrifuging the mixtures at 8000 rpm for 3 h (Allegra X-30R Centrifuge, Beckman Coulter). The dynamic rheological properties of the collected coacervates were characterized using a TA Instruments ARES-G2 rheometer in parallel plate geometry using an 8.00 mm diameter aluminium upper plate and 43.9 mm diameter aluminium lower plate along with a solvent trap. For dynamic rheological experiments, a constant strain amplitude of 0.6%, which is within the linear viscoelastic response region for all the collected coacervate samples, was used. The frequency was swept from 0.1–100 rad per s for these dynamic measurements.
3. Results and discussion
3.1 Effect of BPEI![[thin space (1/6-em)]](https://www.rsc.org/images/entities/h3_char_2009.gif) :
:![[thin space (1/6-em)]](https://www.rsc.org/images/entities/h3_char_2009.gif) polyanion ratio and ionic strength on ternary coacervate composition
polyanion ratio and ionic strength on ternary coacervate composition
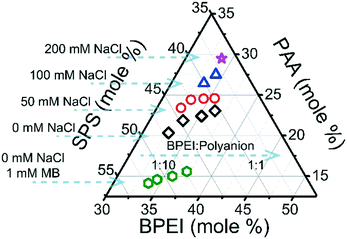
BPEI–(PAA/SPS) coacervates were prepared using a BPEI stock solution and a combined PAA–SPS stock solution. Different factors were considered such as ionic strength, BPEI to polyanion ratio, PAA to SPS ratio in the initial polyanion stock solution, varying PAA molecular weight, as well as different MB concentrations in the system. Composition of the polymers in the coacervate phase was determined from a combination of elemental analysis and FTIR, detailed in the ESI.† In brief, FTIR was used to identify the ratio of PAA to SPS in the coacervate (shown in Fig. S1 and S2†) and elemental analysis was further used to identify the fraction of BPEI. Fig. 1 shows the ternary phase diagram of BPEI–(PAA/SPS) coacervate formed using different ratios of polycation to polyanion solution and different amounts of NaCl, always at a constant pH of 6.5. The solutions used were 40 Mm BPEI and 40 mM polyanion with a constant PAA to SPS ratio = 1![[thin space (1/6-em)]](https://www.rsc.org/images/entities/char_2009.gif) :
:![[thin space (1/6-em)]](https://www.rsc.org/images/entities/char_2009.gif) 1. At this pH value PAA and BPEI are partially charged in low ionic strength solution.
1. At this pH value PAA and BPEI are partially charged in low ionic strength solution.
As one would expect, increasing the polycation![[thin space (1/6-em)]](https://www.rsc.org/images/entities/char_2009.gif) :
:![[thin space (1/6-em)]](https://www.rsc.org/images/entities/char_2009.gif) polyanion ratio increases the BPEI content in the coacervate phase. However, even at 1
polyanion ratio increases the BPEI content in the coacervate phase. However, even at 1![[thin space (1/6-em)]](https://www.rsc.org/images/entities/char_2009.gif) :
:![[thin space (1/6-em)]](https://www.rsc.org/images/entities/char_2009.gif) 1 polycation
1 polycation![[thin space (1/6-em)]](https://www.rsc.org/images/entities/char_2009.gif) :
:![[thin space (1/6-em)]](https://www.rsc.org/images/entities/char_2009.gif) polyanion, there is still less than 50% of BPEI in the overall coacervate material. It can also be observed that the anion composition is dependent on added salt as well as BPEI to polyanion ratio at which the coacervate was formed. In particular, as shown in Fig. 1, an increase in the polycation
polyanion, there is still less than 50% of BPEI in the overall coacervate material. It can also be observed that the anion composition is dependent on added salt as well as BPEI to polyanion ratio at which the coacervate was formed. In particular, as shown in Fig. 1, an increase in the polycation![[thin space (1/6-em)]](https://www.rsc.org/images/entities/char_2009.gif) :
:![[thin space (1/6-em)]](https://www.rsc.org/images/entities/char_2009.gif) polyanion ratio leads to an increase in mole % of PAA in the ternary coacervate. In addition, as the ionic strength in the system increases, the mole % of PAA in the complex coacervate increases as well. In order to better explain how the polycation
polyanion ratio leads to an increase in mole % of PAA in the ternary coacervate. In addition, as the ionic strength in the system increases, the mole % of PAA in the complex coacervate increases as well. In order to better explain how the polycation![[thin space (1/6-em)]](https://www.rsc.org/images/entities/char_2009.gif) :
:![[thin space (1/6-em)]](https://www.rsc.org/images/entities/char_2009.gif) polyanion ratio and ionic strength impacts the mole % of PAA in the ternary coacervate, the ionization degree of PAA was studied as a function of polycation
polyanion ratio and ionic strength impacts the mole % of PAA in the ternary coacervate, the ionization degree of PAA was studied as a function of polycation![[thin space (1/6-em)]](https://www.rsc.org/images/entities/char_2009.gif) :
:![[thin space (1/6-em)]](https://www.rsc.org/images/entities/char_2009.gif) polyanion ratio as well as ionic strength. The presence of MB in the ternary polyelectrolyte system has a significant influence on the composition of the ternary coacervate as well, leading to an increased mole % of SPS in the formed ternary BPEI–(PAA/SPS) coacervate.
polyanion ratio as well as ionic strength. The presence of MB in the ternary polyelectrolyte system has a significant influence on the composition of the ternary coacervate as well, leading to an increased mole % of SPS in the formed ternary BPEI–(PAA/SPS) coacervate.
Fig. S4† shows the degree of ionization of PAA in the coacervate phase formed under the same conditions as for the phase diagram in Fig. 1. It is clear that the ionization of carboxylic acid groups in PAA in the coacervate is strongly influenced by the presence of NaCl or the BPEI to polyanion ratio. It has been reported that carboxylic acid groups are much more readily deprotonated in the presence of 1°, 2°, or 3° amine groups due to the acid–base interactions between carboxylic and amine functional groups.32 Therefore, an increase in BPEI to polyanion ratio will enhance the ionization degree of PAA. An increase in ionic strength also has a similar effect on PAA ionization, as shown in Fig. S4.† It was observed that the ionization degree of PAA in aqueous solution calculated using the Henderson–Hasselbalch equation increases with an increase in NaCl concentration (Fig. S5†), consistent with the observed increase in PAA ionization in the coacervate as ionic strength is increased. Based on these results, it can be concluded that an increase in PAA ionization promotes the incorporation of PAA into the coacervate phase, due to increased electrostatic interactions between BPEI and PAA as the ionization degree of PAA increases.
3.2 Effect of ternary coacervate composition on partition coefficient of MB
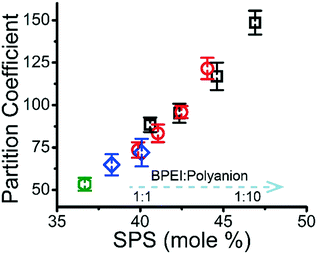
It has previously been shown that binary BPEI–SPS coacervate is capable of sequestering small organic molecules including MB, enhanced by specific secondary interactions between the small molecules and the polyelectrolytes.9 The low surface tension between the coacervate phase and the supernatant enables the passing of solutes from one phase to the other with little energetic barrier. In order to show which secondary interactions play important roles in the sequestration of dye into coacervate, the partitioning of MB dye into BPEI–PAA or BPEI–SPS binary coacervates was studied using UV-vis spectroscopy as a function of solvent polarity. Dielectric constant of solvent is usually taken as a measure of its polarity. In this study, the dielectric constant of solvent was adjusted by using water–ethanol mixture as the solvent, with different volume percentage of ethanol (0%, 10% and 20%). Fig. S6† shows the impact of solvent dielectric constant on the partition coefficient of MB into either BPEI–PAA or BPEI–SPS binary coacervate. The partition coefficient K is defined as the ratio of concentration of solute in the coacervate phase to the concentration of solute in the water rich phase (eqn (2)). In general, a decrease in solvent dielectric constant leads to a strengthened electrostatic interaction and cation–π interaction, and a weakened π–π interaction and hydrophobic interaction.34 As shown in Fig. S6,† lower solvent dielectric constant corresponds to a higher partition coefficient of MB into BPEI–PAA coacervate, and a lower partition coefficient of MB into BPEI–SPS coacervate. This suggests that the main driving force for MB uptake in the BPEI–PAA and BPEI–SPS cases differs. For BPEI–PAA coacervate, the electrostatic interaction between positively charged MB and negatively charged PAA is the main mechanism for the uptake of MB, while for the BPEI–SPS coacervate, the π–π interactions are dominant (with hydrophobic interactions possibly contributing). This is the case even though electrostatic interactions are operative over larger length scales than are π–π stacking interactions. It was previously shown that a red-shift in the UV-vis maximum absorbance wavelength (λmax) of MB in aqueous solution with the presence of SPS demonstrates the formation of π–π stacking between MB and SPS.9The partitioning of MB dye into BPEI–(PAA/SPS) coacervate was characterized with UV-vis spectroscopy. Fig. 2 shows the relationship between MB partition coefficient and mole % of SPS in the coacervate. To better illustrate the relation between the relative MB uptake of BPEI–(PAA/SPS) coacervate phases and varying compositions of the complex coacervate phases, the partition coefficient as well as the mole % of SPS in the coacervate phase was determined using UV-vis, FTIR spectroscopy and elemental analysis. The mole % of SPS can be defined as shown in eqn (2), where nSPS, nPAA, and nBPEI are the number of moles of SPS, PAA and BPEI in the coacervate. The partition coefficient K is defined as the ratio of concentration of solute in the coacervate phase to the concentration of solute in the water rich phase (eqn (3)).
 | (2) |
 | (3) |
It was previously demonstrated that BPEI–SPS complex coacervate with its combined ability to form primarily π–π stacking and secondarily electrostatic interaction has a significantly higher capacity to sequester MB than BPEI–PAA and BPEI–polyvinylsulfonate coacervates, that are only capable of electrostatic interactions with the dye.9 As shown in Fig. 2, the partition coefficient of MB into BPEI–(PAA/SPS) complex coacervate increases almost linearly with the mole % of SPS in ternary coacervate, and is influenced very little by either ionic strength or polycation![[thin space (1/6-em)]](https://www.rsc.org/images/entities/char_2009.gif) :
:![[thin space (1/6-em)]](https://www.rsc.org/images/entities/char_2009.gif) polyanion ratio. Thus, the SPS content in the coacervate determines the partition coefficient of MB into the coacervate due to the π–π interactions between SPS and MB.
polyanion ratio. Thus, the SPS content in the coacervate determines the partition coefficient of MB into the coacervate due to the π–π interactions between SPS and MB.
3.3 Effect of presence of MB on ternary coacervate composition
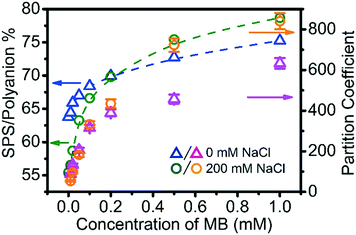
MB interacts with the polyelectrolytes during the coacervation process rather than being passively carried along, and therefore also influences the phase behaviour of the complex coacervation. In the phase diagram in Fig. 1 it was seen that just 1 mM of MB increases the % of SPS in the ternary coacervate significantly. To examine this in more depth, the SPS/polyanion % in BPEI–(PAA/SPS) coacervates and the partition coefficient of MB into these complex coacervates formed using 40 mM BPEI and polyanion with a PAA to SPS ratio = 1![[thin space (1/6-em)]](https://www.rsc.org/images/entities/char_2009.gif) :
:![[thin space (1/6-em)]](https://www.rsc.org/images/entities/char_2009.gif) 1 with the presence of a various amount of MB and with the addition of either 0 mM or 200 mM NaCl were obtained using UV-vis and FTIR spectroscopy (Fig. 3). The SPS/polyanion % in the ternary coacervate system is defined as shown in eqn (4).
1 with the presence of a various amount of MB and with the addition of either 0 mM or 200 mM NaCl were obtained using UV-vis and FTIR spectroscopy (Fig. 3). The SPS/polyanion % in the ternary coacervate system is defined as shown in eqn (4). | (4) |
The addition of MB to the ternary polyelectrolyte system does indeed modify the composition of the complex coacervate phase. More specifically, the SPS/polyanion % increases with the increase of MB concentration in the system. The short-range aromatic–aromatic interactions between MB and SPS have been suggested to be much less dependent on the ionic strength than the electrostatics between PAA and MB.35 Fig. S7† shows the UV-vis spectra of solution of a mixture of SPS, MB with various concentrations of NaCl (from 0 to 0.5 M). In these experiments, the maximum absorbance wavelength (λmax) of MB was fixed at 671 nm, which is characteristic for the π–π complexation between MB and SPS, indicating that the increase in ionic strength has little impact on the π–π complexation between MB and SPS.
Another observation is that at low MB overall concentration (<0.2 mM), the coacervate formed at 200 mM NaCl has a lower SPS/polyanion % than the coacervate formed at 0 mM NaCl, while at MB overall concentration higher than 0.2 mM, the coacervate formed at 200 mM NaCl has a higher SPS/polyanion % than the coacervate formed at 0 mM NaCl concentration. The low MB concentration results are explained by the increased degree of ionization of PAA with increasing ionic strength, promoting its inclusion into the coacervate. However, with increasing MB, the π–π interactions that are not mitigated with increases in ionic strength counter this trend. Although sequestered MB within coacervate droplets draws more SPS into the coacervate, an accumulated of MB within coacervate also enhances the uptake ability of MB into coacervate more than the effect of SPS does. For example, consider the sequestration of MB into coacervate formed at BPEI![[thin space (1/6-em)]](https://www.rsc.org/images/entities/char_2009.gif) :
:![[thin space (1/6-em)]](https://www.rsc.org/images/entities/char_2009.gif) polyanion = 1
polyanion = 1![[thin space (1/6-em)]](https://www.rsc.org/images/entities/char_2009.gif) :
:![[thin space (1/6-em)]](https://www.rsc.org/images/entities/char_2009.gif) 10 with the presence of 0.01 mM MB as well as coacervate formed at BPEI
10 with the presence of 0.01 mM MB as well as coacervate formed at BPEI![[thin space (1/6-em)]](https://www.rsc.org/images/entities/char_2009.gif) :
:![[thin space (1/6-em)]](https://www.rsc.org/images/entities/char_2009.gif) polyanion = 1
polyanion = 1![[thin space (1/6-em)]](https://www.rsc.org/images/entities/char_2009.gif) :
:![[thin space (1/6-em)]](https://www.rsc.org/images/entities/char_2009.gif) 1 with the presence of 0.2 mM MB using 40 mM BPEI and polyanion (PAA to SPS ratio = 1
1 with the presence of 0.2 mM MB using 40 mM BPEI and polyanion (PAA to SPS ratio = 1![[thin space (1/6-em)]](https://www.rsc.org/images/entities/char_2009.gif) :
:![[thin space (1/6-em)]](https://www.rsc.org/images/entities/char_2009.gif) 1). In both of these coacervate materials, the SPS/polyanion % is similar at approximately 70%, but the partition coefficient of MB into the ternary coacervate formed with 0.2 mM MB (∼400) is about ∼2.5 times more than the partition coefficient of MB in the coacervate formed with 0.01 mM MB (∼150). Our interpretation of these results is that π–π interaction and hydrophobic interaction play an extremely important role in concentrating MB. This includes both the interactions between MB and SPS, but also between the small molecules themselves, allowing them to exist in a concentrated fashion within the coacervate drops.
1). In both of these coacervate materials, the SPS/polyanion % is similar at approximately 70%, but the partition coefficient of MB into the ternary coacervate formed with 0.2 mM MB (∼400) is about ∼2.5 times more than the partition coefficient of MB in the coacervate formed with 0.01 mM MB (∼150). Our interpretation of these results is that π–π interaction and hydrophobic interaction play an extremely important role in concentrating MB. This includes both the interactions between MB and SPS, but also between the small molecules themselves, allowing them to exist in a concentrated fashion within the coacervate drops.
3.4 Effect of accumulated MB on the hydrophobicity within coacervate droplets
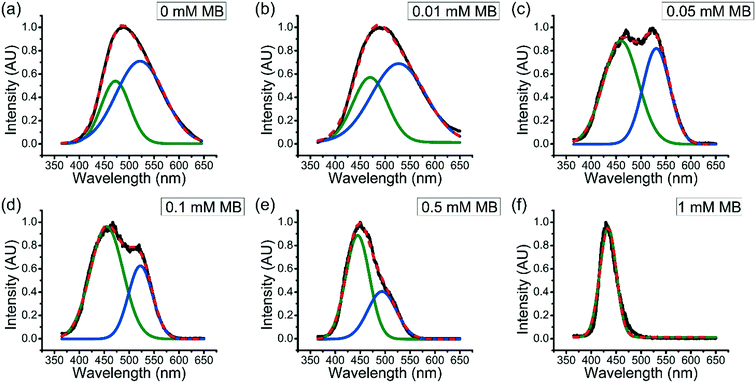
It has been seen that the partition coefficient of solutes into coacervates generally decreases with increasing solute concentration. For example, Tirrell et al. found that the encapsulation efficiency of BSA into polypeptide coacervate was decreased as the ratio of BSA to polypeptide increases.36 However, as described above, the partition coefficient of MB into coacervates increases as the overall concentration of MB in the system increases.To better understand how the accumulated MB further enhances uptake of MB in aqueous solution into coacervate drops, fluorescence spectroscopy was used. Fluorescence spectra of ANS within ternary coacervate materials with the presence of different amount of MB in the system were obtained (Fig. 4). Previous studies have shown that the photo-physical properties of ANS are highly sensitive to the polarity and viscosity of environment.37 As shown in Fig. 4, the fluorescence spectra for ANS within the ternary coacervate with different amounts of MB show either a broad feature between 365 and 650 nm or two distinguishable bands of varying intensity, indicating a combination of different micro-environments of varying polarities. Deconvolution of the spectra by Gaussian fitting provides two specific emission maxima associated with two distinct micro-environments for ANS. Specifically, the emission maximum at approximately 470 nm was assigned to the non-polar excited state localized on the naphthalene ring of ANS, while the peak at approximately 530 nm was consistent with the emission from the charge transfer state, which is related to the polarity of environment. Due to the fact that the partition coefficient of MB into the ternary coacervate increases with overall MB concentration, it is also true that the accumulated amount of MB within the coacervate increases with the overall concentration of MB in the system. As shown in Fig. 4, as the MB concentration increases from 0 to 1.0 mM, the intensity of the emission band at ∼530 nm decreases to nearly zero, indicating that the presence of MB within coacervate droplets increases the hydrophobicity of the coacervate significantly.
To be more quantitative, the relative hydrophobicity (RH) of the environment for ANS can be evaluated using eqn (5),
 | (5) |
Plotting the partition coefficient of MB into the ternary coacervate vs. relative hydrophobicity RH shows a linear relationship, as shown in Fig. 5, showing the increase of MB partition coefficient with coacervate hydrophobicity.
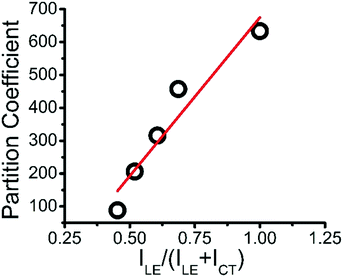 | ||
| Fig. 5 Linear plot of partition coefficient of MB into ternary coacervate vs. relative hydrophobicity. | ||
3.5 Water content of ternary coacervates
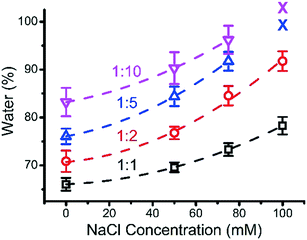
Experimentally, the water content of ternary coacervate was determined by weighing the coacervate before and after the drying process. The water content within the various coacervate compositions as a function of salt concentration for different BPEI to polyanion stoichiometries is shown in Fig. 6. Although it is likely that some hydration layer remains in the material after drying, the amount that can be removed through heating was considered here to be the coacervate water content. In general, an increase in salt concentration results in an increase in the water content of the ternary coacervate formed, which is consistent with previously reported results. Priftis et al. found that water content of polypeptide containing coacervate increases with the increase in salt concentration.38 A study on binary polyelectrolyte coacervate prepared using PAA and PDMAEMA reported by van der Gucht also shows an increase in water content with the addition of salt.39 In addition, at high salt concentrations where the water content is approaching ∼100% as inferred from the trend curve in Fig. 6, the phase separation disappears. Priftis et al. proposed a model structure of coacervate to explain how salt concentration influences the water content of the coacervate, by considering the coacervate to be a network of dense polyanion and polycation chains, with the degree of shrinkage depending on the number of interconnected chains.38 In this model, electrostatic interactions between the oppositely charged polyelectrolytes are weakened by the increase of salt concentration as a result of the increased screening effect, that then leads to an increase in the concentration of polymers in the surrounding equilibrium solution at the expense of the polymers involved in coacervate phase. Herein, by increasing ionic strength, coacervate materials with a higher water content and weaker interactions between chains are produced.The influence of BPEI to polyanion ratio on the water content of ternary coacervate was also investigated. In a previous study, Wang et al. reported that coacervates formed using β-lactoglobulin and pectin had higher water content at lower protein to pectin ratio.40 Here, at each given NaCl concentration, the water content of the ternary coacervate materials prepared using BPEI and polyanion (PAA![[thin space (1/6-em)]](https://www.rsc.org/images/entities/char_2009.gif) :
:![[thin space (1/6-em)]](https://www.rsc.org/images/entities/char_2009.gif) SPS = 1
SPS = 1![[thin space (1/6-em)]](https://www.rsc.org/images/entities/char_2009.gif) :
:![[thin space (1/6-em)]](https://www.rsc.org/images/entities/char_2009.gif) 1) stock solutions increases as the BPEI to polyanion ratio decreases, consistent with previously reported studies.40
1) stock solutions increases as the BPEI to polyanion ratio decreases, consistent with previously reported studies.40
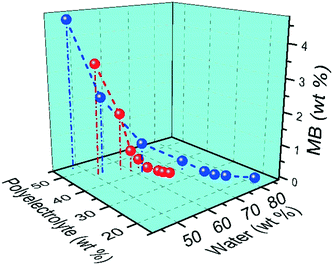
Fig. 7 shows the effect of ionic strength, BPEI to polyanion stoichiometry, and amount of MB accumulated within the coacervate on the water content of the MB encapsulated coacervate. Increasing salt concentration results in an increase in water content of the ternary coacervate. Also, an increase in the accumulated amount of MB leads to a decrease in water content, due to the increasingly hydrophobic environment within the coacervate. It is then not surprising to observe that the water content of the ternary coacervate is influenced by both the salt concentration in the system as well as the accumulated MB within the coacervate. At low MB concentrations, ternary coacervate formed at higher ionic strength always has a higher water content than coacervates formed at lower ionic strength. However, at high MB overall concentration, because of the higher partition coefficient for MB of the coacervate formed at higher ionic strength, the ternary coacervate formed at higher ionic strength has a lower water content.
3.6 Effect of molecular weight of PAA on composition of ternary coacervate
The molecular weight of PAA used in the coacervation process was also shown to influence the composition of the coacervate. Increasing the molecular weight of the PAA in the polyanion solution led to an increase in the SPS/polyanion % in the final coacervate phase (Fig. 8). No significant difference was observed in the SPS compositions of coacervates formed using 50![[thin space (1/6-em)]](https://www.rsc.org/images/entities/char_2009.gif) 000 and 100
000 and 100![[thin space (1/6-em)]](https://www.rsc.org/images/entities/char_2009.gif) 000 PAA. However, the increase to 345
000 PAA. However, the increase to 345![[thin space (1/6-em)]](https://www.rsc.org/images/entities/char_2009.gif) 000 and 1
000 and 1![[thin space (1/6-em)]](https://www.rsc.org/images/entities/char_2009.gif) 000
000![[thin space (1/6-em)]](https://www.rsc.org/images/entities/char_2009.gif) 000 g mol−1 introduces a larger increase in the % SPS in the coacervates. It is possible that the lower molecular weight PAA may be able to diffuse faster in the coacervation process, therefore occupying more sites interacting with BPEI via electrostatic interactions that would otherwise be occupied by SPS chains. SPS/polyanion % of the ternary coacervate prepared using 1
000 g mol−1 introduces a larger increase in the % SPS in the coacervates. It is possible that the lower molecular weight PAA may be able to diffuse faster in the coacervation process, therefore occupying more sites interacting with BPEI via electrostatic interactions that would otherwise be occupied by SPS chains. SPS/polyanion % of the ternary coacervate prepared using 1![[thin space (1/6-em)]](https://www.rsc.org/images/entities/char_2009.gif) 000
000![[thin space (1/6-em)]](https://www.rsc.org/images/entities/char_2009.gif) 000 MW PAA with a longer stirring time of 12 h was studied using FTIR as well. However, there is no significant difference between the SPS/polyanion % of the samples prepared by stirring for 3 h or stirring for 12 h. One possibility is that equilibrium is quickly achieved in these systems. Another is that once the initial associations between polyelectrolytes are formed, the polycation and polyanions in the coacervate are kinetically trapped, limiting the further complexation with the available polyelectrolyte chains that left in the supernatant. It has been reported that polyelectrolyte complexes form via a two-step process, a fast step of initial step of association followed by chain rearrangement.41,42 However, rearrangements subsequent to the initial associations are reported to happen much more quickly than three hours.
000 MW PAA with a longer stirring time of 12 h was studied using FTIR as well. However, there is no significant difference between the SPS/polyanion % of the samples prepared by stirring for 3 h or stirring for 12 h. One possibility is that equilibrium is quickly achieved in these systems. Another is that once the initial associations between polyelectrolytes are formed, the polycation and polyanions in the coacervate are kinetically trapped, limiting the further complexation with the available polyelectrolyte chains that left in the supernatant. It has been reported that polyelectrolyte complexes form via a two-step process, a fast step of initial step of association followed by chain rearrangement.41,42 However, rearrangements subsequent to the initial associations are reported to happen much more quickly than three hours.
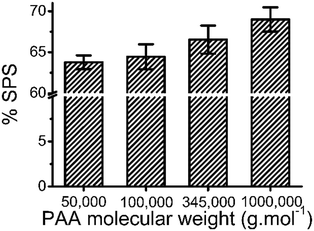 | ||
| Fig. 8 Linear plot of partition coefficient of MB into ternary coacervate vs. relative hydrophobicity. | ||
3.7 Solute stabilization by ternary coacervate
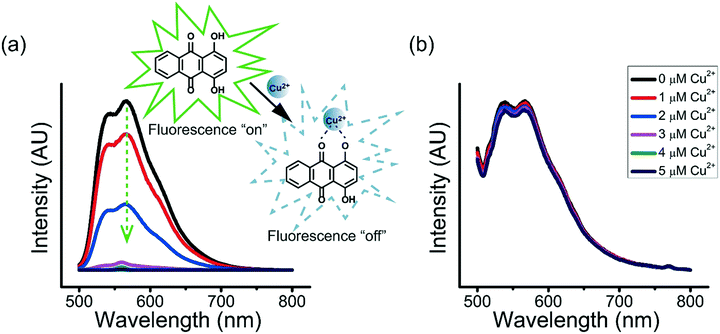
Many enzymes are known for their sensitivity to transition metal ions.43–45 For example, ureases that catalyze the hydrolysis of urea to ammonia and carbon dioxide are sensitive to transition metal ions, with much lowered catalytic efficiency when they are bound to heavy metal ions.45 The inhibition of the binding of enzymes with heavy metal ions to retain their catalytic activity is therefore important.The ternary coacervate can be applied to efficiently stabilize solutes by reducing the complexation of solutes with transition metal ions. Copper ions (Cu2+) and 1,4-dihydroxyanthraquinone (DHAQ) were used to show how the ternary coacervate can significantly reduce the coordination interaction between solute and transition metal ions. In aqueous solutions, DHAQ displays an “ON–OFF” mode fluorescence change with the addition of Cu2+ which most likely results from formation of a DHAQ-Cu2+ complex, where the paramagnetic Cu2+ quenches the DHAQ emission through either electron or energy transfer.46 The fluorescence quenching of the DHAQ emission by Cu2+ was observed to be concentration dependent, and was completely quenched by 1 equiv. of Cu2+ (Fig. 9a). However, addition of Cu2+ ions into the ternary coacervate system containing DHAQ only resulted in quenching of ∼5% of the DHAQ fluorescence in the same concentration range (Fig. 9b), indicating that the ternary coacervate efficiently prevents DHAQ from coordinating with Cu2+ ions. It has been reported that BPEI and PAA both can complex with copper ions via coordination interactions,47,48 and therefore compete with DHAQ to complex with Cu2+ ions, which is consistent with these results.
To demonstrate the capacity of the ternary coacervate system to stabilize DHAQ emission, the fluorescence of DHAQ within binary BPEI–PAA and BPEI–SPS coacervates with the addition of Cu2+ was also studied (Fig. S8a and b†). In these experiments, DHAQ fluorescence was reduced by 16% in BPEI–PAA coacervate suspension and 15% in BPEI–SPS coacervate suspension as the concentration Cu2+ increased from 0 to 5 μM. Both of these systems are therefore less efficient in inhibiting the complexation of DHAQ with Cu2+ than the ternary coacervate system. The sequestration of DHAQ into BPEI–PAA, BPEI–SPS and BPEI–(PAA/SPS) coacervate can be defined as shown in eqn (6). Using this equation, the distribution of DHAQ in the coacervate and the supernatant (Fig. S9†) was determined. The percent sequestration of DHAQ into BPEI–PAA, BPEI–(PAA/SPS) and BPEI–SPS was determined to be ∼28%, ∼54% and ∼74%, respectively. This trend results from the more hydrophobic environment that occurs in the presence of SPS and possibly π–π interactions between SPS and DHAQ.49,50 However, although the sequestration of DHAQ into BPEI–SPS coacervate is the highest among the three types of coacervate, the fluorescence quench of DHAQ (∼15%) is still higher than that of ternary coacervate (∼5%). This shows that both PAA and SPS contribute with PAA competing with DHAQ to complex with Cu2+ ions and therefore inhibiting the quenching of DHAQ fluorescence. Therefore, to best protect the aromatic solute DHAQ from coordination with copper ion, it is necessary to include both SPS and PAA into the coacervate, where SPS plays a role in promoting the inclusion of DHAQ into the coacervate, while PAA competes with DHAQ to coordinate with the copper ions.
 | (6) |
3.8 Rheological properties of complex coacervates
Rheological studies can be useful in characterizing polyelectrolyte complexes as well as polyelectrolyte coacervates.40,51–53 Dynamic rheological measurements were employed to investigate the impact of both the difference in polyanion as well as the salt concentration on the rheological properties of the polyelectrolyte complex coacervates. The dynamic moduli G′ and G′′ are presented as a function of frequency for the complex coacervates formed with a binary system of PAA and BPEI, SPS and BPEI, or a ternary system of PAA, SPS, and BPEI with a ratio of PAA![[thin space (1/6-em)]](https://www.rsc.org/images/entities/char_2009.gif) :
:![[thin space (1/6-em)]](https://www.rsc.org/images/entities/char_2009.gif) SPS = 1
SPS = 1![[thin space (1/6-em)]](https://www.rsc.org/images/entities/char_2009.gif) :
:![[thin space (1/6-em)]](https://www.rsc.org/images/entities/char_2009.gif) 1 at different salt concentrations. The experiments were performed at a constant strain of 0.6%, which was found to be in the linear regime.
1 at different salt concentrations. The experiments were performed at a constant strain of 0.6%, which was found to be in the linear regime.
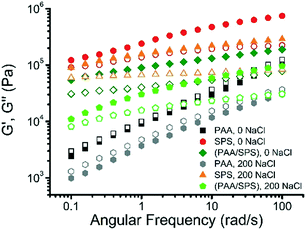
The viscoelastic behavior of the coacervate is strongly dependent on both the type of polyanion and salt concentration, as shown in Fig. 10. For the BPEI–SPS coacervates formed at 0 mM NaCl concentration, the storage modulus (G′) is significantly higher than the loss modulus (G′′) at all frequencies measured, indicating that the BPEI–SPS coacervates are more solid-like in behavior. For comparison, the BPEI–PAA coacervates formed under the same condition have much smaller G′ and G′′ values than both the BPEI–SPS and BPEI–(PAA/SPS) coacervate samples. In addition, the G′ and G′′ values of the BPEI–PAA coacervate nearly collapse onto one another with slopes of ∼0.5, which is characteristic for critical gel state, a new material state between liquid and solid.54 Similar slopes have also been found in hydrogen bonded polymer melts, in which the presence of hydrogen bonds causes G′ and G′′ as a function of frequency to shift to a power law scaling of 0.5,55 meaning that the associating polyelectrolytes here behave similar to associating hydrogen bonding polymers. It can be inferred from this that there is a higher density of ionic crosslinks in the BPEI–SPS coacervates compared to the BPEI–PAA coacervates, or that the interactions themselves are stronger. By using a mixture of PAA and SPS as the polyanion solution to form the coacervate with BPEI, it is possible to tune the rheological properties of the prepared coacervates. For example, the BPEI–(PAA/SPS) coacervates formed using BPEI stock solution (pH = 6.5) and polyanion stock solution (a mixture of PAA and SPS with a ratio of PAA![[thin space (1/6-em)]](https://www.rsc.org/images/entities/char_2009.gif) :
:![[thin space (1/6-em)]](https://www.rsc.org/images/entities/char_2009.gif) SPS = 1
SPS = 1![[thin space (1/6-em)]](https://www.rsc.org/images/entities/char_2009.gif) :
:![[thin space (1/6-em)]](https://www.rsc.org/images/entities/char_2009.gif) 1, pH = 6.5) show rheological behavior similar to that of BPEI–SPS coacervates, but the values of G′ and G′′ of the ternary coacervate are lower than that of BPEI–SPS coacervates and higher than that of BPEI–PAA coacervates.
1, pH = 6.5) show rheological behavior similar to that of BPEI–SPS coacervates, but the values of G′ and G′′ of the ternary coacervate are lower than that of BPEI–SPS coacervates and higher than that of BPEI–PAA coacervates.
The rheological properties of both the binary and ternary coacervates also change with varying salt concentration. It has been shown that varying the ionic strength changes the rheological properties of complex coacervates because of the screening effect.40,56 In addition to varying the composition of PAA and SPS in the ternary coacervates, varying ionic strength is another lever with which to tune the viscoelastic behavior of the coacervate material. In this study, both the BPEI–PAA and BPEI–SPS binary coacervate formed at 200 mM NaCl concentration show smaller G′ and G′′ values than the corresponding binary coacervate prepared at 0 mM NaCl, indicating that screening effect on the charges result in weakened ionic crosslinks between polyelectrolyte chains within the coacervate. Though the G′ and G′′ were reduced as a result of the weakened intermolecular electrostatic interaction for both BPEI–SPS and BPEI–PAA coacervate, the rheological behavior for the BPEI–SPS and BPEI–PAA coacervate prepared with the presence of 200 mM NaCl is quite different. For BPEI–SPS coacervate prepared at 200 mM, the G′ is still much larger than G′′, indicating that the BPEI–SPS coacervate prepared at 200 mM NaCl is still more solid-like, similar to the BPEI–SPS coacervate prepared at 0 mM NaCl. However, for the BPEI–PAA coacervate prepared at 200 mM NaCl, the G′ and G′′ still approximately overlap with each other, with slopes of ∼0.5, which is again characteristic for critical gel state.
The rheological properties of BPEI–(PAA/SPS) ternary coacervates formed with either 0 or 200 mM NaCl concentration were investigated as well. The viscoelastic behavior of the ternary coacervates is strongly dependent on the salt concentration, as shown in Fig. 10. For the coacervates formed with the lower salt concentration (0 mM NaCl), the storage (G′) modulus is more than 2 times higher than that of the ternary coacervates formed at higher salt concentration (200 mM NaCl), while the loss moduli (G′′) of these two coacervates are similar. As a higher G′ value usually indicates a stronger network structure with increased ionic crosslink density and/or strength of ion pair bond between BPEI and SPS compared to BPEI and PAA, the variation of G′ values with salt concentration suggests that an increase in ionic strength leads to the dissolution of crosslinks as a result of charge screening effect.51,57
The rheological tuneability of the ternary coacervate may prove useful for certain applications. For example, rheological properties of polyelectrolyte-protein coacervate is of importance in the design of dairy formulations in the food industry.58,59 One might imagine that pharmaceutical or cosmetic creams or lotions may require specific rheological properties to be spread on the skin without being tacky or sticky while also being loaded with pigments or other active compounds. By tuning the rheological properties of coacervate, coacervate-based cosmetics or food products with the desired loading of active components, texture, and modified flow characteristics can be produced.
Conclusions
In this work, the assembly of three synthetic polyelectrolytes into a composition- and rheological property-tunable complex ternary coacervate was investigated by mixing BPEI with a binary mixture of PAA and SPS. A systematic study on how the ionic strength, stoichiometry, molecular weight, and the presence of the cationic dye MB impacts the composition as well as viscoelastic property of the ternary coacervate was performed. These results can be used in future work to create coacervate with specific proportions of chemical functionality and/or rheological properties.Generally, the strong polyelectrolyte (SPS) outcompetes the partially charged weak polyelectrolyte PAA in binding with BPEI, but this can be mediated by adding salt which increases the ionization of PAA and also overall weakens the electrostatic interactions between polyelectrolyte chains, equalizing differences in binding between sulfonate and amine compared to carboxylic acid and amine. The partition coefficient of MB in the ternary coacervate at a given MB concentration increases with the SPS/polyanion %, indicating that a higher concentration of SPS in the coacervate enhances the uptake of MB, because of the interactions between SPS and MB. The presence of MB in the ternary coacervate system, especially at high concentration, plays a role itself in tuning the composition of the coacervate, as well as the dye uptake ability and the hydrophobicity of the coacervate environment. Specifically, a large accumulation of MB within ternary coacervate leads to more SPS than PAA being brought into the coacervate, again due to the SPS and MB interactions, which are both π–π interactions and electrostatics while PAA and MB interact through electrostatics only. In addition, as the concentration of MB increases, the partition coefficient of MB into the ternary coacervate with accumulated MB also increases, making coacervate material with an accumulation of MB more efficient at sequestering MB than coacervate alone. Using ANS as a probe, fluorescence spectra of ANS within the ternary coacervate with the addition of MB in the system was measured to determine the hydrophobicity of different coacervate compositions. Accumulated MB within the ternary coacervate significantly enhances hydrophobicity or more precisely the creation of an apolar environment, explaining the enhanced dye uptake. An increase in PAA molecular weight leads to an increase in the SPS/polyanion % in the ternary coacervate. In addition, the ternary coacervate can be used to stabilize solutes by efficiently inhibiting the complexation of those solutes with heavy metal ions such as copper ions, which might be applicable in retaining enzyme activity in some aqueous solutions. Rheological measurements of the coacervate samples suggest that by varying polyanion composition or ionic strength, the viscoelastic properties of the coacervates can be tuned, providing a simple and versatile method for designing coacervate materials with a range of properties.
Conflicts of interest
The authors declare no competing financial interest.Acknowledgements
The authors would like to acknowledge support from NSF award DMR-1425187. The authors would also like to thank Prof. Xiong Gong of the University of Akron for use of his UV-vis equipment.References
- F. Comert, A. J. Malanowski, F. Azarikia and P. L. Dubin, Soft Matter, 2016, 12, 4154–4161 RSC.
- E. Kizilay, A. B. Kayitmazer and P. L. Dubin, Adv. Colloid Interface Sci., 2011, 167, 24–37 CrossRef CAS PubMed.
- H. Dautzenberg and J. Kriz, Langmuir, 2003, 19, 5204–5211 CrossRef CAS.
- C. G. De Kruif, F. Weinbreck and R. De Vries, Curr. Opin. Colloid Interface Sci., 2004, 9, 340–349 CrossRef CAS.
- J. Požar and D. Kovačević, Soft Matter, 2014, 10, 6530–6545 RSC.
- M. Li, X. Huang, D. Tang, S. Mann, P. L. Luisi, P. Stano and C. Chiarabelli, Curr. Opin. Chem. Biol., 2014, 22, 1–11 CrossRef CAS PubMed.
- J. Qin, D. Priftis, R. Farina, S. L. Perry, L. Leon, J. Whitmer, K. Hoffmann, M. Tirrell and J. J. De Pablo, ACS Macro Lett., 2014, 3, 565–568 CrossRef CAS.
- D. Priftis, R. Farina and M. Tirrell, Langmuir, 2012, 28, 8721–8729 CrossRef CAS PubMed.
- M. Zhao and N. S. Zacharia, Macromol. Rapid Commun., 2016, 37, 1249–1255 CrossRef CAS PubMed.
- D. S. Williams, S. Koga, C. R. C. Hak, A. Majrekar, A. J. Patil, A. W. Perriman and S. Mann, Soft Matter, 2012, 8, 6004–6014 RSC.
- N. Martin, M. Li and S. Mann, Langmuir, 2016, 32, 5881–5889 CrossRef CAS PubMed.
- M. Zhao and N. S. Zacharia, J. Chem. Phys., 2018, 149, 163326 CrossRef PubMed.
- F. Shahidi, J. K. V. Arachchi and Y. J. Jeon, Trends Food Sci. Technol., 1999, 10, 37–51 CrossRef CAS.
- B. P. Koppolu, S. G. Smith, S. Ravindranathan, S. Jayanthi, T. K. Suresh Kumar and D. A. Zaharoff, Biomaterials, 2014, 35, 4382–4389 CrossRef CAS PubMed.
- M. Zhao, S. A. Eghtesadi, M. B. Dawadi, C. Wang, S. Huang, A. E. Seymore, B. D. Vogt, D. A. Modarelli, T. Liu and N. S. Zacharia, Macromolecules, 2017, 50, 3818–3830 CrossRef CAS.
- S. Lindhoud and M. M. A. E. Claessens, Soft Matter, 2015, 12, 408–413 RSC.
- S. Dumitriu and E. Chornet, Adv. Drug Delivery Rev., 1998, 31, 223–246 CrossRef CAS.
- J. Crosby, T. Treadwell, M. Hammerton, K. Vasilakis, M. P. Crump, D. S. Williams and S. Mann, Chem. Commun., 2012, 48, 11832–11834 RSC.
- K. Lv, A. W. Perriman and S. Mann, Chem. Commun., 2015, 51, 8600–8602 RSC.
- B. V. V. S. Pavan Kumar, J. Fothergill, J. Bretherton, L. Tian, A. J. Patil, S. A. Davis and S. Mann, Chem. Commun., 2018, 54, 3594–3597 RSC.
- Q. Zhao, D. W. Lee, B. K. Ahn, S. Seo, Y. Kaufman, J. N. Israelachvili and J. H. Waite, Nat. Mater., 2016, 15, 1–20 CrossRef PubMed.
- S. Lim, Y. S. Choi, D. G. Kang, Y. H. Song and H. J. Cha, Biomaterials, 2010, 31, 3715–3722 CrossRef CAS PubMed.
- B. K. Ahn, S. Das, R. Linstadt, Y. Kaufman, N. R. Martinez-Rodriguez, R. Mirshafian, E. Kesselman, Y. Talmon, B. H. Lipshutz, J. N. Israelachvili and J. H. Waite, Nat. Commun., 2015, 6, 1–7 Search PubMed.
- S. Lim, D. Moon, H. J. Kim, J. H. Seo, I. S. Kang and H. J. Cha, Langmuir, 2014, 30, 1108–1115 CrossRef CAS PubMed.
- D. Priftis, X. Xia, K. O. Margossian, S. L. Perry, L. Leon, J. Qin, J. J. De Pablo and M. Tirrell, Macromolecules, 2014, 47, 3076–3085 CrossRef CAS.
- C. K. Trinh and W. Schnabel, Angew. Makromol. Chem., 1994, 221, 127–135 CrossRef CAS.
- J. F. Quinn, J. C. C. Yeo and F. Caruso, Macromolecules, 2004, 37, 6537–6543 CrossRef CAS.
- J. Fu, H. M. Fares and J. B. Schlenoff, Macromolecules, 2017, 50, 1066–1074 CrossRef CAS.
- J. M. Serratosa, W. D. Johns and A. Shimoyama, Clays Clay Miner., 1970, 18, 107–113 CrossRef CAS.
- J. Choi and M. F. Rubner, Macromolecules, 2005, 38, 116–124 CrossRef CAS.
- P. Zhang, J. He and X. Zhou, Polym. Test., 2008, 27, 153–157 CrossRef CAS.
- N. S. Zacharia, M. Modestino and P. T. Hammond, Macromolecules, 2007, 40, 9523–9528 CrossRef CAS.
- J. C. Yang, M. J. Jablonsky and J. W. Mays, Polymer, 2002, 43, 5125–5132 CrossRef CAS.
- K. Daze and F. Hof, in Encyclopedia of Physical Organic Chemistry, ed. Z. Wang, U. Wille and E. Juaristi, John Wiley & Sons, Inc., Hoboken, NJ, USA, 1st edn, 2017, ch. 29, vol. 3, pp. 1529–1580 Search PubMed.
- I. Moreno-Villoslada, C. Torres-Gallegos, R. Araya-Hermosilla and H. Nishide, J. Phys. Chem. B, 2010, 114, 4151–4158 CrossRef CAS PubMed.
- K. A. Black, D. Priftis, S. L. Perry, J. Yip, W. Y. Byun and M. Tirrell, ACS Macro Lett., 2014, 3, 1088–1091 CrossRef CAS.
- D. Matulis and R. Lovrien, Biophys. J., 1998, 74, 422–429 CrossRef CAS PubMed.
- D. Priftis and M. Tirrell, Soft Matter, 2012, 8, 9396–9405 RSC.
- E. Spruijt, A. H. Westphal, J. W. Borst, M. A. Cohen Stuart and J. Van Der Gucht, Macromolecules, 2010, 43, 6476–6484 CrossRef CAS.
- X. Wang, J. Lee, Y. Wang and Q. Huang, Biomacromolecules, 2007, 8, 992–997 CrossRef CAS PubMed.
- L. Vitorazi, N. Ould-Moussa, S. Sekar, J. Fresnais, W. Loh, J.-P. Chapel and J.-F. Berret, Soft Matter, 2014, 10, 9496–9505 RSC.
- D. Priftis, K. Megley, N. Laugel and M. Tirrell, J. Colloid Interface Sci., 2013, 398, 39–50 CrossRef CAS PubMed.
- A. A. Kaplia, Ukr. Biochem. J., 2016, 88, 20–28 CrossRef CAS PubMed.
- B. Duffy, C. Schwietert, A. France, N. Mann, K. Culbertson, B. Harmon and J. P. McCue, Biol. Trace Elem. Res., 1998, 64, 197–213 CrossRef CAS PubMed.
- B. Krajewska, J. Enzyme Inhib. Med. Chem., 2008, 23, 535–542 CrossRef CAS PubMed.
- S. H. Mashraqui, M. Chandiramani, R. Betkar and K. Poonia, Tetrahedron Lett., 2010, 51, 1306–1308 CrossRef CAS.
- J. A. Marinsky, N. Imai and M. C. Lim, Isr. J. Chem., 1973, 11, 601–622 CrossRef CAS.
- V. N. Kislenko and L. P. Oliynyk, J. Polym. Sci., Part A: Polym. Chem., 2002, 40, 914–922 CrossRef CAS.
- C. A. Hunter and J. K. M. Sanders, J. Am. Chem. Soc., 1990, 112, 5525–5534 CrossRef CAS.
- R. V. Klitzing, A. Espert, A. Asnacios, T. Hellweg, A. Colin and D. Langevin, Colloids Surf., A, 1999, 149, 131–140 CrossRef CAS.
- H. Zhang, C. Wang, G. Zhu and N. S. Zacharia, ACS Appl. Mater. Interfaces, 2016, 8, 26258–26265 CrossRef CAS PubMed.
- S. Huang, M. Zhao, M. B. Dawadi, Y. Cai, Y. Lapitsky, D. A. Modarelli and N. S. Zacharia, J. Colloid Interface Sci., 2018, 518, 216–224 CrossRef CAS PubMed.
- M. W. Liberatore, N. B. Wyatt, M. Henry, P. L. Dubin and E. Foun, Langmuir, 2009, 25, 13376–13383 CrossRef CAS PubMed.
- F. Chambon and H. H. Winter, J. Rheol., 1987, 31, 683–697 CrossRef CAS.
- A. Shabbir, H. Goldansaz, O. Hassager, E. Van Ruymbeke and N. J. Alvarez, Macromolecules, 2015, 48, 5988–5996 CrossRef CAS.
- D. Priftis, K. Megley, N. Laugel and M. Tirrell, J. Colloid Interface Sci., 2013, 398, 39–50 CrossRef CAS PubMed.
- C. Wang, C. G. Wiener, Z. Cheng, B. D. Vogt and R. A. Weiss, Macromolecules, 2016, 49, 9228–9238 CrossRef CAS.
- M. Corredig, N. Sharafbafi and E. Kristo, Food Hydrocolloids, 2011, 25, 1833–1841 CrossRef CAS.
- C. Li, W. Li, X. Chen, M. Feng, X. Rui, M. Jiang and M. Dong, LWT--Food Sci. Technol., 2014, 57, 477–485 CrossRef CAS.
Footnote |
| † Electronic supplementary information (ESI) available. See DOI: 10.1039/c8me00069g |
| This journal is © The Royal Society of Chemistry 2019 |

