
Self-assembly of spheroidal triblock Janus nanoparticle solutions in nanotubes
Yusei
Kobayashi
 *a,
Takuya
Inokuchi
a,
Atushi
Nishimoto
a and
Noriyoshi
Arai
*ab
*a,
Takuya
Inokuchi
a,
Atushi
Nishimoto
a and
Noriyoshi
Arai
*ab
aDepartment of Mechanical Engineering, Kindai University, 3–4–1 Kowakae, Higashiosaka, Osaka, Japan. E-mail: kobayashiyusei@gmail.com
bResearch Institute for Science and Technology, Kindai University, 3–4–1 Kowakae, Higashiosaka, Osaka, Japan. E-mail: arai@mech.kindai.ac.jp; Fax: +81 6 4307 3483; Tel: +81 6 6727 2024
First published on 5th December 2018
Abstract
We have performed coarse-grained molecular simulations to investigate the morphologies and phase diagrams of self-assembled spheroidal triblock Janus nanoparticles (JNPs) confined in nanotubes. Nanoparticles exhibit several unique behaviours through shape changes, such as high thermal conductivity in heat pipes, high strength of binding avidity in ligand–receptor interactions, high amounts of uptake between cells during endocytosis processes, and so on. In this study, we focus on the effect of shape on self-assembled structures or phases within nanospaces. We derived qualitative phase diagrams of axial pressure versus the ratio of the diameter of the nanoparticles and nanotubes. Two distinct types of nanotube walls and three types of JNP shapes were considered: hydrophobic and hydrophilic walls, and NP aspect ratios of 1.5, 2.0, and 2.5. We observed diverse morphologies in spheroidal JNP solutions, many of which have not been observed before in bulk solutions. We also compared the self-assembled structures of spherical triblock JNPs. By increasing the aspect ratio of the NPs, clusters of unique structures, such as tripods, tetrapods, and hexapods, were formed. Moreover, we found that an increase in the value of the aspect ratio leads to a shift in the multilayer toroidal stacking phases to a weaker confinement effect. The self-assembly behaviours of the spheroidal JNPs can be qualitatively predicted based on the chemical nature of the nanotube walls and shapes of the JNPs.
Design, System, ApplicationThe prediction and control of the self-assembly of nanoparticles constitute a useful process in materials chemistry and engineering. The shape of nanoparticles plays a crucial role in the programmed self-assembly. In this work, we show characterization evidence of spheroidal Janus nanoparticles and derive qualitative phase diagrams of axial pressure versus the ratio of the diameter of the nanoparticles and nanotubes. Triblock Janus spheroidal nanoparticles can be assembled into various structures and phases through connections of their hydrophobic functional groups. The aspect ratio of the nanoparticles plays an important part in manipulating the forces between the nanotubes confined in nanospaces. Hence, using some aspect ratio values and two distinct types of nanotube walls, we create phase diagrams of the self-assembled morphologies of spheroidal nanoparticles and compare them with the self-assembled structures of spherical nanoparticles. We can expect that, using the identified self-assembled morphologies, significant variations in the mechanical and rheological properties can be obtained. Moreover, the information presented in this paper is also valuable in identifying the synthesis conditions required to achieve the desired properties. These asymmetric nanoparticles have potential for application in the fields of medicine, therapeutics, and photocatalysis in the future. |
1 Introduction
The self-assembly of soft matter is involved in various functional materials that are common in our daily lives. This is because specific functions are expressed by the self-assembly of materials. There are unique relationships between the self-assembly and the physical properties exhibited by materials. Drastic changes in physical properties occur when the assembled morphology changes due to thermodynamic conditions or surrounding environments.1,2 In particular, self-assembled materials of colloidal nanoparticles (NPs) can be employed for applications such as photonic crystals,3,4 optical devices,5,6 and catalysis,7,8 among many others.Hence, understanding and controlling the self-assembly processes and structures of colloidal NPs have received considerable attention in materials chemistry and engineering. It is known that designing NPs with anisotropic shapes is a useful strategy for controlling the morphologies of self-assembled NPs.9–12 Lee et al.13 presented a method for generating diverse and monodisperse anisotropic gold nanoparticle shapes with various tip geometries through either oxidative etching or seed-mediated growth of purified, monodisperse gold bipyramids. They investigated various morphologies of NPs by controlling the shape of oxidatively etched nanorods. Liu et al.14 fabricated NPs with designed anisotropic and selective interactions through the integration of NPs and DNA origami frames. They showed that it is possible to design diverse planar architectures, including periodic arrays, simple shapes, and complex meso-architectures that spontaneously emerge on mixing different topological types of NPs. Liu et al.15 investigated the effect of the aspect ratio of NPs on the self-assembled structure and self-assembly process. Each NP is an ellipsoidal core with two semi-surfaces coded with dissimilar properties. This study showed that the size and structure of self-assembled structures can be controlled by the aspect ratio. Munaò et al.16 simulated a model which was colloidal dumbbells consisting of two identical tangent hard spheres by Monte Carlo simulation. They reported that the self-assembled structures are affected by the relative size of the two spheres. Moreover, Eslami et al.17 investigated the relationship between surface wettability and solid–liquid thermal transport, and they report the difference of bare surface and graphene-coated surfaces for heat transfer. This result suggests that to modify the surface of the particles affects the physical properties.
Unconventionally ordered assemblies may exhibit novel electronic and optical properties that may not be available in other assemblies. However, the relationship between the shape of anisotropic nanoparticles and their self-assembled structure is not yet completely understood.
In fine flow channels such as lab-on-a-chip, the spatial constraint and influence of solid–liquid interfaces are dominant, and therefore, it is also known that fluids confined in nanoscale channels can exhibit distinct phases not shown in the bulk.18–21 Majumder et al.22 showed experimental evidence that the fluid flow in carbon nanotubes can be four to five orders of magnitude faster than that predicted by conventional fluid-flow theory. Xie et al.23 discovered superfast water transport in carbon nanotubes and graphene nanochannels. They showed that the hydraulic resistance and slippage of single graphene nanochannels can be determined accurately using capillary flow and a novel hybrid nanochannel design, without estimating the capillary pressure.
In some fluids such as water, abnormal dynamical behaviour has been observed due to nanoscale confinement. When complex fluids such as colloidal NP solutions are confined in nanoscale channels, the shear viscosity and morphology of fluids can be significantly affected by the chemical conditions of the confining surfaces.2 Moreover, richer morphologies of self-assembled NPs are expected when they are confined in nanotubes, not only because the dimensional constraint imposed by the nanotubes can affect the thermodynamic equilibrium but also because the added distinctive chemical interactions between the nanotubes, solvent, and hydrophilic and hydrophobic domains will definitely disrupt the existing force balance in the free solution.
In early studies,24,25 various self-assembled morphologies for NP solutions confined in nanotubes were revealed to be focused on the chemical surface design of NPs. We showed that the number of hydrophobic domains is akin to the valence number; hence an increase in the domain leads to easier formation of long-range ordered structures. In this study, we investigate the shape effect of NPs on the self-assembled morphology in nanotubes through changing the aspect ratio. The shape effect is one of the key factors in the formation of supramolecules, including viral capsids,26,27 microtubules,28 and so on. We expect more fundamental insights into the complex interplay between particle anisotropy, self-assembly, and spatial constraint forces. For example, utilizing the self-assembly of anisotropic NPs, it will be feasible to construct a thermal switching system that switches spontaneously according to thermodynamic conditions. This study lays the foundation for this ambitious goal, and serves as a seed for broader nanoarchitectonics in the future.
2 Methods and conditions
2.1 Dissipative particle dynamics
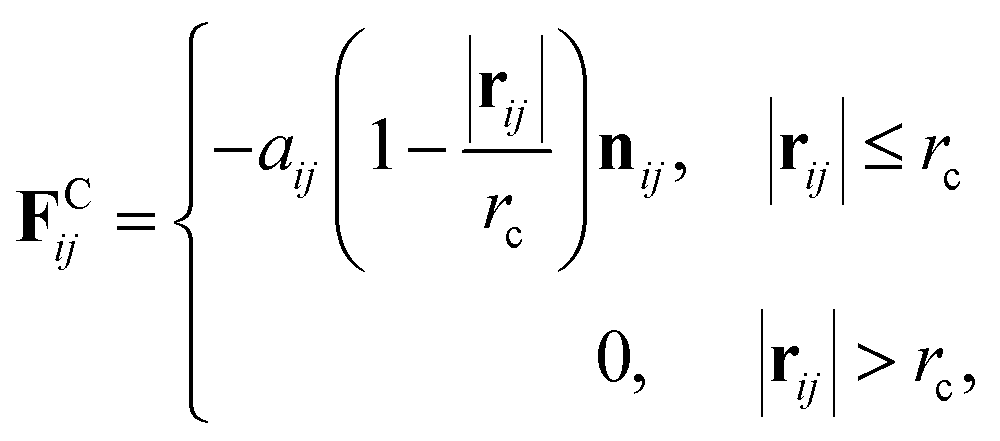
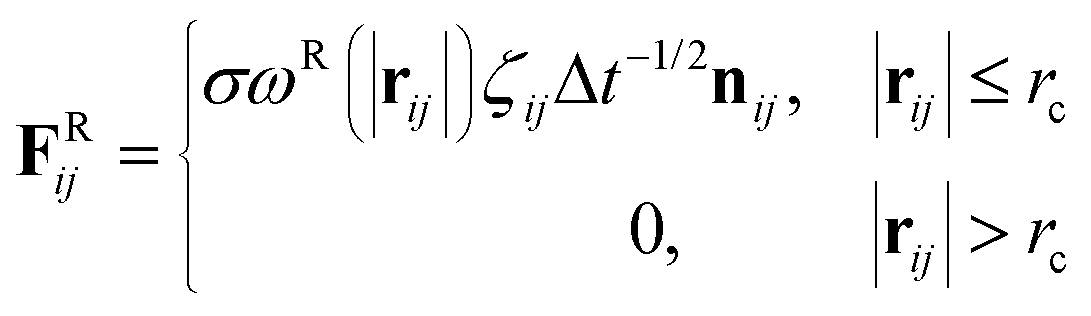
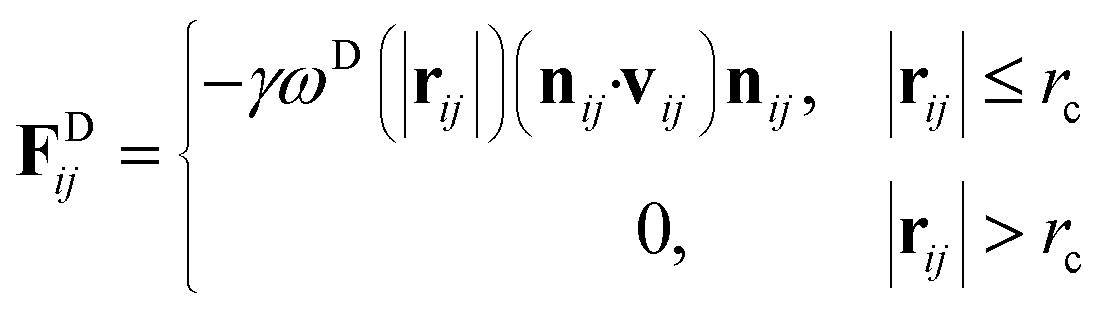
We adopted the dissipative particle dynamics (DPD) method29–31 to investigate the self-assembled morphology of anisotropically shaped NP solutions confined in nanotubes. The DPD method allows the simulation to be performed on millisecond timescales and micrometre length scales, because only the motion of coarse-grained beads (composed of a group of atoms or molecules) needs to be simulated.The fundamental equation of the DPD method is Newton's equation of motion for a particle i, in which each DPD bead is subject to three types of forces: conservative, dissipative, and random. Note that each NP is treated as a rigid body;32 therefore all the DPD beads within the same NP have the same translational velocity, and the intra-NP forces will not be included in Newton's equation of motion. Newton's equation of motion for a particle i is given as
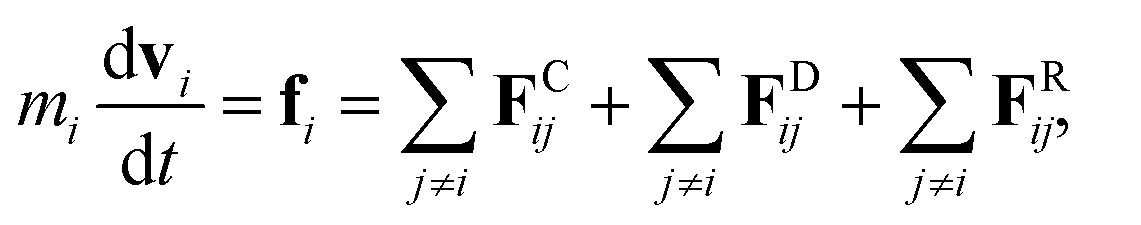 | (1) |
 | (2) |
 | (3) |
 | (4) |
 | (5) |
The temperature is controlled by a combination of dissipative and random forces. The noise parameter σ and friction parameter γ are related to each other by the fluctuation–dissipation theorem given by the following equation
| σ2 = 2γkBT, | (6) |
2.2 Simulation model and conditions
For DPD simulations of a quasi-one-dimensional (Q1D) nanotube system, the periodic boundary conditions are applied in the axial (z) direction. Here, a Q1D system implies a system of beads in domains that are of infinite extent in one direction and of uniformly bounded size in all other directions, such as a carbon nanowire and a carbon nanotube. Fig. 1 shows a model anisotropically shaped triblock NP used in the DPD simulation. The NP consists of both hydrophobic and hydrophilic DPD beads on a diamond lattice with a lattice constant α = 0.47 nm. We examined three types of aspect ratios (ARs) for the anisotropically shaped NPs, i.e. AR = 1.5, 2.0, and 2.5, where the AR is defined as the ratio of the long axis of the NP to the short one. To clarify the shape effect of NPs confined in nanotubes, a triblock Janus nanoparticle (JNP) with hydrophobic poles was employed. The properties of the JNP have been already considered in our earlier study.24 Spheroidal NPs with ARs = 1.5, 2.0, and 2.5 comprise 388, 524, and 636 DPD beads, respectively. The ratio of the hydrophobic poles to hydrophobic bands is fixed at 1![[thin space (1/6-em)]](https://www.rsc.org/images/entities/char_2009.gif) :3:1 in the direction of the long axis.
:3:1 in the direction of the long axis.
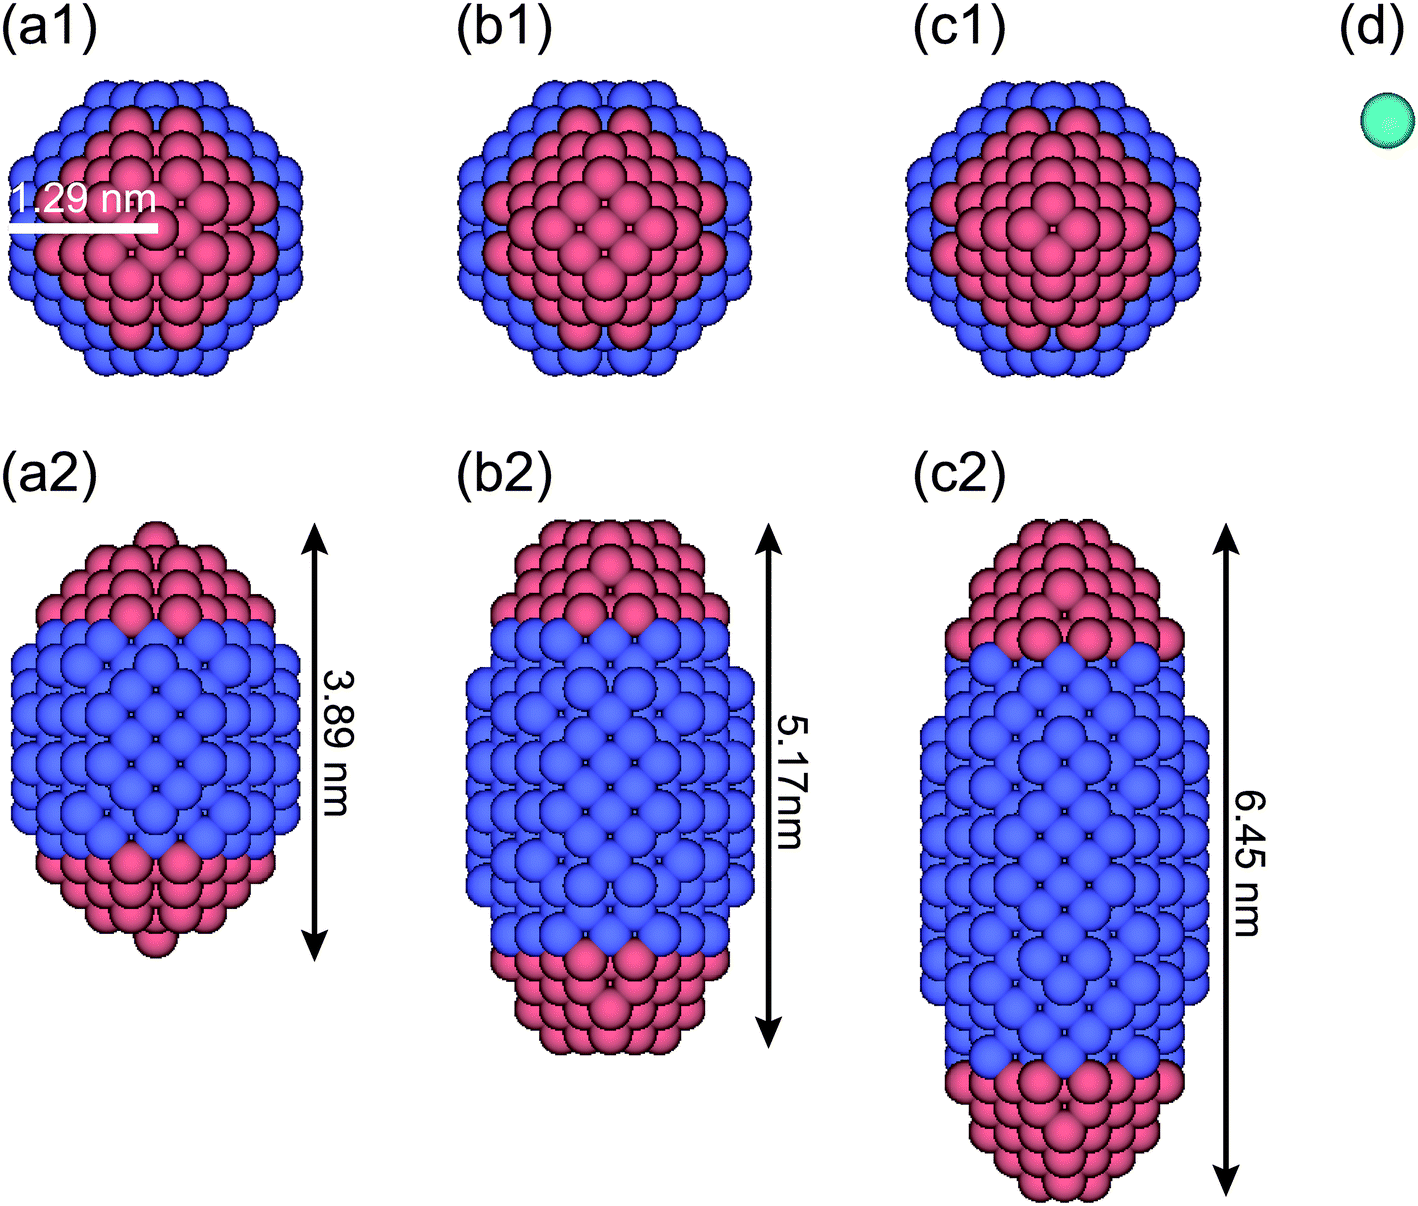 | ||
| Fig. 1 Spheroidal triblock Janus nanoparticle (JNP) models (a)–(c) and water (solvent) model (d). (a) JNP model with aspect ratio (AR) = 1.5. (b) JNP model with AR = 2.0. (c) JNP model with AR = 2.5. The top panels show the top views of the JNP models (a1)–(c1) while the bottom panels show the side views (a2)–(c2). Colour code: hydrophilic domains in blue and hydrophobic domains in red. | ||
The water (solvent) molecule is represented by a single DPD bead, as shown in Fig. 1d (in aqua color). The hydrophobic, hydrophilic, and solvent beads are labelled as O, I, and S, respectively. The interaction parameters between any two DPD beads are shown in Table 1. Note that the interaction parameter between two solvent beads is set at the same value (25kBT/rc) when the number density of the solvent is 3.0, according to the Groot–Warren theory.31 The interaction parameters, aOS (=75 kBT/rc > aSS) and aIS (=25 kBT/rc = aSS), represent the hydrophobic and hydrophilic interactions, respectively.
| O | I | S | |
|---|---|---|---|
| O | 10 | 75 | 75 |
| I | 75 | 100 | 25 |
| S | 75 | 25 | 25 |
The inner surface of a cylindrical nanotube is treated as a smooth wall, similar to our previous studies.24,25,35 The force field of the smooth wall is derived on the basis of a structured wall by summing the DPD forces between every pair of DPD bead and wall.34 The interaction between the sum results in a force function between the DPD bead and the smooth wall (within the cut-off distance, rc) is given by
 | (7) |
| O | I | S | |
|---|---|---|---|
| Hydrophobic wall | 25 | 70 | 70 |
| Hydrophilic wall | 70 | 25 | 25 |
The total number of beads in the supercell varied from 16194 to 22146, depending on the AR. The noise parameter, σ, was set to 3.0, while the friction parameter γ had a value of 4.5. All the simulations were performed using a constant-axial-pressure, Pz and constant-temperature ensemble. It is expected that by increasing Pz, a more ordered NP morphology will be observed. The simulation time is 8.8 μs to achieve equilibration of the system at one state point in the phase diagram. It is affected by the hydrophilic or hydrophobic interactions, i.e., aij or the solubility parameter. For example, if the interaction parameters between each hydrophobic bead of JNPs become higher, the required simulation time to assemble each other can be much shorter. The effect of confinement also influences this time. When under spatial restriction, the collision frequency increases between each JNP. Thus, the stronger confinement can reduce the simulation time to achieve equilibration of the system.
In this simulation, we observed several phases and structures of spheroidal triblock JNP solutions confined in nanotubes. In order to distinguish them, we calculated the coordination number and the radial distribution function (RDF). However, as the Pz is increased, the coordination number sharply increases and becomes constant although different morphologies are observed. Thus, we did not use the coordination number to distinguish several phases and structures of a spheroidal triblock Janus nanoparticle solution. Therefore, we distinguish several phases and structures based only on the radial distribution function (RDF) (see Fig. 2). For the Q1D ordered structure, many individual sharp peaks arose, i.e. long-range correlation of positions was observed, such as a general solid phase. Conversely, for the Q1D liquid phase, a single blunt peak appeared at r ∼ 2.7 nm. Moreover, a single sharp peak (r ∼ 3.0 nm) and a few blunt peaks (r ∼ 2.5, 3.2, and 3.6 nm) also arose in the Q1D amorphous phase.
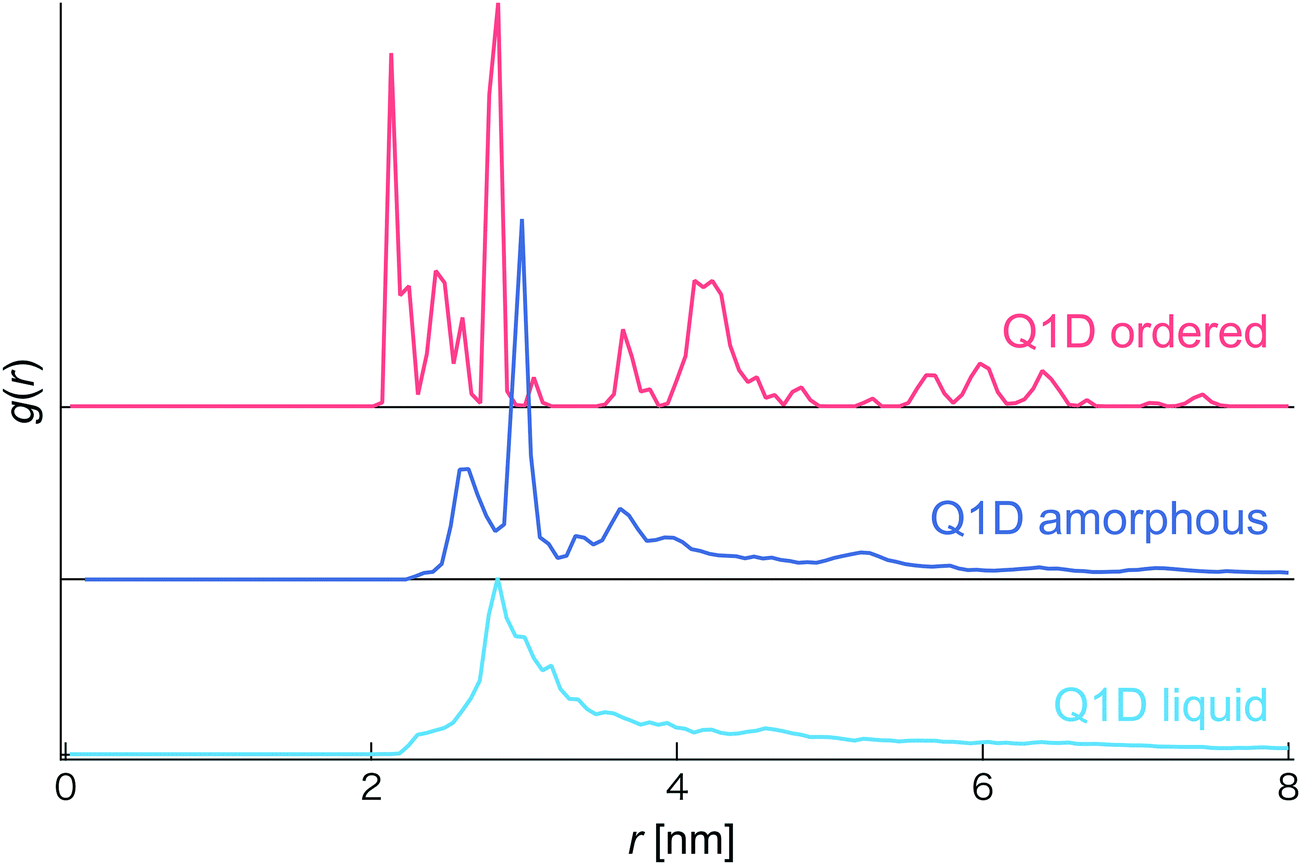 | ||
| Fig. 2 Radial distribution function (RDF) for spheroidal triblock JNP solution (with AR = 2.0) confined in a hydrophobic nanotube of RNT/RNP = 3.0. Here, the RDF is computed using the centre of mass of the JNPs. Red: Q1D ordered phase, blue: Q1D amorphous phase, and cyan: Q1D liquid phase. | ||
3 Results and discussion
We have performed DPD simulations of JNP solutions with different AR values in chemically distinct types of nanotubes. The ARs of the triblock JNPs employed were 1.5 and 2.0, classified as low- and high-aspect ratios, respectively.In Fig. 3–6, we present phase diagrams of representative snapshots of the equilibrium morphologies. The vertical axis represents Pz, and the horizontal axis represents the ratio of the nanotube radius to the semi-minor axis of the JNPs, RNT/RNP. The phase boundaries were drawn schematically.
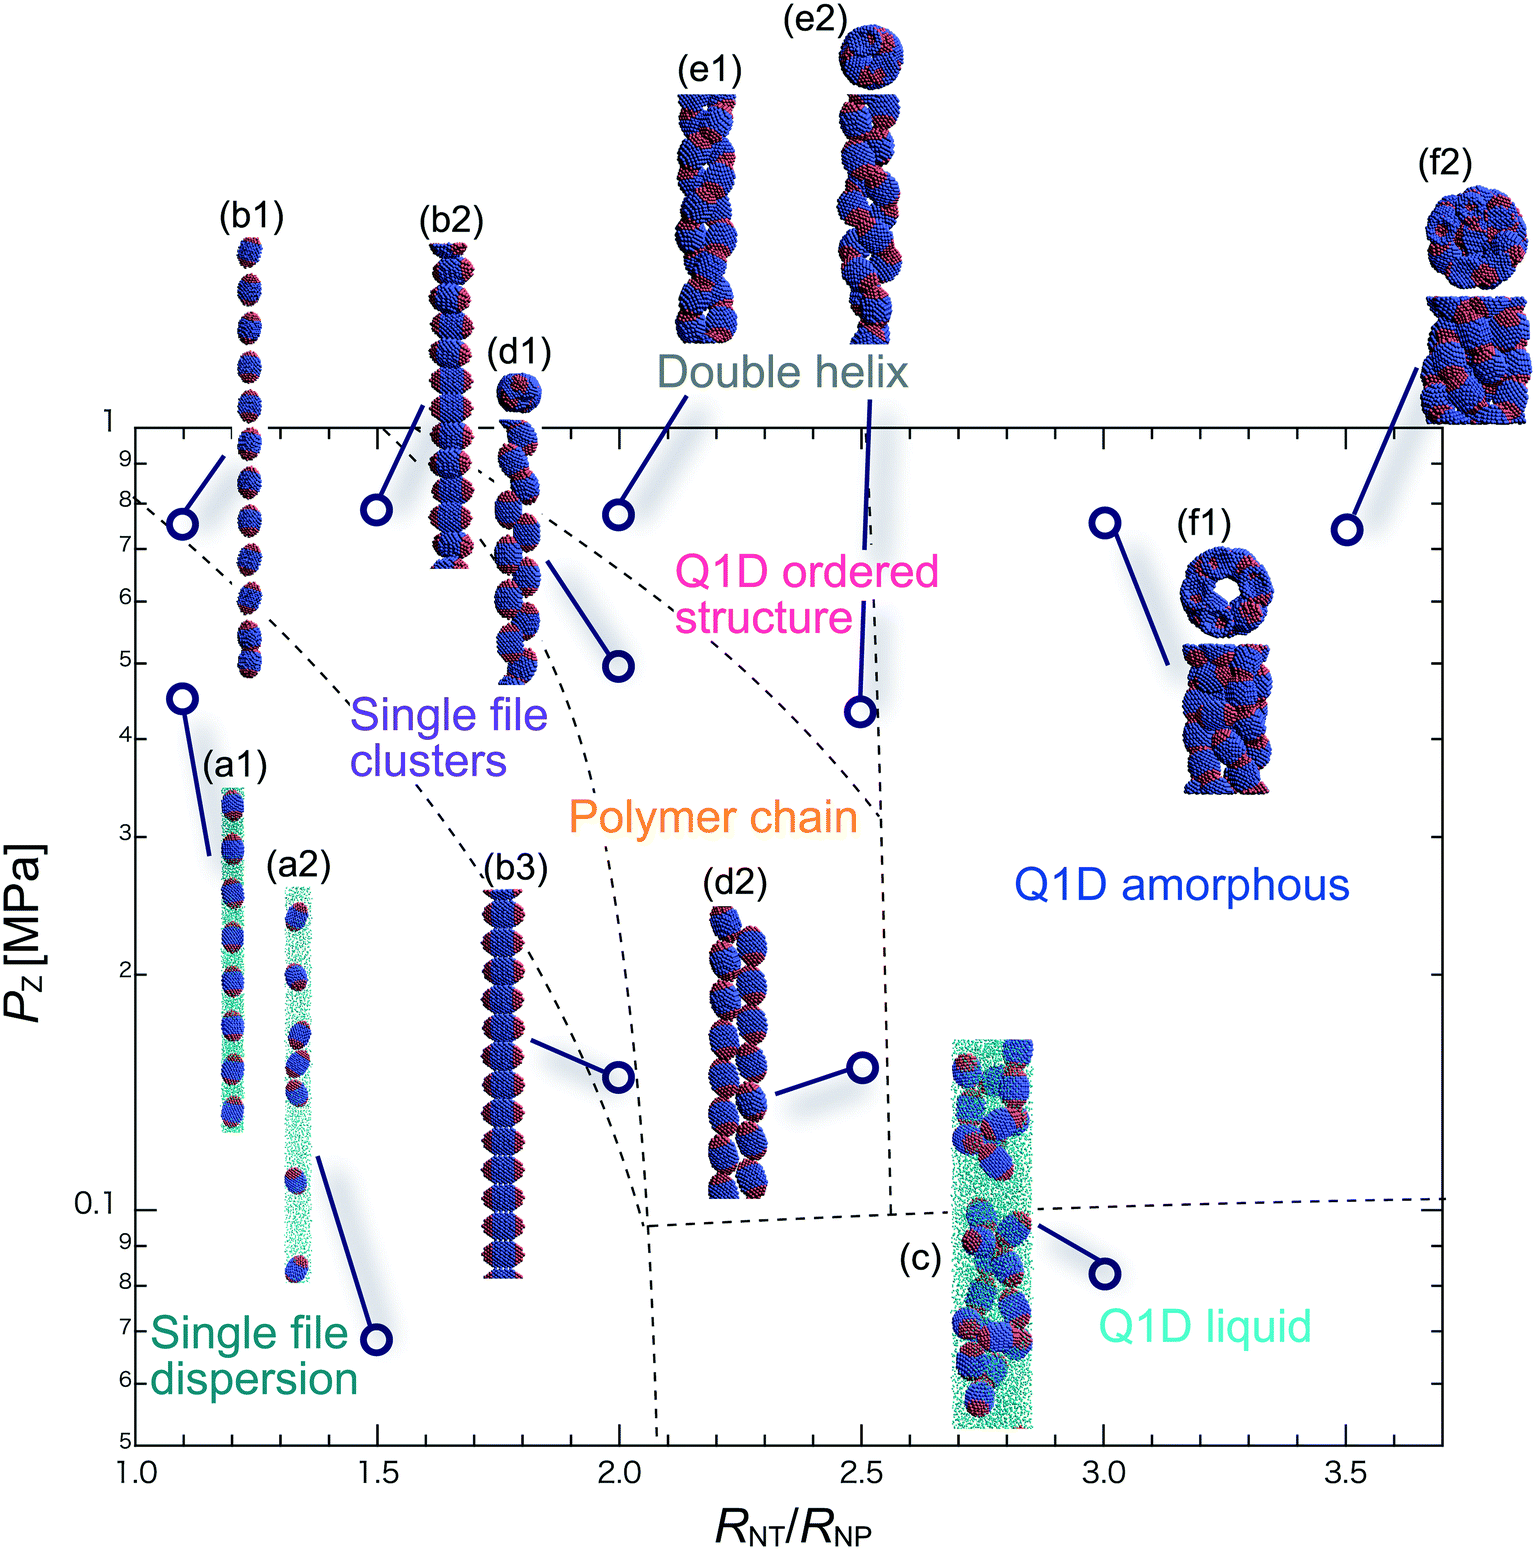 | ||
| Fig. 3 Schematic phase diagram of a triblock JNP solution confined in a hydrophilic nanotube with AR = 1.5. The vertical axis represents the pressure in the axial direction Pz, and the horizontal axis represents the ratio, RNT/RNP, of the radius of the nanotube to that of the JNPs. Insets (a–f): Representative snapshots of equilibrium morphologies of the triblock JNP solution. The nanotube is not shown in this diagram. (a1 and a2) Single file dispersion: the side views at RNT/RNP = 1.1 and Pz = 0.45 MPa and RNT/RNP = 1.5 and Pz = 0.07 MPa, respectively. (b1–b3) Single file clusters: the side views at RNT/RNP = 1.1 and Pz = 0.75 MPa, RNT/RNP = 1.5 and Pz = 0.8 MPa, and RNT/RNP = 2.0 and Pz = 0.15 MPa, respectively. (c) Q1D liquid: the side view at RNT/RNP = 3.0 and Pz = 0.08 MPa. (d1 and d2) Polymer chain: the side views at RNT/RNP = 2.0 and Pz = 0.5 MPa and RNT/RNP = 2.5 and Pz = 0.15 MPa, respectively. (e1 and e2) Q1D ordered structure: double helix: the side views at RNT/RNP = 2.0 and Pz = 0.8 MPa and RNT/RNP = 2.6 and Pz = 0.45 MPa, respectively. (f1 and f2) Q1D amorphous: the side views at RNT/RNP = 3.0 and Pz = 0.8 MPa and RNT/RNP = 3.5 and Pz = 0.8 MPa, respectively. Colour code: solvent molecules in cyan, hydrophilic groups in blue, and hydrophobic groups in red. | ||
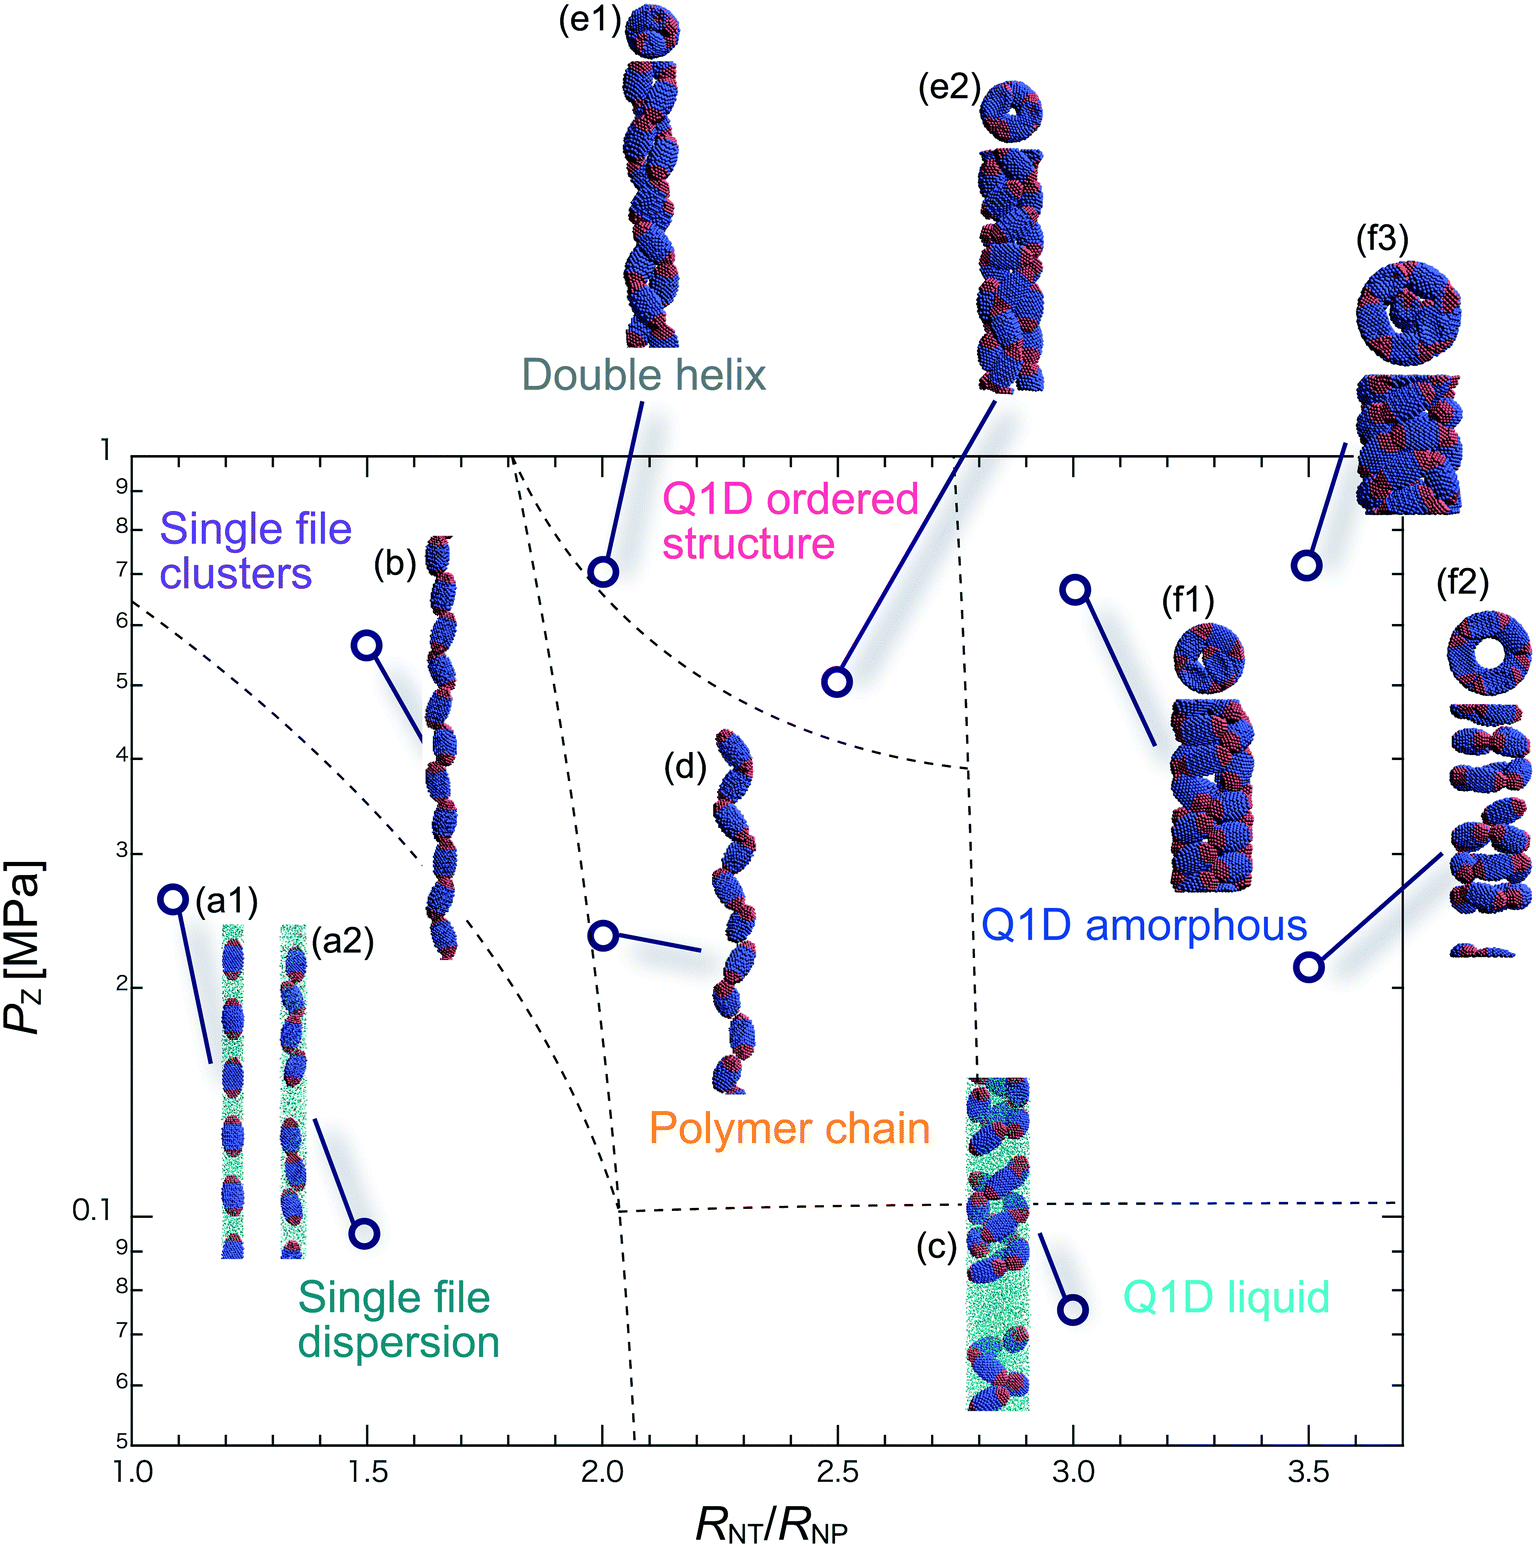 | ||
| Fig. 4 Schematic phase diagram of a triblock JNP solution confined in a hydrophilic nanotube with AR = 2.0. Insets (a–f): Representative snapshots of equilibrium morphologies of the triblock JNP solution. (a1 and a2) Single file dispersion: the side views at RNT/RNP = 1.1 and Pz = 0.25 MPa and RNT/RNP = 1.5 and Pz = 0.09 MPa, respectively. (b) Single file clusters: the side view at RNT/RNP = 1.5 and Pz = 0.55 MPa. (c) Q1D liquid: the side view at RNT/RNP = 3.0 and Pz = 0.075 MPa. (d) Polymer chain: the side view at RNT/RNP = 2.0 and Pz = 0.25 MPa. (e1 and e2) Q1D ordered structure: double helix: the side views at RNT/RNP = 2.0 and Pz = 0.7 MPa and RNT/RNP = 2.6 and Pz = 0.5 MPa, respectively. (f1–f3) Q1D amorphous: the side views at RNT/RNP = 3.0 and Pz = 0.65 MPa, RNT/RNP = 3.5 and Pz = 0.2 MPa, and RNT/RNP = 3.5 and Pz = 0.7 MPa, respectively. | ||
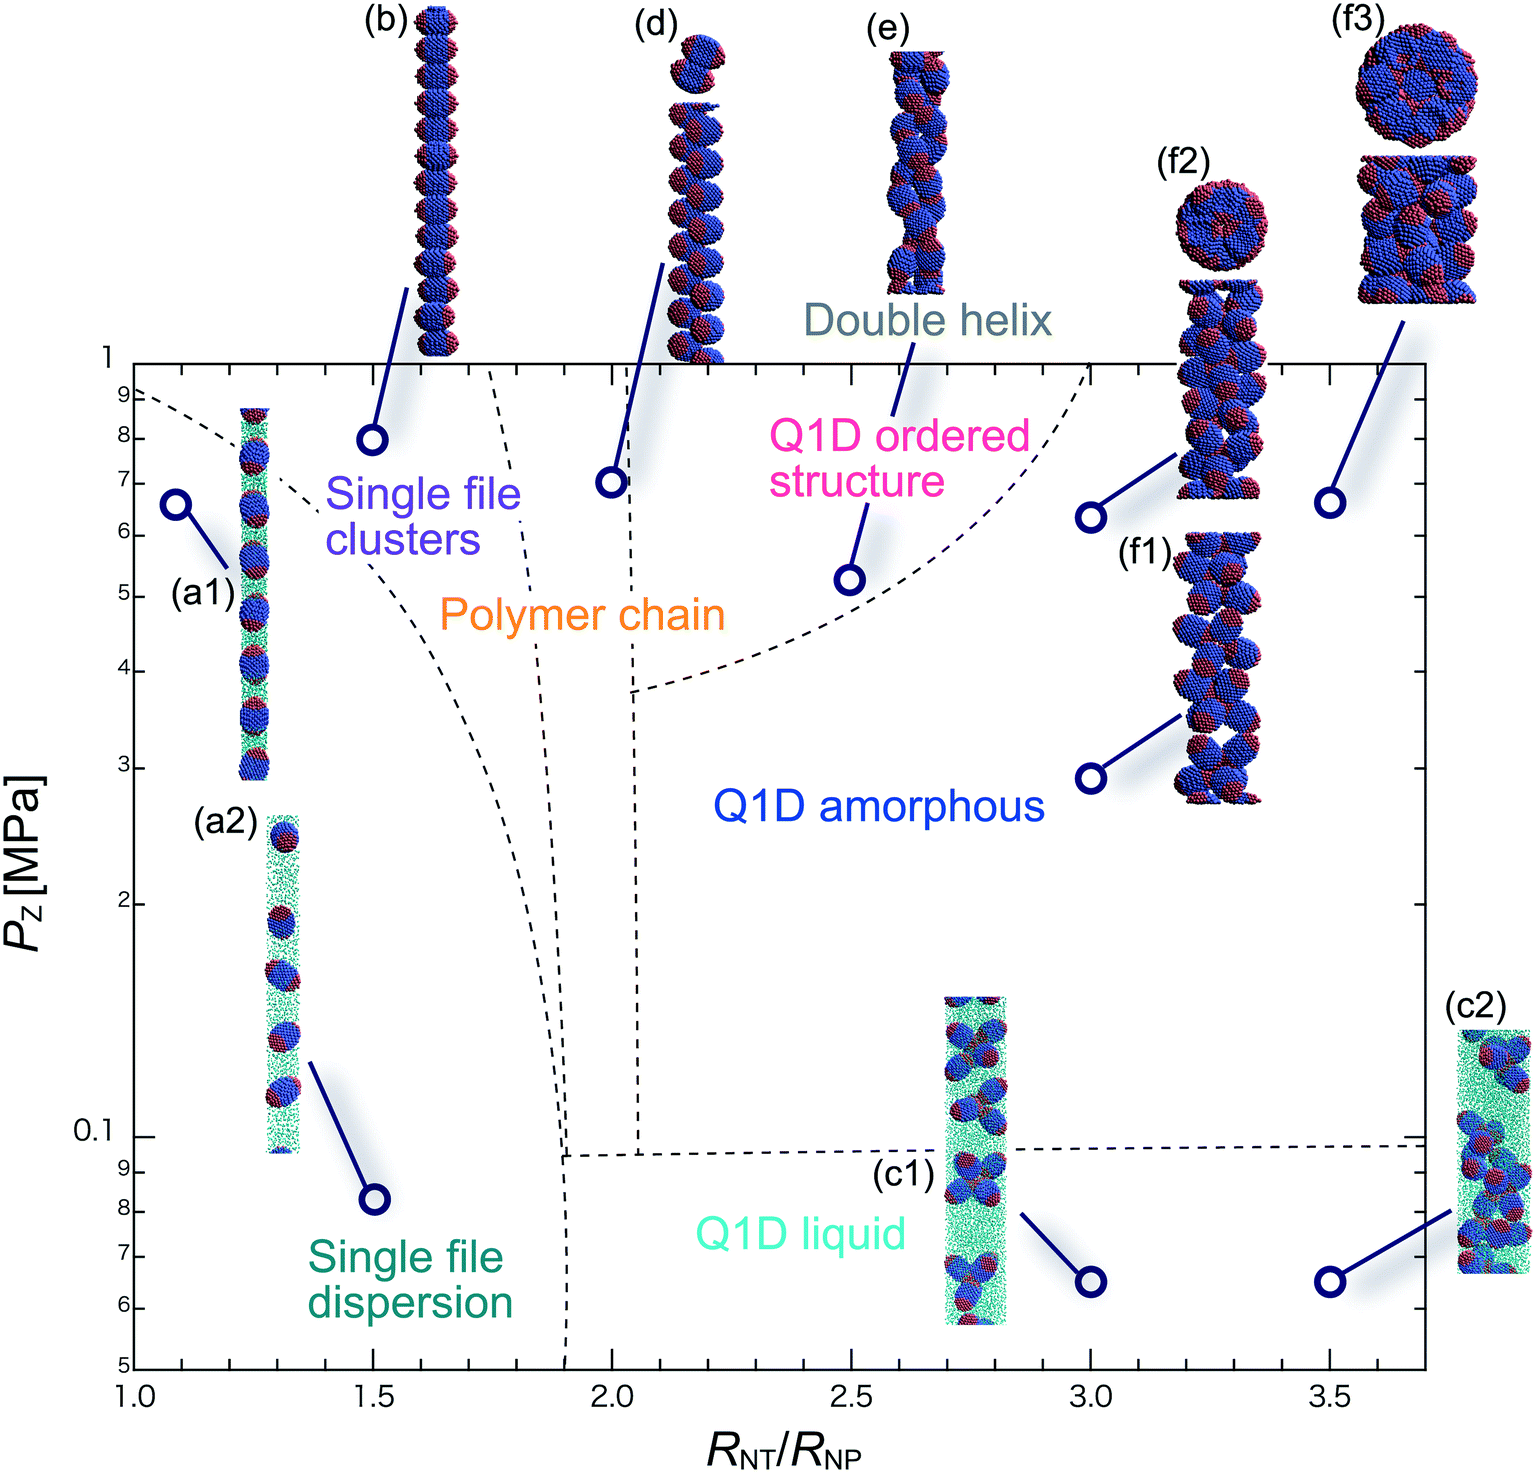 | ||
| Fig. 5 Schematic phase diagram of a triblock JNP solution confined in a hydrophobic nanotube with AR = 1.5. Insets (a–f): Representative snapshots of equilibrium morphologies of the triblock JNP solution. (a1 and a2) Single file dispersion: the side views at RNT/RNP = 1.1 and Pz = 0.65 MPa, and RNT/RNP = 1.5 and Pz = 0.08 MPa, respectively. (b) Single file clusters: the side view at RNT/RNP = 1.5 and Pz = 0.8 MPa. (c1) Q1D liquid: the side view at RNT/RNP = 3.0 and Pz = 0.065 MPa. (c2) Tetrapod and hexapod clusters at RNT/RNP = 3.0 and Pz = 0.065 MPa. (d) Polymer chain: the side view at RNT/RNP = 2.0 and Pz = 0.7 MPa. (e) Q1D ordered structure: double helix: the side views at RNT/RNP = 2.5 and Pz = 0.5 MPa. (f1–f3) Q1D amorphous structure: the side views at RNT/RNP = 3.0 and Pz = 0.25 MPa, RNT/RNP = 3.0 and Pz = 0.65 MPa, and RNT/RNP = 3.5 and Pz = 0.7 MPa, respectively. | ||
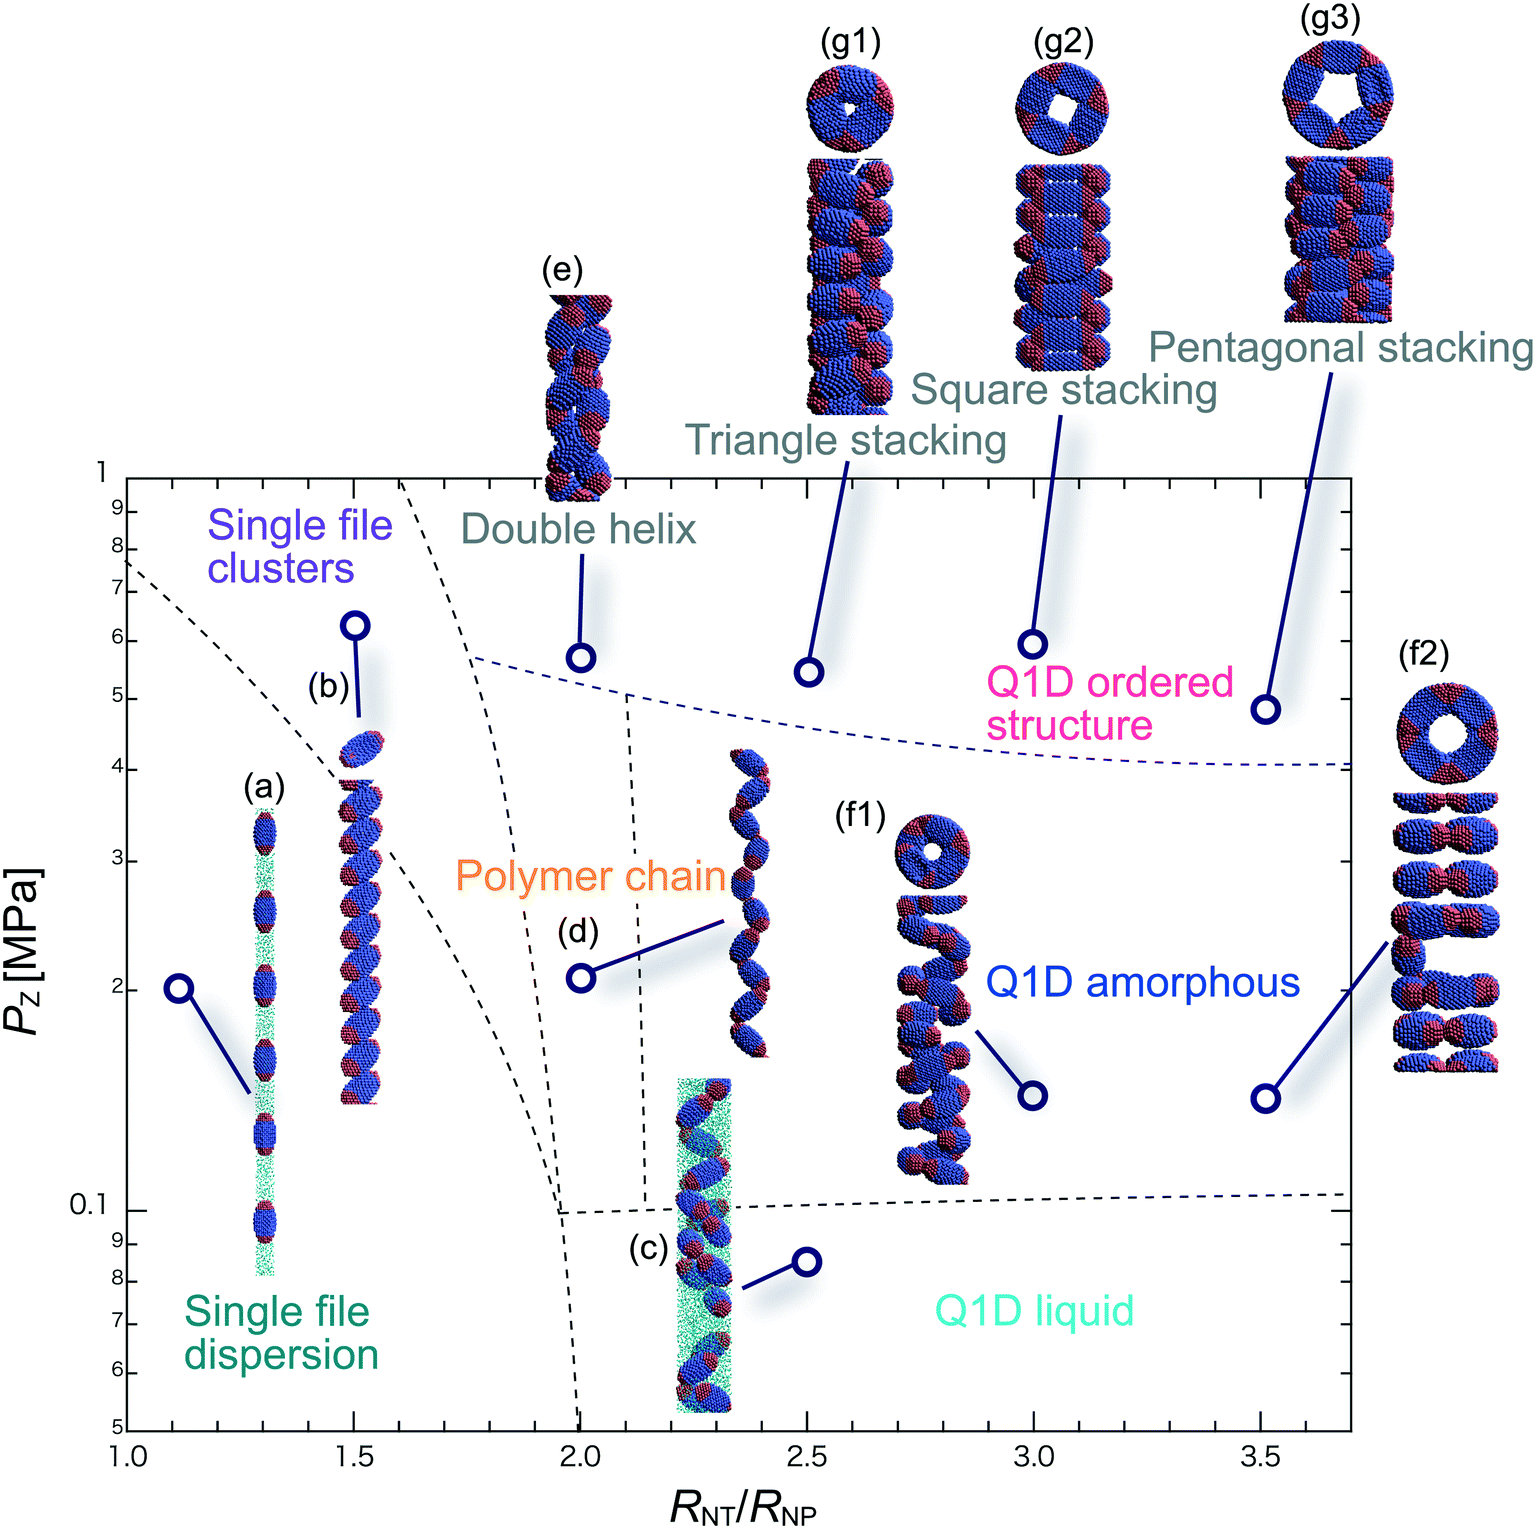 | ||
| Fig. 6 Schematic phase diagram of a triblock JNP solution confined in a hydrophobic nanotube with AR = 2.0. Insets (a–f): Representative snapshots of equilibrium morphologies of the triblock JNP solution. (a) Single file dispersion: the side views at RNT/RNP = 1.1 and Pz = 0.2 MPa. (b) Single file dispersion: RNT/RNP = 1.5 and Pz = 0.65 MPa. (c) Q1D liquid: the side view at RNT/RNP = 2.5 and Pz = 0.085 MPa. (d) Polymer chain: the side view at RNT/RNP = 2.0 and Pz = 0.2 MPa. (e) Q1D ordered structure: double helix: the side views at RNT/RNP = 2.0 and Pz = 0.55 MPa. (f1 and f2) Q1D amorphous structure: the side views at RNT/RNP = 3.0 and Pz = 0.15 MPa, and RNT/RNP = 3.5 and Pz = 0.15 MPa, respectively. (g1–g3) Q1D ordered structure: triangle stacking, square stacking, and pentagonal stacking: the side views at RNT/RNP = 2.5 and Pz = 0.55 MPa, RNT/RNP = 3.0 and Pz = 0.6 MPa, and RNT/RNP = 3.5 and Pz = 0.5 MPa, respectively. | ||
3.1 Hydrophilic wall
For RNT/RNP ≥ 2.0, the Q1D liquid phase emerges (Fig. 3c) in the axial pressure range of Pz ≤ 0.1 MPa. Moreover, at relatively high axial pressures (Pz ≥ 1.0 MPa), diverse morphologies can arise, e.g. polymer chain and double-helix. When 2.0 ≤ RNT/RNP ≤ 2.5 and Pz ≥ 0.1 MPa, a polymer chain is observed (Fig. 3d1 and d2). In this phase, JNPs can come into contact with each other through the hydrophobic side, whereas the hydrophilic side comes into contact with the inner wall. This is because the solvent particles and the hydrophilic sides of the JNPs prefer to be in contact with the inner wall of the nanotube for hydrophilic nanotubes. In addition, when a stronger Pz is applied to the polymer chain, a morphological transition from the polymer chain to a double-helix is observed (Fig. 3e1 and e2). The formation of a helix depends on the balance between the confinement (RNT/RNP) and axial pressure (Pz).
For RNT/RNP ≥ 2.5 and Pz ≥ 0.1 MPa, JNPs aggregate into a solid-like cluster (Q1D amorphous phase) without long-range order (Fig. 3f1 and f2). Even if Pz increases, a Q1D ordered structure does not appear. The parallel and perpendicular orientations of JNPs were coexistent in the axial direction of the nanotube, and thus the self-assembled structures, which have long-range order, were not obtained. Note that a Q1D-ordered structure was obtained in the previous simulation study of spherical triblock JNPs confined in hydrophilic nanotubes. This means that the increase in the aspect ratio inhibits the formation of long-range ordered structures with the same pattern of orientation in a weakly hydrophilic confinement.
When 2.0 ≤ RNT/RNP ≤ 2.8 and Pz ≥ 0.1 MPa, a polymer chain appears, as shown in (Fig. 4d). Here, the distribution of the polymer chain in the schematic phase diagram depends on the intensity of the confinement effect. In other words, compared to AR = 1.5, the major axis is longer, and therefore, the JNPs need more room within the nanotube to form the polymer chain. As a result, an increase in the AR shifts the distribution of the polymer chain in the schematic phase diagram to a higher RNT/RNP value. At higher pressures (Pz ≥ 0.4) and 2.0 ≤ RNT/RNP ≤ 3.0, Q1D-ordered structures were observed (Fig. 4e1 and e2). When RNT/RNP = 2.0, a double-helix (Fig. 4e1) was observed, as observed for AR = 1.5.
When the confinement effect was relatively weak (RNT/RNP ≥ 3.0), several Q1D amorphous structures were formed, depending on the value of RNT/RNP (Fig. 4f1–f3). For the intermediate range of axial pressures (0.10 ≤ Pz ≤ 0.3 MPa), multilayer toroidal structures of JNPs which were not seen at low aspect ratios (AR = 1.5) were observed (Fig. 4f2). The reason for the new characteristic self-assembled structures observed can be explained as follows. The solvent particles prefer to be in contact with the inner wall of the nanotube, and therefore the hydrophilic side of the JNPs comes into contact with the inner wall. Moreover, the hydrophobic sides of the JNPs are connected together through end-to-end contacts because the hydrophobic side does not prefer to be in contact with the solvent particles. Hence, the orientation vector of the JNPs tends to be parallel to the axial direction. As a result, multilayer toroidal structures parallel to the axial direction appear along the inner wall. For relatively high axial pressures (Pz ≥ 0.5), the Q1D amorphous structures remain unchanged (Fig. 4f2 and f3). As Pz increases, the distances between the multilayer toroidal structures decrease. Each of the hydrophobic connection sites in the multilayer toroidal structures branches due to deeply concealed solvent particles. The multilayer toroidal structures that are completely parallel to the axial direction did not form because of the formation of branches.
3.2 Hydrophobic wall
For RNT/RNP ≥ 2.0, the Q1D liquid phase appears at a relatively low axial pressure, Pz = 0.10 MPa. In this phase, a characteristic self-assembly behaviour not formed in hydrophilic nanotubes was observed. We found that cluster structures of JNPs such as tetrapods or hexapods form and disperse in the nanotube, as shown Fig. 5c2. This is because of the hydrophobicity effect on the wall surface. In this case, one hydrophobic cap prefers to be in contact with other hydrophobic sides and the inner wall of the nanotube. As a result, cluster structures of JNPs that are in contact with the inner wall surface are formed only in hydrophobic nanotubes. These hydrophobic caps which are connected to each other resemble the facet edges connected in the cowpea chlorotic mottle virus.26,27 For 1.5 ≤ RNT/RNP ∼ 2.0 and Pz ≥ 0.1 MPa, a polymer chain phase was observed (Fig. 5d). We found a clear difference between the orientations of JNPs confined in hydrophobic and hydrophilic nanotubes (see Fig. 3d1 and d2 and 5d). For hydrophobic nanotubes, the hydrophobic cap of the JNPs was in contact with the inner wall of the nanotubes because the solvent particles did not prefer to be located near the wall surface of the nanotubes. Hence, the JNP orientation, which forms polymer chains, becomes parallel to the axial direction of the nanotube wall (see Fig. 5d).
For 2.0 ≤ RNT/RNP ≤ 3.0 and Pz ≥ 0.40 MPa, a double-helix was observed (Fig. 5e). Similar structures in both hydrophilic and hydrophobic nanotubes have been observed in Q1D-ordered structures. Thus, the formation of a double-helix is independent of the chemical nature of the nanotube wall, and depends only on the balance between the confinement (RNT/RNP) and axial pressure (Pz). For 2.0 ≤ RNT/RNP ≤ 3.0 and 0.1 ≤ Pz ≤ 0.4 MPa, a Q1D amorphous phase was observed. When the effect of confinement is weak (RNT/RNP ≥ 3.0), only the Q1D amorphous phase is seen even if Pz increases (Fig. 5f1–f3). In other words, a Q1D-ordered structure is not formed for any value of the axial pressure. We believe that this is because the results are influenced by cluster structures at low axial pressures. Cluster structures such as tetrapods or hexapods remain in stable and sturdy states even if Pz increases. Therefore, the JNP coordination and orientation depended on the shape of the cluster structure at low axial pressures, and therefore, self-assembled structures with long-range order (Q1D ordered structure) were not obtained.
For RNT/RNP ≥ 2.0, the Q1D liquid phase emerges at relatively low axial pressures, Pz < 0.1 MPa (Fig. 6c). For the Q1D liquid phase, note that significant differences were observed between the different AR values. For a high aspect ratio (AR = 2.0), the cluster structures observed at the low aspect ratio (AR = 1.5) were not formed. The appearance of cluster structure architectures like tripods and tetrapods depends on the balance between the confinement (RNT/RNP) and the length of the major axis of the spheroidal JNPs. Consequently, a clear difference in the Q1D liquid phase between the different AR values was observed due to the lack of space to build cluster structures like tripods and tetrapods. For RNT/RNP ∼ 2.0 and AR = 2.0, similar self-assembly behaviours, i.e., polymer chain (Fig. 6d) and double-helix (Fig. 6e), were observed in the hydrophilic nanotube. For AR = 2.0, we noted that the polymer chain and double helix were observed with no dependence on the chemical nature of the wall surface.
For RNT/RNP ≥ 2.0 and 0.10 ≤ Pz ≤ 0.50 MPa, several Q1D amorphous structures were formed, depending on the value of RNT/RNP (Fig. 6f1 and f2). Interestingly, we found similar self-assembly behaviours for JNPs in both the hydrophobic and hydrophilic nanotubes for AR = 2.0 (Fig. 4f2 and 6f2). As Pz increased (Pz ≥ 0.50 MPa), several characteristic Q1D-ordered structures were observed. Note that more ordered stacking structures were obtained compared to those at AR = 2.0 in hydrophilic nanotubes, as shown in Fig. 6g1–g3. For the Q1D-ordered structure phase, various multilayer toroidal structures such as triangles, squares, and pentagons were obtained, depending on the value of RNT/RNP. When the nanotube wall is hydrophobic, the solvent particles do not prefer to be located near the wall surface. Hence, each hydrophobic connection site of the multilayer toroidal structures, which are oriented towards the direction of the inner hydrophobic surface, does not branch because they do not need to avoid contacting with the solvent particles. As a result, multilayer toroidal structures that are completely parallel to the axial direction appeared only in the hydrophobic nanotube. Here, to investigate the variation in the distribution of the Q1D-ordered structures (the multilayer toroidal structures) in the schematic phase diagram due to changes in the aspect ratio, we performed a simulation with an aspect ratio of 2.5 (AR = 2.5). Consequently, we found that an increase in the value of the AR shifts the distribution of the multilayer toroidal structures in the schematic phase diagram to higher RNT/RNP.
4 Conclusions
In this study, we clarified the self-assembled structures and phases of spheroidal triblock Janus nanoparticle solutions confined in nanotubes, using the dissipative particle dynamics method. In the present work, we focused on the effect of the shape of NPs on the self-assembled morphology in nanotubes, by changing the aspect ratio (AR) of the NPs.We found that various self-assembled morphologies can be observed, depending on the chemical nature of the wall surface and the degree of confinement (the ratio of RNT to RNP). For low and high aspect ratios, schematic phase diagrams for spheroidal triblock Janus nanoparticle solutions confined in nanotubes with hydrophilic and hydrophobic walls were drawn. When RNT/RNP ≤ 2.0 (under strong confinement), the morphologies were almost simple (i.e., single-file dispersion and single-file clusters), and did not depend on the chemical nature of the wall surfaces. When 2.0 ≤ RNT/RNP ≤ 3.0, a variety of morphologies were observed. Polymer chains, which link all JNPs through their hydrophobic caps, were formed irrespective of the chemical nature of the wall surfaces, for any given AR. Under a weak confinement effect (RNT/RNP ≥ 2.5), significant differences emerged among the self-assembly behaviours. For hydrophilic nanotubes, the long-range ordered structures (Q1D ordered structures) did not appear in different ARs because of the formation of branch structures. Conversely, when the nanotube wall was hydrophobic, a Q1D ordered structure was observed only at a high aspect ratio (AR = 2.0) due to the dependence of the shape of the cluster structure at low axial pressures. Thus, it is necessary to build multilayer toroidal structures that are completely parallel to the axial direction to form Q1D ordered structures.
Finally, by increasing the AR of the JNPs, we showed that clusters of unique structures, including tripods, tetrapods, and hexapods, were formed. A value of AR = 1.5 was the ideal condition under which these clusters were formed even in nanospaces such as carbon nanotubes. Moreover, under a weak confinement effect, we found that an increase in the value of the AR leads to a shift in the multilayer toroidal stacking phase in the schematic phase diagram to a higher RNT/RNP value.
Controlling and predicting the morphologies of self-assembled JNPs are still challenging because a number of factors affect the self-assembly behaviour. A theoretical guide for controlling the morphologies of self-assembled JNPs would pave a way for constituting novel systems, which may find applications in nanofluidic devices, photovoltaics, and sensory devices.
Conflicts of interest
There are no conflicts to declare.Acknowledgements
Y. K. was supported by JSPS KAKENHI Grant No. 18J20653. N. A. was supported by JSPS KAKENHI Grant No. 17K14610.References
- P. F. Damasceno, M. Engel and S. C. Glotzer, Predictive self-assembly of polyhedra into complex structures, Science, 2012, 337, 453–457 CrossRef CAS PubMed.
- N. Arai, K. Yasuoka and X. C. Zeng, Nanochannel with uniform and Janus surfaces: Shear thinning and thickening in surfactant solution, Langmuir, 2012, 28, 2866–2872 CrossRef CAS PubMed.
- D. Nykypanchuk, M. M. Maye, D. van der Lelie and O. Gang, DNA-guided crystallization of colloidal nanoparticles, Nature, 2008, 451, 549–552 CrossRef CAS PubMed.
- L. Sun, X. Lin, K. L. Kohlstedt, G. C. Schatz and C. A. Mirkin, Design principles for photonic crystals based on plasmonic nanoparticle superlattices, Proc. Natl. Acad. Sci. U. S. A., 2018, 115, 7242–7247 CrossRef CAS PubMed.
- J. He, Y. J. Liu, T. Babu, Z. J. Wei and Z. H. Nie, Self-assembly of inorganic nanoparticle vesicles and tubules driven by tethered linear block copolymers, J. Am. Chem. Soc., 2012, 134, 11342–11345 CrossRef CAS.
- Q. Y. Lin, J. A. Mason, Z. Y. Li, W. J. Zhou, M. N. O'Brien, K. A. Brown, M. R. Jones, S. Butun, B. Lee, V. P. Dravid, K. Aydin and C. A. Mirkin, Building superlattices from individual nanoparticles via template-confined DNA-mediated assembly, Science, 2018, 359, 669–672 CrossRef CAS PubMed.
- R. V. Jagadeesh, A. E. Surkus, H. Junge, M. M. Pohl, J. Radnik, J. Rabeah, H. Huan, V. Schünemann, A. Brückner and M. Beller, Nanoscale Fe2O3-based catalysts for selective hydrogenation of nitroarenes to anilines, Science, 2013, 342, 1073–1076 CrossRef CAS PubMed.
- Y. G. Sun, X. B. Zuo, S. K. R. S. Sankaranarayanan, S. Peng, B. Narayanan and G. Kamath, Quantitative 3D evolution of colloidal nanoparticle oxidation in solution, Science, 2017, 356, 302–304 Search PubMed.
- S. C. Glotzer and M. J. Solomon, Anisotropy of building blocks and their assembly into complex structures, Nat. Mater., 2007, 6, 557–562 CrossRef PubMed.
- M. N. O'Brien, H. X. Lin, M. Girard, M. O. de la Cruz and C. A. Mirkin, Programming colloidal crystal habit with anisotropic nanoparticle building blocks and DNA bonds, J. Am. Chem. Soc., 2016, 138, 14562–14565 CrossRef PubMed.
- Y. Taniguchi, M. A. Bin Sazali, Y. Kobayashi, N. Arai, T. Kawai and T. Nakashima, Programmed self-assembly of branched nanocrystals with an amphiphilic surface pattern, ACS Nano, 2017, 11, 9312–9320 CrossRef CAS PubMed.
- T. C. Zhao, X. H. Zhu, C. T. Hung, P. Y. Wang, A. Elzatahry, A. A. Al-Khalaf, W. N. Hozzein, F. Zhang, X. M. Li and D. Y. Zhao, Spatial isolation of carbon and silica in a single Janus mesoporous nanoparticle with tunable amphiphilicity, J. Am. Chem. Soc., 2018, 140, 10009–10015 CrossRef CAS PubMed.
- J.-H. Lee, K. J. Gibson, G. Chen and Y. Weizmann, Bipyramid-templated synthesis of monodisperse anisotropic gold nanocrystals, Nat. Commun., 2015, 6, 7571 CrossRef CAS PubMed.
- W. Liu, J. Halverson, Y. Tian, A. V. Tkachenko and O. Gang, Self-organized architectures from assorted DNA-framed nanoparticles, Nat. Chem., 2016, 8, 867–873 CrossRef CAS PubMed.
- Y. Liu, W. Li, T. Perez, J. D. Gunton and G. Brett, Self Assembly of Janus Ellipsoids, Langmuir, 2011, 28, 3–9 CrossRef PubMed.
- G. Munaò, P. O. Toole, T. S. Hudson, D. Costa, C. Caccamo, F. Sciortino and A. Giacometti, Cluster formation and phase separation in heteronuclear Janus dumbbells, J. Phys.: Condens. Matter, 2015, 27, 234101 CrossRef PubMed.
- H. Eslami, K. Bahri and F. M. Plathe, Solid–Liquid and Solid–Solid Phase Diagrams of Self-Assembled Triblock Janus Nanoparticles from Solution, J. Phys. Chem. C, 2018, 122, 9235–9244 CrossRef CAS.
- K. Koga, G. Gao, H. Tanaka and X. C. Zeng, Formation of ordered ice nanotubes inside carbon nanotubes, Nature, 2001, 412, 802–805 CrossRef CAS PubMed.
- K. Mochizuki and K. Koga, Solid–liquid critical behavior of water in nanopores, Proc. Natl. Acad. Sci. U. S. A., 2015, 112, 8221–8226 CrossRef CAS PubMed.
- K. Nomura, T. Kaneko, J. Bai, J. S. Francisco, K. Yasuoka and X. C. Zeng, Evidence of low-density and high-density liquid phases and isochore end point for water confined to carbon nanotube, Proc. Natl. Acad. Sci. U. S. A., 2017, 114, 4066–4071 CrossRef CAS PubMed.
- R. K. Cersonsky, G. van Anders, P. M. Dodd and S. C. Glotzer, Relevance of packing to colloidal self-assembly, Proc. Natl. Acad. Sci. U. S. A., 2018, 115, 1439–1444 CrossRef CAS PubMed.
- M. Majumder, N. Chopra, R. Andrews and B. J. Hinds, Nanoscale hydrodynamics: Enhanced flow in carbon nanotubes, Nature, 2005, 438, 44 CrossRef CAS PubMed.
- Q. Xie, M. A. Alibakhshi, S.-P. Jiao, Z.-P. Xu, M. Hempel, J. Kong, H. G. Park and C.-H. Duan, Nat. Nanotechnol., 2018, 13, 238–246 CrossRef CAS PubMed.
- N. Arai, K. Yasuoka and X. C. Zeng, Self-assembly of triblock Janus nanoparticle in nanotube, J. Chem. Theory Comput., 2013, 9, 179–187 CrossRef CAS PubMed.
- Y. Kobayashi and N. Arai, Self-assembly of Janus nanoparticles with a hydrophobic hemisphere in nanotubes, Soft Matter, 2016, 12, 378–385 RSC.
- M. F. Hagan, Modeling Viral Capsid Assembly, Adv. Chem. Phys., 2014, 155, 1–68 CAS.
- D. C. Rapaport, Role of Reversibility in Viral Capsid Growth: A Paradigm for Self-Assembly, Phys. Rev. Lett., 2008, 101, 186101 CrossRef CAS PubMed.
- S. Cheng, A. Aggarwal and M. J. Stevens, Self-assembly of artificial microtubules, Soft Matter, 2012, 8, 5666–5678 RSC.
- P. Hoogerbrugge and J. Koelman, Simulating microscopic hydrodynamic phenomena with dissipative particle dynamics, Europhys. Lett., 1992, 19, 155–160 CrossRef.
- P. Espanõl and P. Warren, Statistical mechanics of dissipative particle dynamics, Europhys. Lett., 1995, 30, 191–196 CrossRef.
- R. Groot and P. Warren, Dissipative particle dynamics: Bridging the gap between atomistic and mesoscopic simulation, J. Chem. Phys., 1997, 107, 4423–4435 CrossRef CAS.
- M. Hiyama, T. Kinjo and S. Hyodo, Angular momentum form of verlet algorithm for rigid molecules, J. Phys. Soc. Jpn., 2008, 77, 064001 CrossRef.
- R. D. Groot and K. L. Rabone, Mesoscopic simulation of cell membrane damage, morphology change and rupture by nonionic surfactants, Biophys. J., 2001, 81, 725–736 CrossRef CAS PubMed.
- M. W. Maddox and K. E. Gubbins, A Molecular simulation study of freezing/melting phenomena for Lennard-Jones methane in cylindrical nanoscale pores, J. Chem. Phys., 1997, 107, 9659–9667 CrossRef CAS.
- N. Arai, K. Yasuoka and X. C. Zeng, Self–assembly of surfactants and polymorphic transition in nanotubes, J. Am. Chem. Soc., 2008, 130, 7916–7920 CrossRef CAS PubMed.
| This journal is © The Royal Society of Chemistry 2019 |