
ADMET-score – a comprehensive scoring function for evaluation of chemical drug-likeness†
Longfei
Guan
,
Hongbin
Yang
 ,
Yingchun
Cai
,
Lixia
Sun
,
Peiwen
Di
,
Weihua
Li
,
Guixia
Liu
and
Yun
Tang
*
,
Yingchun
Cai
,
Lixia
Sun
,
Peiwen
Di
,
Weihua
Li
,
Guixia
Liu
and
Yun
Tang
*
Shanghai Key Laboratory of New Drug Design, School of Pharmacy, East China University of Science and Technology, 130 Meilong Road, Shanghai 200237, China. E-mail: ytang234@ecust.edu.cn
First published on 30th November 2018
Abstract
Chemical absorption, distribution, metabolism, excretion, and toxicity (ADMET), play key roles in drug discovery and development. A high-quality drug candidate should not only have sufficient efficacy against the therapeutic target, but also show appropriate ADMET properties at a therapeutic dose. A lot of in silico models are hence developed for prediction of chemical ADMET properties. However, it is still not easy to evaluate the drug-likeness of compounds in terms of so many ADMET properties. In this study, we proposed a scoring function named the ADMET-score to evaluate drug-likeness of a compound. The scoring function was defined on the basis of 18 ADMET properties predicted via our web server admetSAR. The weight of each property in the ADMET-score was determined by three parameters: the accuracy rate of the model, the importance of the endpoint in the process of pharmacokinetics, and the usefulness index. The FDA-approved drugs from DrugBank, the small molecules from ChEMBL and the old drugs withdrawn from the market due to safety concerns were used to evaluate the performance of the ADMET-score. The indices of the arithmetic mean and p-value showed that the ADMET-score among the three data sets differed significantly. Furthermore, we learned that there was no obvious linear correlation between the ADMET-score and QED (quantitative estimate of drug-likeness). These results suggested that the ADMET-score would be a comprehensive index to evaluate chemical drug-likeness, and might be helpful for users to select appropriate drug candidates for further development.
1 Introduction
Drug discovery and development is a very complex and costly endeavor, which includes disease selection, target identification and validation, lead discovery and optimization, preclinical and clinical trials.1 With the development of in silico methods in recent years, the number of new molecular entities (NMEs) approved by the U.S. Food and Drug Administration (FDA) has risen obviously.2 However, there are still lots of drug candidates that fail to become drugs. Lack of efficacy and safety are the two major causes leading to drug failure,3 which means the absorption, distribution, metabolism, excretion, and toxicity (ADMET) properties of chemicals play vital roles in every stage of drug discovery and development. Therefore, it is necessary to find efficacious molecules with better ADMET properties.During the early stage of drug discovery, the concept of drug-likeness provides a useful guideline.4,5 Lipinski and co-workers proposed the “Rule of Five” in 1997, which was the original and most well-known rule-based filter of drug-likeness distinguishing whether a molecule is orally absorbed well or not: molecular weight (MW) ≤ 500, octanol/water partition coefficient (A![[thin space (1/6-em)]](https://www.rsc.org/images/entities/char_2009.gif) logP) ≤ 5, number of hydrogen bond donors (HBDs) ≤ 5 and number of hydrogen bond acceptors (HBAs) ≤ 10.6 According to the Rule of Five, a molecule would not be orally active if it violates two or more of the four rules. However, the rules are not suitable for complicated natural products because they were deduced from relatively simple small molecules. Subsequently, several drug-likeness rules/filters similar to the “Rule of Five” were proposed.7–13 For instance, based on 6304 molecules in the CMC (Comprehensive Medicinal Chemistry) database, Ghose and co-workers proposed that more than 80% of the compounds met the following limits: −0.4 ≤ AlogP ≤ 5.6, 160 ≤ MW ≤ 480, 40 ≤ MR (molar refractivity) ≤ 130, and the total number of atoms between 20 and 70.7 The drug-likeness filters based on physicochemical properties speed up the process of drug development.14 However, a number of studies show that the drug-likeness rules/filters based on physicochemical properties have their limitations.7–13
logP) ≤ 5, number of hydrogen bond donors (HBDs) ≤ 5 and number of hydrogen bond acceptors (HBAs) ≤ 10.6 According to the Rule of Five, a molecule would not be orally active if it violates two or more of the four rules. However, the rules are not suitable for complicated natural products because they were deduced from relatively simple small molecules. Subsequently, several drug-likeness rules/filters similar to the “Rule of Five” were proposed.7–13 For instance, based on 6304 molecules in the CMC (Comprehensive Medicinal Chemistry) database, Ghose and co-workers proposed that more than 80% of the compounds met the following limits: −0.4 ≤ AlogP ≤ 5.6, 160 ≤ MW ≤ 480, 40 ≤ MR (molar refractivity) ≤ 130, and the total number of atoms between 20 and 70.7 The drug-likeness filters based on physicochemical properties speed up the process of drug development.14 However, a number of studies show that the drug-likeness rules/filters based on physicochemical properties have their limitations.7–13
To investigate the drug-likeness, a number of prediction models have been constructed by machine learning methods, such as support vector machine (SVM),15–18 artificial neural networks (ANN),19 recursive partitioning (RP),20–23 and naïve Bayesian (NB).23 For example, Tian and co-workers developed prediction models for drug-likeness on the MDDR (MDL Drug Data Report) and ACD (Available Chemicals Directory) data sets, which were separately used as drug-like and non-drug-like databases, with similar MW distributions by NB and RP techniques.23 Nevertheless, to assess whether a molecule is objectively drug-like or otherwise non-drug-like, a binary classification is somewhat misleading.
Unlike drug-likeness rules/filters, the concept of QED (quantitative estimate of drug-likeness) was proposed in 2012 by Hopkins and co-workers,24 which was generated by fitting the distribution of eight physicochemical properties, including MW, AlogP, HBAs, HBDs, molecular polar surface area (PSA), number of rotatable bonds (ROTBs), number of aromatic rings (AROMs), and number of alerts for undesirable substructures (ALERTs), based on 771 marketed oral drugs.24 The QED concept is more flexible than conventional drug-likeness rules, because of replacement of the stiff cutoffs with a continuous index. Similarly, Segall et al. proposed a new concept of relative drug likelihood (RDL) based on simple physicochemical properties using Bayesian probability theory.25 However, the two concepts were only dependent on the physicochemical properties of compounds without considering their in vivo or in vitro ADMET properties.
In our previous studies, we constructed a series of in silico models to predict chemical ADMET properties.26–29 These models were mainly constructed by machine learning methods, such as SVM, RF and kNN, together with molecular fingerprints to represent molecular structures including MACCS, FP4 and PubChem. The training sets for building these models came from research papers, related databases such as ChEMBL, DrugBank and high-throughput screening projects such as CYP450.30–32 Based on these models, we further developed a free comprehensive web server, namely admetSAR,33 which has been widely used for chemical ADMET prediction so far. The web server was recently updated to version 2.0 and made freely available at http://lmmd.ecust.edu.cn/admetsar2/.34 Even so, admetSAR cannot evaluate these compounds with one metric. For this endeavor, we defined a scoring function, namely the ADMET-score in this work. 18 endpoints representing ADMET properties were integrated into the scoring function (shown in Table 1), which gives an overall understanding of molecules and scores for them.26–29,35–41
| No | End points | Numbers | Accuracy |
|---|---|---|---|
| Positive/negative | |||
| 1 | Ames mutagenicity | 4866/3482 | 0.843 |
| 2 | Acute oral toxicity | — | 0.832 |
| 3 | Caco-2 permeability | 303/371 | 0.768 |
| 4 | Carcinogenicity | 476/440 | 0.816 |
| 5 | CYP1A2 inhibitor | 7415/7488 | 0.8147 |
| 6 | CYP2C19 inhibitor | 6041/8535 | 0.8054 |
| 7 | CYP2C9 inhibitor | 4978/9731 | 0.802 |
| 8 | CYP2C9 substrate | 142/531 | 0.779 |
| 9 | CYP2D6 inhibitor | 3060/11681 |
0.855 |
| 10 | CYP2D6 substrate | 191/480 | 0.775 |
| 11 | CYP3A4 inhibitor | 6707/11854 |
0.645 |
| 12 | CYP3A4 substrate | 357/317 | 0.66 |
| 13 | CYP inhibitory promiscuity | — | 0.821 |
| 14 | hERG inhibitor | 717/261 | 0.804 |
| 15 | Human intestinal absorption | 500/78 | 0.965 |
| 16 | Organic cation transporter protein 2 inhibitor | 244/633 | 0.808 |
| 17 | P-gp inhibitor | 1172/771 | 0.861 |
| 18 | P-gp substrate | 718/847 | 0.802 |
2 Methods
2.1 Data collection and preparation
Three data sets were used in this study. At first, a non-redundant data set comprising 1124 approved drugs was collected from the DrugBank (http://www.drugbank.ca/). In the database, drugs are categorized by group, which determines their drug development status in at least one jurisdiction. Since a drug may be approved in one jurisdiction, and withdrawn in another, it is possible for a drug to be in both groups. In this study, we removed the drugs in both withdrawn and approved groups, such as trovafloxacin and astemizole. Only orally administered and approved drugs were used. Secondly, compounds from the database ChEMBL (https://www.ebi.ac.uk/chembldb/) containing more than 500 thousand molecules were clustered into 2000 groups using ECFP_6 in Discovery Studio 3.5,42 and each center molecule was picked up to form a data set for the validation of the ADMET-score. Thirdly, those drugs withdrawn from the market due to safety concerns were extracted from the WITHDRAWN3 (http://cheminfo.charite.de/withdrawn/) database that consists of 578 withdrawn or discontinued drugs.These three data sets were prepared through the following steps: (1) inorganic compounds and mixtures were removed; (2) salts and organometallic compounds were converted into the corresponding acids or bases; (3) tautomers were considered as the same compound and only one molecule was kept; (4) all compounds were converted into canonical SMILES.
2.2 Calculation of ADMET related properties
With our web server admetSAR 2.0 (http://lmmd.ecust.edu.cn/admetsar2/), 18 important ADMET properties (listed in Table 1) were calculated, including Ames mutagenicity (Ames), acute oral toxicity (AO), Caco-2 permeability (Caco-2), P-glycoprotein substrate (P-gps), P-glycoprotein inhibitor (P-gpi), CYP substrates and inhibitors (CYP1A2, CYP2C9, CYP2D6, CYP2C19 and CYP3A4), human intestinal absorption (HIA), CYP inhibitory promiscuity (CYPPRO), carcinogenicity (CARC), human ether-a-go-go-related gene inhibition (hERG), and the organic cation transporter protein 2 inhibitor (OCT2i). Except chemical carcinogenicity and acute oral toxicity, the others were binary classification models. We transferred the prediction models of carcinogenicity and acute oral toxicity from ternary or quaternary into binary according to the following rules. For acute oral toxicity models, category 1 (LD50 ≤ 50 mg kg−1) and category 2 (50 mg kg−1 < LD50 ≤ 500 mg kg−1) were considered as toxic while category 3 (500 mg kg−1 < LD50 ≤ 5000 mg kg−1) and category 4 (5000 mg kg−1 < LD50) were considered to be nontoxic.29 In the meantime, compounds with the prediction of non-carcinogenic (inactive) or weakly carcinogenic (TD50 > 10 mg kg−1 per day) were considered as non-carcinogenic and the others were considered as carcinogenic.282.3 Definition of the ADMET-score
The above-mentioned 18 ADMET-related properties were used to define the scoring function named the ADMET-score. As shown in eqn (1), q is the transformed result, wi is the weight applied to each endpoint and n is the number of endpoints. The predicted value of each property was employed in the score with a weight. Instead of using “positive and negative” to represent the property, we used “beneficial/positive” (q = 1) and “harmful/negative” (q = 0) here. Therefore, we transformed the predictive values of all harmful properties into q = 0. For instance, the prediction of hERG− would be transferred to beneficial (q = 1) and the prediction of hERG+ would be transferred to harmful (q = 0). These harmful endpoints included Ames, AO, CARC, CYP inhibitors (CYP1A2, CYP2C9, CYP2D6, CYP2C19 and CYP3A4), CYPPRO, hERG blocker, OCT2 inhibitor, and P-gp inhibitor. Finally, the ADMET-score value was adjusted between 0 and 1 according to the scores of the oral drugs in DrugBank, in which “1” indicates the best and “0” means the worst. When the ADMET-score of a compound is less than zero, we make the ADMET-score zero. When the ADMET-score of a drug is greater than 1, we make the ADMET-score 1.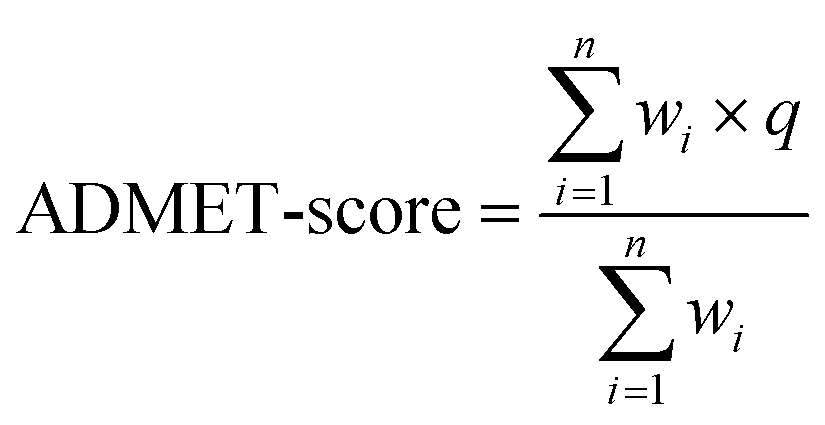 | (1) |
| wi = w1 × w2 × w3 | (2) |
| w1 = [0.5 × (1 − ((−p) × log2p − (1 − p) × log2(1 − p)))] + 0.5 | (3) |
 | (4) |
The weight of each model is determined by three components (eqn (2)). w1 is the usefulness index, which describes whether the model is critically required for drug-likeness based on the predicted values of the drugs in DrugBank. w1 = 1 means that a specific endpoint is useful for prediction. w2 is the performance of the QSAR model, and w3 describes the relative importance of the endpoint in overall ADMET properties. In this study, we use the information entropy35 to calculate the usefulness index w1 of the model, shown in eqn (3), in which p represents the beneficial ratio, indicating that the frequency of a specific property occurs in drugs of DrugBank. When p = 0, no drugs in DrugBank contain that property. When p = 1, all drugs in DrugBank contain that property. Both cases (p = 0 and p = 1) are useful to predict drug-likeness.
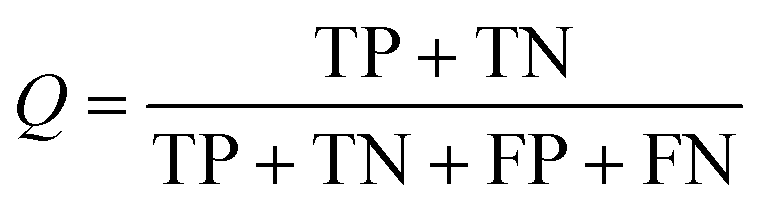
As shown in eqn (4), TP is the number of true positives, and TN is the number of true negatives. Similarly, FP is the number of false positives, and FN is the number of false negatives. In this study, all models were evaluated by the TP of each class and the predictive accuracy (Q). The accuracy of every selected model in the ADMET-score must be taken into consideration. Therefore, w2 representing the accuracy of the model from admetSAR was integrated into the calculation of the final weight. However, the pharmacokinetic process of drugs is complex. In addition to the mentioned two weights, we used another parameter, w3, to represent the importance of their contribution to the ADMET properties, so each endpoint was weighted in terms of its relative significance. We rationalized the parameters of each endpoint according to the reference studies and the weights are shown in Table 2.
| No | End points | w 1 | w 2 | w 3 | w i |
|---|---|---|---|---|---|
| w 1: the usefulness index; w2: the performance of the QSAR model; w3: the relative importance of the endpoint in ADMET properties; wi: the final weight of each endpoint in the function. | |||||
| 1 | Ames mutagenicity | 0.7142 | 0.8430 | 1.0 | 0.6021 |
| 2 | Acute oral toxicity | 0.7052 | 0.8320 | 1.0 | 0.5867 |
| 3 | Caco-2 permeability | 0.5004 | 0.7680 | 0.8 | 0.3074 |
| 4 | Carcinogenicity | 0.8404 | 0.8160 | 1.0 | 0.6857 |
| 5 | CYP1A2 inhibitor | 0.5839 | 0.8147 | 0.5 | 0.2379 |
| 6 | CYP2C19 inhibitor | 0.6668 | 0.8054 | 0.5 | 0.2685 |
| 7 | CYP2C9 inhibitor | 0.7396 | 0.8020 | 0.5 | 0.2966 |
| 8 | CYP2C9 substrate | 0.6759 | 0.7790 | 0.5 | 0.2633 |
| 9 | CYP2D6 inhibitor | 0.6617 | 0.8550 | 0.5 | 0.2829 |
| 10 | CYP2D6 substrate | 0.5926 | 0.7750 | 0.5 | 0.2296 |
| 11 | CYP3A4 inhibitor | 0.6630 | 0.6450 | 0.8 | 0.3421 |
| 12 | CYP3A4 substrate | 0.5097 | 0.6600 | 0.8 | 0.2691 |
| 13 | CYP inhibitory promiscuity | 0.5856 | 0.8210 | 1.0 | 0.4808 |
| 14 | hERG inhibitor | 0.5049 | 0.8040 | 1.0 | 0.4059 |
| 15 | Human intestinal absorption | 0.7821 | 0.9650 | 1.0 | 0.7548 |
| 16 | Organic cation transporter protein 2 inhibitor | 0.6345 | 0.8080 | 0.5 | 0.2564 |
| 17 | P-gp inhibitor | 0.5422 | 0.8610 | 0.8 | 0.3735 |
| 18 | P-gp substrate | 0.5399 | 0.8020 | 0.8 | 0.3464 |
2.4 Validation of the ADMET-score
To compare the distribution of the ADMET-score for the compounds in different data sets, the ADMET-scores were calculated for the three data sets. The arithmetic mean and Mann–Whitney U test were then used to compare the different distribution of ADMET-scores in the three data sets. The arithmetic mean is the sum of a collection of data divided by the number of data in the collection. The Mann–Whitney U test43 is used to check whether the mean of two populations has a significant difference. It could also be used to determine whether two independent samples are selected from populations having the same distribution. In this study, we calculated the p-values in the Mann–Whitney U test to distinguish the significant levels of any two data sets.In order to find the relationship between physicochemical and ADMET properties, the QED value was generated by fitting the MW, AlogP, HBAs, HBDs, PSA, ROTBs, AROMs, and ALERTs. We analyzed the linear correlation between the QED and ADMET-score through linear regression. For the index of QED values, we also calculated the arithmetic mean of the three data sets and the p-value between any two data sets.
3 Results
3.1 Data collection and analysis
In this paper, we obtained 880 drugs from DrugBank, 2000 small molecules from ChEMBL, 267 withdrawn drugs from WITHDRAWN. The chemical space and Tanimoto similarity were used to investigate the chemical diversity. The chemical space was defined by MW and AlogP. As shown in Fig. 1A, the MW of the drugs from DrugBank distributed from 75 to 1736 (mainly from 100 to 500), and the AlogP ranged from −9 to 11 (mainly from −2 to 6). Although the MW of bioactive compounds in the ChEMBL set distributed from 400 to 800, their AlogP shared a similar range of values. From Fig. 1A, it is easy to see that the WITHDRAWN and ChEMBL sets shared similar chemical space with the DrugBank set. To further evaluate the diversity of data sets, the Tanimoto coefficient for the whole data set was calculated using the MACCS fingerprint. The heat maps of the Tanimoto similarity matrix of the above three data sets are shown in Fig. 1B. The average similarity between two compounds was 0.39.
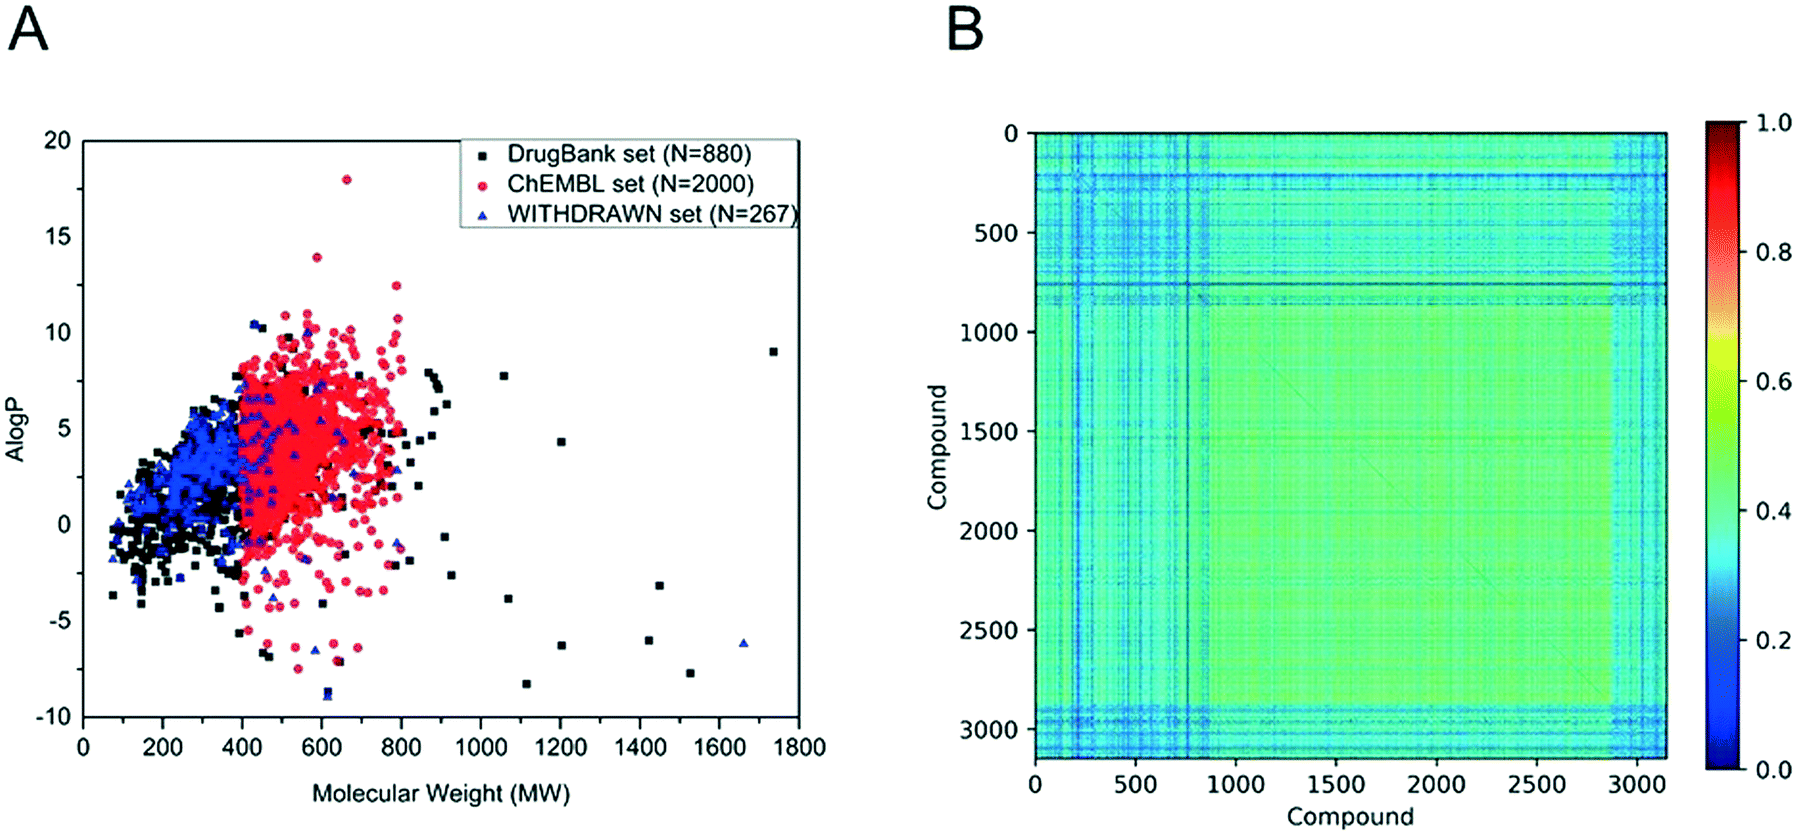 | ||
| Fig. 1 (A) Chemical space distribution of DrugBank, ChEMBL and WITHDRAWN. N represents the number of molecules in different data sets. Chemical space is defined by molecular weight (MW) as the X-axis, and Ghose–Crippen LogKow (AlogP) as the Y-axis. (B) Tanimoto similarity index for all chemicals used in this study; the color closer to red in the heat map means that the compounds are more similar and the color closer to dark blue means that the compounds have higher diversity. | ||
3.2 Distribution and weights of ADMET properties
In this study, 18 ADMET properties of each compound were predicted using the models in admetSAR 2.0. Fig. 2 shows the distribution of the beneficial ratio of each endpoint in these three data sets. The results illustrated that the distribution was similar between DrugBank and WITHDRAWN, while the bioactive compounds in ChEMBL were different for some endpoints. From the perspective of these toxicity endpoints, it was expected that the beneficial ratios of Ames, AO and CARC in WITHDRAWN were lower than those in DrugBank. However, considering the predictive results of hERG, the beneficial ratio in ChEMBL was the lowest, and that in WITHDRAWN was higher than in DrugBank. Although in silico models are not as accurate as in vitro or in vivo assays, the statistical results are still convincing and consistent with the truth that approved drugs have less toxicity compared to bioactive compounds. The results also indicated that the current bioactive medicinal chemistry research focuses much on the bioactivity of small molecules without enough concern for their potential risk of toxicity.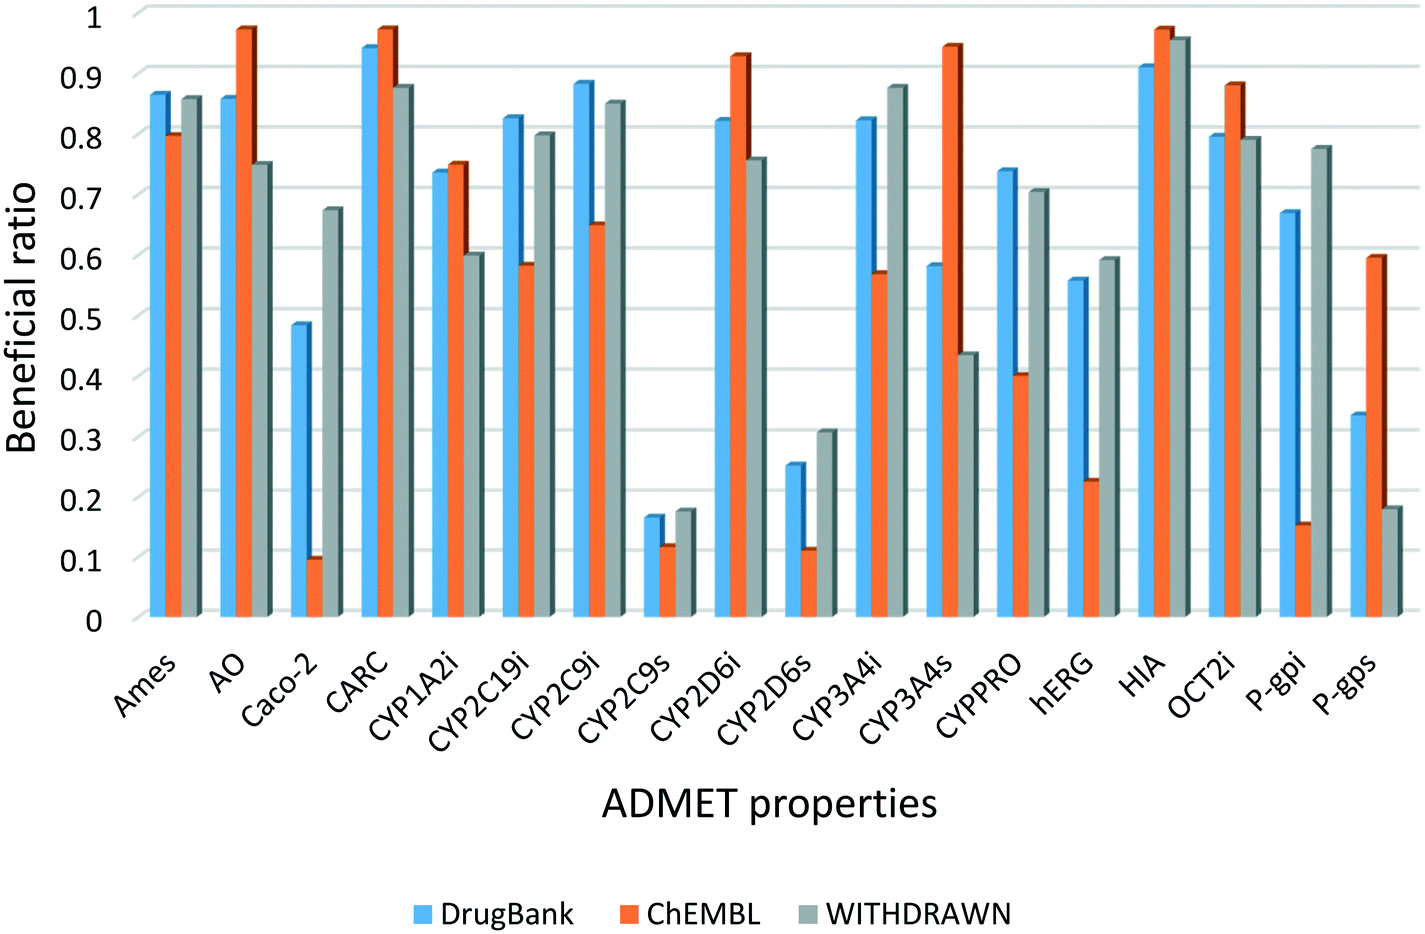 | ||
| Fig. 2 Beneficial ratio of different models in the three data sets. Blue, orange and gray represent the three data sets, respectively. | ||
The beneficial ratio of CYPPRO in ChEMBL was lower than that in DrugBank and WITHDRAWN, which represents that the molecules in ChEMBL would have potential effects on the occurrence of clinical drug–drug interactions (DDI). Based on our observations, the trend of the beneficial ratio of CYP isoforms in the three data sets was diverse. We inferred that the single CYP isoform is not very important in the whole ADMET properties. The final weights of each endpoint are listed in Table 2. The weights of toxicity endpoints were higher than the others, because these endpoints play important roles in drug discovery. As to the weights of CYP3A4 and Caco-2, because their beneficial ratios approached 0.5, their w1 values would be relatively lower. The results showed that the weight of each endpoint was reasonable.
3.3 Distribution of the ADMET-score and QED in the three data sets
We calculated the ADMET-score value of each compound based on the definition of the ADMET-score presented above. The canonical SMILES of compounds, prediction results of ADMET properties and ADMET-score values for the three data sets are listed in the ESI.† In order to evaluate the performance of the scoring function, a validation study was conducted to determine the relative performance of the ADMET-score. At first, we inspected the distribution of the ADMET-score using the scores derived by oral drugs from DrugBank. Fig. 3 shows the differences of the ADMET-score distribution for compounds from ChEMBL, withdrawn drugs from WITHDRAWN and oral drugs from DrugBank. The results illustrated that the ADMET-score of DrugBank outperformed those of ChEMBL and WITHDRAWN. As listed in Table 3, the mean ADMET-score is 0.5037 for DrugBank, 0.4652 for WITHDRAWN and 0.3281 for ChEMBL. Similarly, we calculated the mean QED in different data sets. The mean values of the QED for different data sets were as follows: WITHDRAWN > DrugBank > ChEMBL. From Table 3, we could see that the mean QED was 0.5747 for DrugBank, which was lower than that for WITHDRAWN (0.6267). The same as the ADMET-score, the mean QED for ChEMBL was the lowest.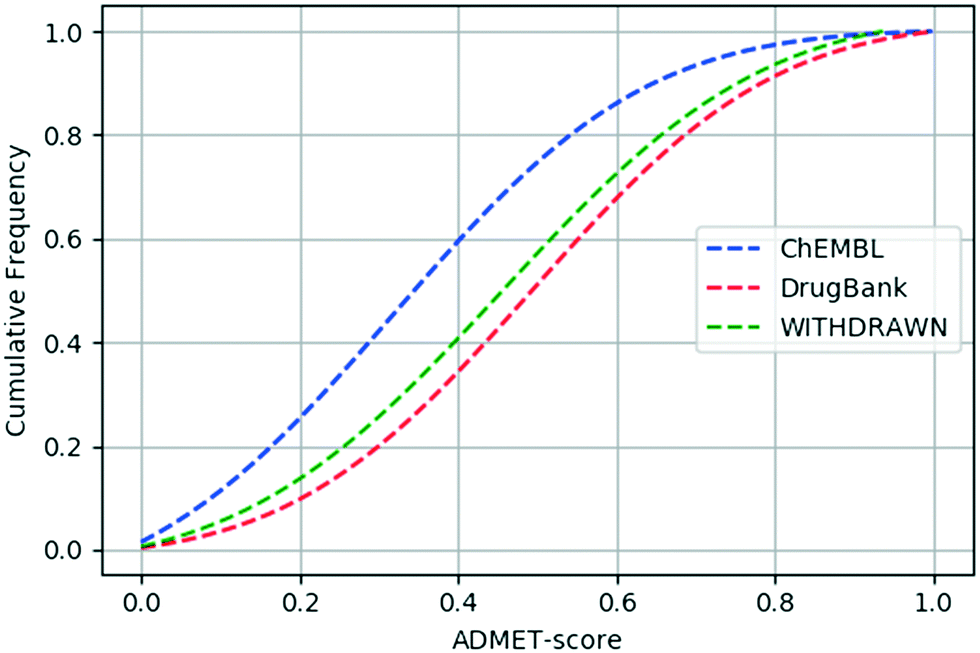 | ||
| Fig. 3 Cumulative ADMET-score distribution for the three data sets: the ChEMBL data set (blue), the DrugBank data set (red), and the WITHDRAWN data set (green). | ||
| Data set | Mean | |
|---|---|---|
| ADMET-score | QED | |
| DrugBank | 0.5037 | 0.5747 |
| ChEMBL | 0.3281 | 0.4042 |
| WITHDRAWN | 0.4652 | 0.6267 |
We calculated the p-value between any two data sets using the Mann–Whitney U test. The p-values of the ADMET-score and QED between each pair of the three data sets are listed in Table 4. The ADMET-scores of ChEMBL and DrugBank differ significantly (p-value = 2.23 × 10−63). As for DrugBank and WITHDRAWN, though the cumulative curve of the ADMET-score was close, there is a significant difference between their ADMET-score (p-value = 0.018). And the p-value linked with the difference of the ADMET-score between the WITHDRAWN data set and ChEMBL data set was 7.84 × 10⁻¹⁶. Therefore, we concluded that the difference in ADMET-scores between oral drugs and small molecules or withdrawn drugs was statistically significant. For the index of the QED, the p-value was 3.85 × 10−88 between DrugBank and ChEMBL, 0.0005 between DrugBank and WITHDRAWN, and 1.53 × 10−58 between ChEMBL and WITHDRAWN.
| Data set | p-Value | |
|---|---|---|
| ADMET-score | QED | |
| DrugBank & ChEMBL | 2.23 × 10−63 | 3.85 × 10−88 |
| DrugBank & WITHDRAWN | 0.018 | 0.0005 |
| ChEMBL & WITHDRAWN | 7.84 × 10⁻¹⁶ | 1.53 × 10−58 |
3.4 Relationship between the QED and ADMET-score
To explore the difference between physicochemical and ADMET properties, the linear correlation (R) of the QED and ADMET-score was analyzed. As shown in Fig. 4, the R value was only 0.12, which indicated that there was little correlation between the ADMET-score and QED, and the QED did not show any capability to distinguish compounds with high ADMET-scores from those with low ADMET-scores. The mean values of the QED for different data sets as listed in Table 3 demonstrated that the QED was inadequate to represent the ADMET properties of a compound. According to the distribution of the QED shown in Fig. 5, the QED values of molecules from WITHDRAWN were better than oral drugs from DrugBank, which showed that physicochemical properties were not enough to evaluate the drug-likeness of a chemical. Fig. 5D illustrated the cumulative QED distribution of the three data sets. The results showed that there was an obvious difference between the data set of drug and small-molecule bioactivities. Although there is little correlation between the QED and ADMET-score in terms of the correlation coefficient, the distribution in three data sets was very close.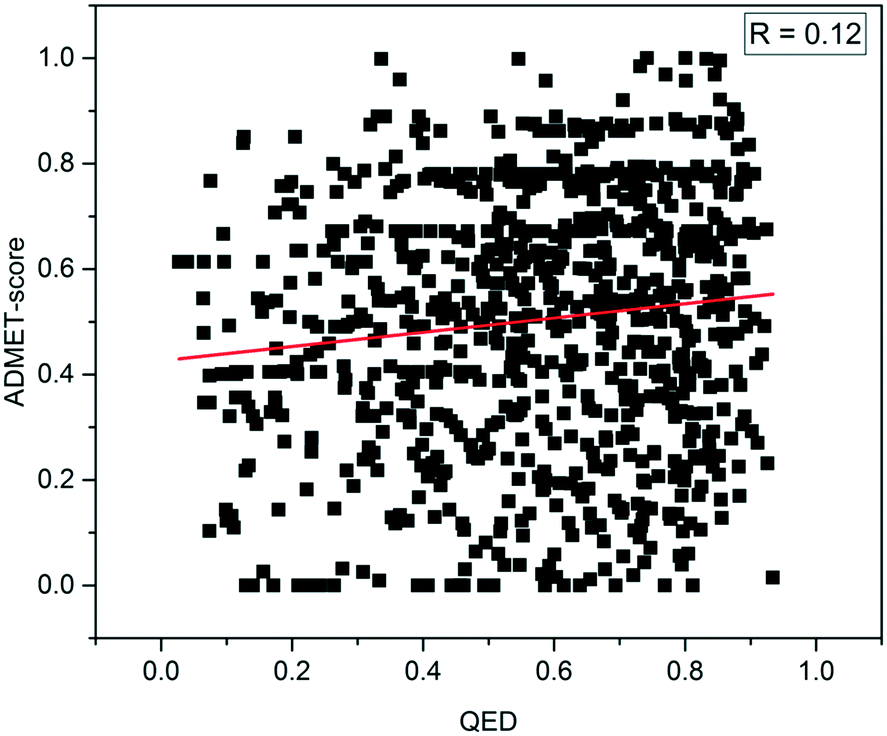 | ||
| Fig. 4 Correlation of drug-likeness between the ADMET-score and QED. | ||
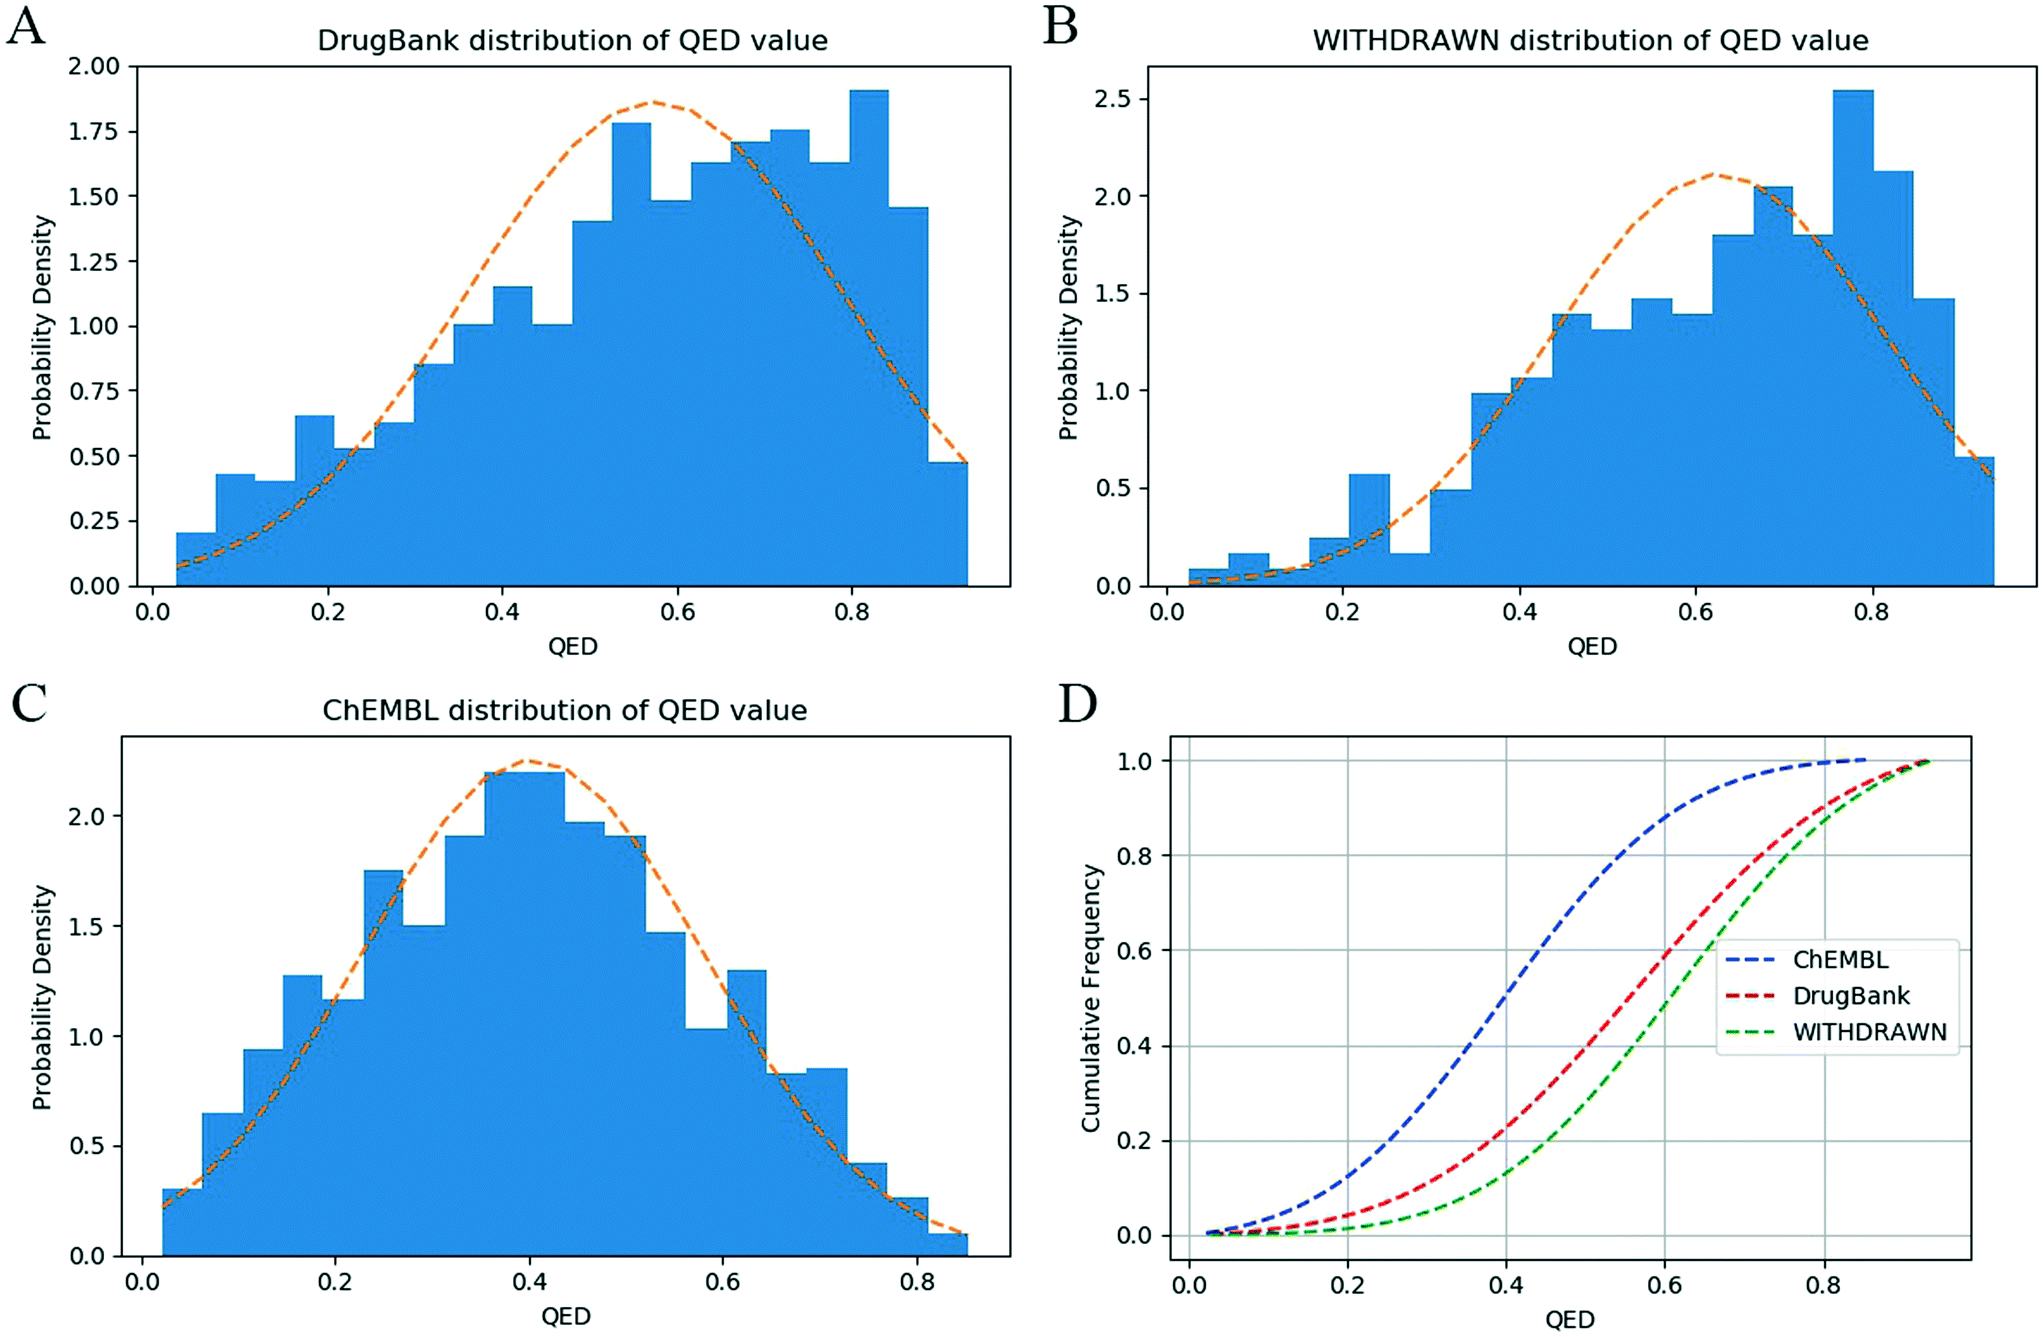 | ||
| Fig. 5 The distribution of QED values in the three data sets: (A) the probability density of the QED in the DrugBank data set, (B) the probability density of the QED in the WITHDRAWN data set, (C) the probability density of the QED in the ChEMBL data set, and (D) cumulative QED distribution of the three data sets. | ||
4 Discussion
4.1 Selection of ADMET properties
The predictive models within admetSAR were developed not only for drug discovery, but also for others such as environmental risk assessment. Therefore, we excluded some ADMET properties in the definition of the ADMET-score. The endpoints related to environment toxicity, such as honey bee toxicity and fish aquatic toxicity were not considered. Although these eco-toxicity models are important, it is inappropriate to use them as evaluation criteria of drug-likeness. In addition, the blood–brain barrier model was not included in this study since whether it is beneficial depends on the disease and therapy. For example, we hope that drugs for the nervous system diseases can pass through the blood–brain barrier that the others cannot.For ADMET properties, one of the most important challenges facing an oral drug is its movement across the intestinal epithelial barrier that determines the rate and extent of human absorption and ultimately affects its bioavailability. Therefore, HIA and Caco-2 were selected to evaluate the absorption properties. The CYP enzymes, particularly isoforms 1A2, 2C9, 2C19, 2D6 and 3A4, were responsible for about 90% of oxidative metabolic reactions.44 According to our previous work, the more CYP isoforms a given small molecule inhibits, the more likely it will be involved in DDI with many other drugs.27 Our group investigated the CYP promiscuity which meant that a molecule might inhibit multiple CYP isoforms.27 P-Glycoprotein (P-gp or ABCB1) was an ABC transporter protein involved in many essential processes such as intestinal absorption, drug metabolism, distribution, and excretion.45 Here, the models of P-gp inhibition or substrate were used as an important index to evaluate the drugs from different points of view. The OCT2 was the first step in the renal secretion of many cationic drugs,38 and its inhibitors may result in changes in the accumulation of drugs in the kidney, inducing nephrotoxicity. Therefore, OCT2 was used to represent the excretion in the definition of the ADMET-score.
The toxicity properties covered a range of important endpoints including Ames, AO, CARC, and hERG. The inhibition of the hERG potassium channel may result in QT interval prolongation and causes severe cardiac side effects, which is a major problem in clinical studies of drug candidates.39 Therefore, it is important to add the hERG model in this scoring function. Ames mutagenicity was used for the evaluation of the potential teratogenicity and genotoxicity in the early stages of drug discovery. Furthermore, acute oral toxicity and carcinogenicity were the toxicological endpoints posing the highest concern for human health. In particular, carcinogenicity results in many drugs withdrawn from the market, such as canrenone and hexestrol.3 Obviously, we have selected most representative endpoints to construct the ADMET-score function.
4.2 Analysis of ADMET and physicochemical properties
The concept of drug-likeness provides useful guidelines for the early stage in drug discovery.4,5 It was believed that drugs or drug candidates tend to have similar physicochemical properties. Therefore, based on the analysis of some key physicochemical properties of approved drugs or drug candidates, such as MW, hydrophobicity and polarity, simple rules that define acceptable boundaries for those properties have been developed.24,46 In recent years, several specialized drug-likeness rules/filters, such as the Rule of Five,6,47 Rule by Ghose et al.,7 QED and RDL25 were developed for drug discovery. However, most of the rules or filters were very simple and many drugs do not follow these. Several studies have confirmed that the drug-likeness filters based on physicochemical properties are not immobile and universal and they should be used cautiously. For example, Hou and co-workers investigated some property-based rules in the prediction of intestinal absorption and oral bioavailability, and they found that no simple rules based on molecular properties could predict oral bioavailability with high confidence.48Based on the physicochemical properties, as shown in Fig. 5, the QED values are different between oral drugs and random small molecules. Correlation analysis indicates that there is no obvious correlation between the QED and ADMET-score, which demonstrates that the QED and ADMET-score described the drug-likeness in different ways. The common way to evaluate the performance of classification models is to draw a receiver operating characteristic (ROC) curve and calculate the area under ROC curve (AUC). Fig. 6 shows the performance of the scoring function ADMET-score and QED methods, on the basis of oral drugs from DrugBank and small molecules from ChEMBL. The results showed that the performance of the ADMET-score is similar to the QED metrics, indicating that the ADMET-score derived from the ADMET properties could evaluate the drug-likeness. We believe that the physicochemical properties could not completely replace the ADMET properties, and we should consider both. Besides the physicochemical properties, the ADMET-score also contains many endpoints related to metabolism and toxicity, which are not available in the QED. Therefore, it is hard to balance the contradiction between the ADMET-score and QED. However, the ADMET-score plus QED might comprehensively evaluate the performance.
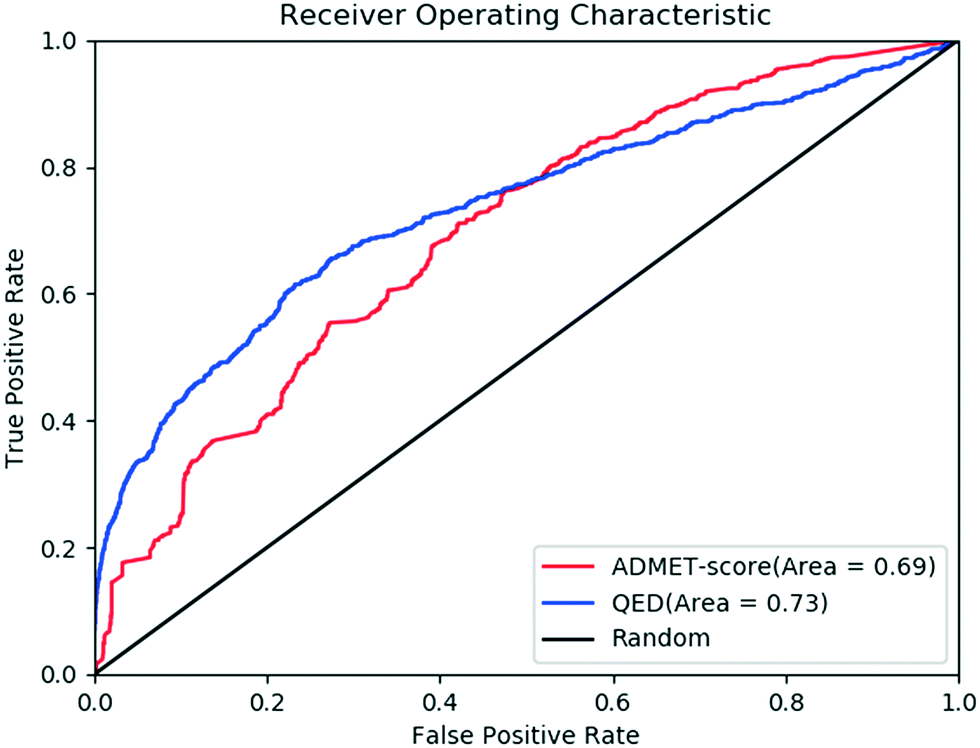 | ||
| Fig. 6 Receiver operating characteristic (ROC) plots of the true positive rate (TPR; sensitivity) against the false positive rate (FPR; 1 – specificity) for the classification of compounds. ROC plot classification of compounds from DrugBank or ChEMBL using the QED (blue line) and ADMET-score (red line). | ||
4.3 Comparison of the ADME and ADMET properties
Efficacy and safety are two decisive factors that affect the potential of the NME to be a drug. Therefore, appropriate ADMET properties at therapeutic doses are important for drug discovery. Previous studies showed that balancing toxicity with ADME properties by MPO (multi-parameter optimization) allows a project team to define a profile of property criteria that they require in an ideal compound.49,50 Therefore, predictions of toxic hazards must be balanced against other properties and given appropriate weight in the selection and design of compounds in early drug discovery.50In order to investigate the contributions of toxicity and ADME properties respectively, we separated the prediction results of toxicity endpoints (CARC, hERG, AO, Ames) from the ADMET-score, which was named the ADME-score. For the ADME-score, we calculated the arithmetic mean of the three data sets and the p-value between them. The results showed that the mean ADME-score of oral drugs was 0.5038, which was similar to the ADME-score of withdrawn drugs (0.4957). Small molecules from ChEMBL had the lowest ADME-scores. In our expectation, the p-value between DrugBank and WITHDRAWN for the ADME-score was 0.301, which indicated that most of the withdrawn drugs had the same ADME properties as the approved drugs.
In addition, we defined a new score named the T-score only using the four toxicity endpoints to assess whether WITHDRAWN truly does score more “toxic”. Unlike the scoring function ADME-score, the metrics of the T-score between WITHDRAWN and DrugBank is statistically significant (p-value = 0.016). It is expected since the withdrawn drugs were mostly due to their adverse reactions and toxic effects. This is the reason why we added toxic endpoints and gave them high weights.
The cumulative curve given in Fig. 7A indicates that there was no difference in the ADME-score between DrugBank and WITHDRAWN, while clear distinction existed between drugs and small-molecules from ChEMBL. This proved that both the toxicity and ADME properties should be taken into account in drug discovery. The result also confirmed that withdrawn drugs have good ADME properties, but with certain toxicity. As we can see from Fig. 7B, the different distribution of the T-score between DrugBank and WITHDRAWN suggested that toxicity should be an indispensable part to evaluate the drug-likeness before a compound reaches the clinic.
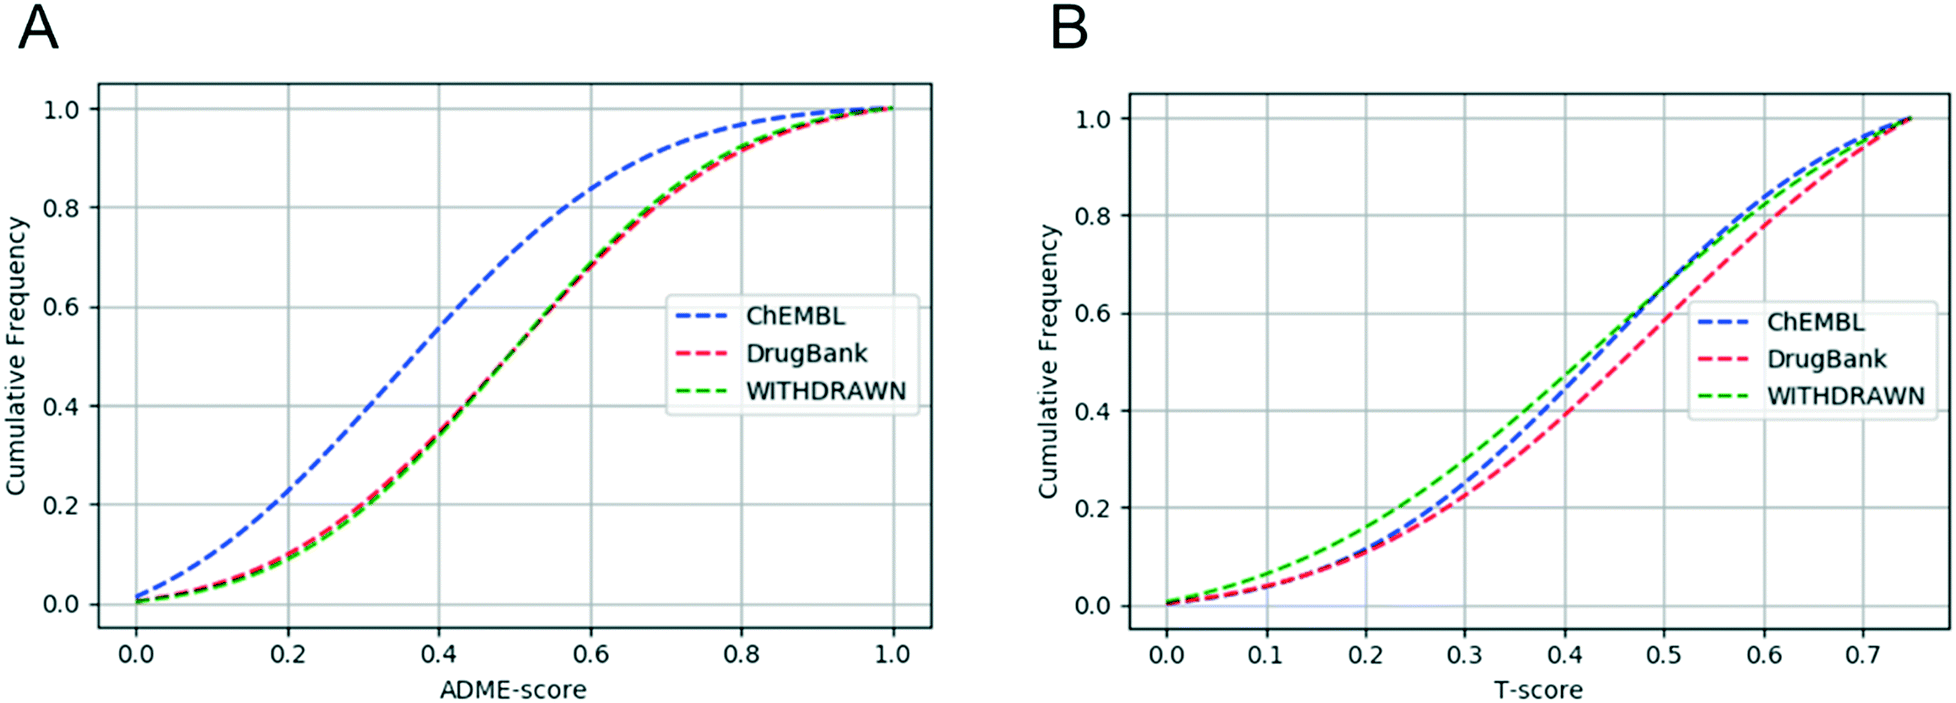 | ||
| Fig. 7 (A) Cumulative ADME-score distribution for the three data sets: the ChEMBL data set (blue), the DrugBank data set (red), and the WITHDRAWN data set (green). (B) Cumulative T-score distribution for the three data sets: the ChEMBL data set (blue), the DrugBank data set (red), and the WITHDRAWN data set (green). | ||
5 Conclusions
In this study, 18 predictive models were used to define a new scoring function for comprehensive evaluation of chemical drug-likeness. Taking both ADME and toxicity into consideration, the ADMET-score was calculated by the prediction results of 18 biological endpoints, and these predictions were given appropriate weights based on the importance of endpoints in drug discovery, the distribution of oral drugs and the accuracy of the models. The ADMET-score can be used to rank molecules for drug discovery in terms of their ADMET properties. To validate the scoring function, we compared the ADMET-scores of compounds in the DrugBank, ChEMBL, and WITHDRAWN data sets. The results showed that the difference in ADMET-scores among the three data sets is statistically significant, and the physicochemical properties and biological properties should be both considered. Moreover, we investigated the role toxicity plays in our ADMET-score. The results showed that the toxic endpoints play an important role in distinguishing the risky compounds. In conclusion, our study developed a reliable scoring function for compounds according to their ADMET properties predicted by in silico models we built in previous work. The rank of the ADMET-score can be used for drug screening in the early stage of drug discovery.Conflicts of interest
There are no conflicts to declare.Acknowledgements
This work was supported by the National Natural Science Foundation of China (Grants 81872800 and 81673356).References
- I. Kola and J. Landis, Nat. Rev. Drug Discovery, 2004, 3, 711–715 CrossRef CAS PubMed.
- A. Mullard, Nat. Rev. Drug Discovery, 2018, 17, 81–85 CrossRef CAS PubMed.
- V. B. Siramshetty, J. Nickel, C. Omieczynski, B. O. Gohlke, M. N. Drwal and R. Preissner, Nucleic Acids Res., 2016, 44, D1080–D1086 CrossRef CAS PubMed.
- T. H. Keller, A. Pichota and Z. Yin, Curr. Opin. Chem. Biol., 2006, 10, 357–361 CrossRef CAS PubMed.
- O. Ursu, A. Rayan, A. Goldblum and T. I. Oprea, WIREs Comput. Mol. Sci., 2011, 1, 760–781 CrossRef CAS.
- C. A. Lipinski, F. Lombardo, B. W. Dominy and P. J. Feeney, Adv. Drug Delivery Rev., 1997, 23, 3–25 CrossRef CAS.
- A. K. Ghose, V. N. Viswanadhan and J. J. Wendoloski, J. Comb. Chem., 1999, 1, 55–68 CrossRef CAS PubMed.
- T. I. Oprea, J. Comput.-Aided Mol. Des., 2000, 14, 251–264 CrossRef CAS PubMed.
- I. Muegge, S. L. Heald and D. Brittelli, J. Med. Chem., 2001, 44, 1841–1846 CrossRef CAS PubMed.
- M. Feher and J. M. Schmidt, J. Chem. Inform. Comput. Sci., 2003, 43, 218–227 CrossRef CAS PubMed.
- W. P. Walters and M. Namchuk, Nat. Rev. Drug Discovery, 2003, 2, 259–266 CrossRef CAS PubMed.
- S. Zheng, X. Luo, G. Chen, W. Zhu, J. Shen, K. Chen and H. Jiang, J. Chem. Inf. Model., 2005, 45, 856–862 CrossRef CAS PubMed.
- S. K. Bhal, K. Kassam, I. G. Peirson and G. M. Pearl, Mol. Pharmaceutics, 2007, 4, 556–560 CrossRef CAS PubMed.
- R. Macarron and J. I. Luengo, Future Med. Chem., 2011, 3, 505–507 CrossRef PubMed.
- E. Byvatov, U. Fechner, J. Sadowski and G. Schneider, J. Chem. Inform. Comput. Sci., 2003, 43, 1882–1889 CrossRef CAS PubMed.
- V. V. Zernov, K. V. Balakin, A. A. Ivaschenko, N. P. Savchuk and I. V. Pletnev, J. Chem. Inform. Comput. Sci., 2003, 43, 2048–2056 CrossRef CAS PubMed.
- K. R. Muller, G. Ratsch, S. Sonnenburg, S. Mika, M. Grimm and N. Heinrich, J. Chem. Inf. Model., 2005, 45, 249–253 CrossRef PubMed.
- Q. Li, A. Bender, J. Pei and L. Lai, J. Chem. Inf. Model., 2007, 47, 1776–1786 CrossRef CAS PubMed.
- J. Sadowski and H. Kubinyi, J. Med. Chem., 1998, 41, 3325–3329 CrossRef CAS PubMed.
- M. Wagener and V. J. van Geerestein, J. Chem. Inform. Comput. Sci., 2000, 40, 280–292 CrossRef CAS PubMed.
- W. P. Walters and M. A. Murcko, Adv. Drug Delivery Rev., 2002, 54, 255–271 CrossRef CAS PubMed.
- T. Hou, X. Qiao and X. Xu, Acta Chim. Sin., 2001, 59, 1788–1792 CAS.
- S. Tian, J. Wang, Y. Li, X. Xu and T. Hou, Mol. Pharmaceutics, 2012, 9, 2875–2886 CrossRef CAS PubMed.
- G. R. Bickerton, G. V. Paolini, J. Besnard, S. Muresan and A. L. Hopkins, Nat. Chem., 2012, 4, 90–98 CrossRef CAS PubMed.
- I. Yusof and M. D. Segall, Drug Discovery Today, 2013, 18, 659–666 CrossRef CAS PubMed.
- F. Cheng, Y. Yu, J. Shen, L. Yang, W. Li, G. Liu, P. W. Lee and Y. Tang, J. Chem. Inf. Model., 2011, 51, 996–1011 CrossRef CAS PubMed.
- F. Cheng, Y. Yu, Y. Zhou, Z. Shen, W. Xiao, G. Liu, W. Li, P. W. Lee and Y. Tang, J. Chem. Inf. Model., 2011, 51, 2482–2495 CrossRef CAS PubMed.
- X. Li, Z. Du, J. Wang, Z. Wu, W. Li, G. Liu, X. Shen and Y. Tang, Mol. Inf., 2015, 34, 228–235 CrossRef CAS PubMed.
- X. Li, L. Chen, F. Cheng, Z. Wu, H. Bian, C. Xu, W. Li, G. Liu, X. Shen and Y. Tang, J. Chem. Inf. Model., 2014, 54, 1061–1069 CrossRef CAS PubMed.
- D. S. Wishart, Y. D. Feunang, A. C. Guo, E. J. Lo, A. Marcu, J. R. Grant, T. Sajed, D. Johnson, C. Li, Z. Sayeeda, N. Assempour, I. Iynkkaran, Y. Liu, A. Maciejewski, N. Gale, A. Wilson, L. Chin, R. Cummings, D. Le, A. Pon, C. Knox and M. Wilson, Nucleic Acids Res., 2018, 46, D1074–D1082 CrossRef CAS PubMed.
- A. Gaulton, A. Hersey, M. Nowotka, A. P. Bento, J. Chambers, D. Mendez, P. Mutowo, F. Atkinson, L. J. Bellis, E. Cibrian-Uhalte, M. Davies, N. Dedman, A. Karlsson, M. P. Magarinos, J. P. Overington, G. Papadatos, I. Smit and A. R. Leach, Nucleic Acids Res., 2017, 45, D945–D954 CrossRef CAS PubMed.
- H. Veith, N. Southall, R. L. Huang, T. James, D. Fayne, N. Artemenko, M. Shen, J. Inglese, C. P. Austin, D. G. Lloyd and D. S. Auld, Nat. Biotechnol., 2009, 27, 1050–1055 CrossRef CAS PubMed.
- F. Cheng, W. Li, Y. Zhou, J. Shen, Z. Wu, G. Liu, P. W. Lee and Y. Tang, J. Chem. Inf. Model., 2012, 52, 3099–3105 CrossRef CAS PubMed.
- H. Yang, C. Lou, L. Sun, J. Li, Y. Cai, Z. Wang, W. Li, G. Liu and Y. Tang, Bioinformatics, 2019, 35 DOI:10.1093/bioinformatics/bty707 , in press.
- J. Shen, F. Cheng, Y. Xu, W. Li and Y. Tang, J. Chem. Inf. Model., 2010, 50, 1034–1041 CrossRef CAS PubMed.
- H. P. The, I. Gonzalez-Alvarez, M. Bermejo, V. M. Sanjuan, I. Centelles, T. M. Garrigues and M. A. Cabrera-Perez, Mol. Inf., 2011, 30, 376–385 CrossRef PubMed.
- K. Hansen, S. Mika, T. Schroeter, A. Sutter, A. ter Laak, T. Steger-Hartmann, N. Heinrich and K. R. Muller, J. Chem. Inf. Model., 2009, 49, 2077–2081 CrossRef CAS PubMed.
- Y. Kido, P. Matsson and K. M. Giacomini, J. Med. Chem., 2011, 54, 4548–4558 CrossRef CAS PubMed.
- S. Wang, Y. Li, J. Wang, L. Chen, L. Zhang, H. Yu and T. Hou, Mol. Pharmaceutics, 2012, 9, 996–1010 CrossRef CAS PubMed.
- Z. Wang, Y. Chen, H. Liang, A. Bender, R. C. Glen and A. Yan, J. Chem. Inf. Model., 2011, 51, 1447–1456 CrossRef CAS PubMed.
- M. Carbon-Mangels and M. C. Hutter, Mol. Inf., 2011, 30, 885–895 CrossRef CAS PubMed.
- Discovery Studio 3.5, Accelrys, San Diego, CA, 2017 Search PubMed.
- G. Divine, A. Kapke, S. Havstad and C. L. M. Joseph, Stat. Med., 2010, 29, 108–115 Search PubMed.
- J. A. Williams, R. Hyland, B. C. Jones, D. A. Smith, S. Hurst, T. C. Goosen, V. Peterkin, J. R. Koup and S. E. Ball, Drug Metab. Dispos., 2004, 32, 1201–1208 CrossRef CAS PubMed.
- F. Broccatelli, E. Carosati, A. Neri, M. Frosini, L. Goracci, T. I. Oprea and G. Cruciani, J. Med. Chem., 2011, 54, 1740–1751 CrossRef CAS PubMed.
- S. Tian, J. Wang, Y. Li, D. Li, L. Xu and T. Hou, Adv. Drug Delivery Rev., 2015, 86, 2–10 CrossRef CAS PubMed.
- C. A. Lipinski, F. Lombardo, B. W. Dominy and P. J. Feeney, Adv. Drug Delivery Rev., 2012, 64, 4–17 CrossRef.
- T. J. Hou, J. M. Wang, W. Zhang and X. J. Xu, J. Chem. Inf. Model., 2007, 47, 460–463 CrossRef CAS PubMed.
- M. D. Segall, Curr. Pharm. Des., 2012, 18, 1292–1310 CrossRef CAS PubMed.
- M. D. Segall and C. Barber, Drug Discovery Today, 2014, 19, 688–693 CrossRef CAS PubMed.
Footnote |
| † Electronic supplementary information (ESI) available. See DOI: 10.1039/c8md00472b |
| This journal is © The Royal Society of Chemistry 2019 |