Surface-enhanced laser-induced breakdown spectroscopy utilizing metallic target for direct analysis of particle flow
Ziyu
Yu
abc,
Shunchun
Yao
 *abc,
Lifeng
Zhang
abc,
Zhimin
Lu
abc,
Zener Sukra
Lie
d and
Jidong
Lu
abc
aSchool of Electric Power, South China University of Technology, Guangzhou, Guangdong 510640, China. E-mail: epscyao@scut.edu.cn; Tel: +86 13925150807
bGuangdong Province Key Laboratory of Efficient and Clean Energy Utilization, Guangzhou, Guangdong 510640, China
cGuangdong Province Engineering Research Center of High Efficiency and Low Pollution Energy Conversion, Guangzhou, Guangdong 501640, China
dComputer Engineering Department, Faculty of Engineering, Bina Nusantara University, 9 K.H. Syahdan, Jakarta 11480, Indonesia
First published on 8th November 2018
Abstract
In this paper, surface-enhanced laser-induced breakdown spectroscopy (SENLIBS) method utilizing metallic target was proposed to enhance and stabilize plasma for direct analysis of particle flow. A metallic target was installed in the particle flow to provide a target surface, which was expected to fix the laser ablation position and enhance plasma intensity. Comparative experiments were carried out between conventional LIBS and SENLIBS. Results showed that sampling rate was improved by SENLIBS and the metallic target had a lower breakdown threshold than silica particle flow. Plasma images confirmed that plasma morphology was more stable. Based on these changes, the signal intensity was enhanced by more than 3 times for silicon emission line at 288.16 nm. Meanwhile, signal repeatability was greatly improved, with relative standard deviation (RSD) of the pulse-to-pulse signal decreased from 116% to 48%. Further investigation showed that SENLIBS has potential in improving measurement sensitivity, as the signal to noise ratio (SNR) increased from 9.89 to 18.63. Overall, these results demonstrated the feasibility and enhancement effects of SENLIBS.
1. Introduction
Laser-induced breakdown spectroscopy (LIBS), with advantages of in situ, real-time measurements, has been widely applied for elemental analysis.1–4 In recent years, there has been growing interest in the scientific community to develop direct analysis of particle flow by LIBS.5–9 Solids in the form of particle flow can be directly analyzed by LIBS without extra sample preparation. One distinct advantage of this scheme was that it significantly shortened the measurement period and simplified the experimental system.5 Despite this, direct analysis of particle flow presented several inherent drawbacks in use. One of the main obstacles was the fluctuation of particle flow. Plasma generated on particle flow was particularly unstable compared to plasma generated on solid surfaces, which resulted in weak signal intensity and significant signal uncertainty. Generally, the relative standard deviation (RSD) of emission line intensity in LIBS analysis of particle flow was larger than that of pellet. The former was about 60%,7 while the latter was about 10%.10 Another common problem was the random air breakdown, which brought about more spurious spectra, degrading the measurement effectiveness. One of the ways to overcome these difficulties was to enhance the laser-induced plasma signal for direct analysis of particle flow. Various enhancement strategies have been established, such as dual-pulse LIBS,11,12 spark discharge assisted LIBS,13,14 and spatial confinement scheme.15–18 These strategies were considered to be effective in improving LIBS signal intensity and pulse–pulse signal repeatability. However, DP-LIBS as well as spark discharge scheme undeniably increased the complexity and expense of experimental set-up. Meanwhile, spatial confinement scheme was more suitable for pellet samples, so that a chamber or a cavity could be easily made.Another technique, surface-enhanced LIBS (SENLIBS), enhanced LIBS signal by the aid of a metallic target.19 SENLIBS smeared liquid or powder samples onto the surface of metallic substrates with various sample pretreatments. Plasma generated on the substrate surface indirectly ablated sample material and was composed of a mixture of species from the metallic substrate and the sample.20 Taking advantage of this, SENLIBS was able to improve the analytical performance of LIBS, especially in limit of detection (LOD) and negligible matrix effects. As a simple and effective enhancement technique, SENLIBS has been applied to the analysis of many samples, including oils,21,22 sunscreen,23 heavy metals in liquids,24,25 and powders.26
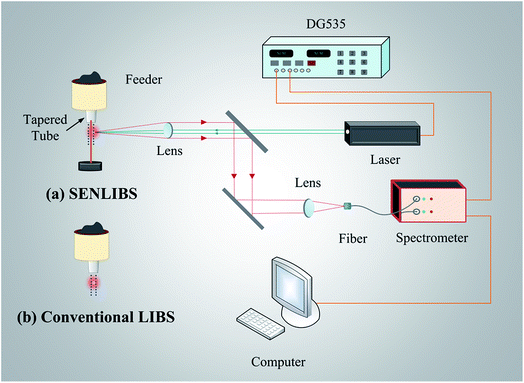
However, to the best of our knowledge, application of SENLIBS in the direct analysis of particle flow has not been reported before. The aim of this paper is to apply SENLIBS technique for direct analysis of particle flow. This scheme installs a metallic target in the particle flow. In this way, sample preparation is no longer needed in the current SENLIBS scheme. Consequently, it is able to achieve on-line analysis of LIBS. To identify the feasibility of the proposed scheme, two different analytical strategies in the direct analysis of silica particle flow were carried out and compared: (i) conventional LIBS and (ii) SENLIBS. Laser sampling rate, breakdown threshold and plasma morphology were investigated. The feasibility of the proposed scheme in practical use is also discussed.
2. Experimental apparatus
Fig. 1 displays the experimental apparatus of direct analysis of particle flow by SENLIBS and conventional LIBS. A Q-switched Nd:YAG laser (Elite-200, Beamtech, China) delivered 1064 nm pulse with pulse frequency of 5 Hz. Laser was focused by a quartz lens (100 mm focal length, 25.4 mm diameter) to generate plasma. The emission signals were collected by an optical fiber and detected by a dual-channel spectrometer (AvaSpec-2048-2, Avantes, Holland) with spectral resolution of 0.05–0.1 nm, integration time gate of 1.05 ms, and wavelengths of 235–400 nm and 575–790 nm. The digital delay generator (DG535, Stanford Research System, U.S.A.) synchronized the laser and the spectrometer to output desired delay time of 1 μs for optimal SNR. Particle flow was introduced to the measurement area utilizing a piezoelectric type vibrational feeder (PEF-90A, Sanki, Japan) with vibration frequency at 224 Hz. A home-made tapered tube with diameter of 4 mm was connected to the feeder in order to beam-focus particle flow and improve laser sampling rate at focus point.7 Sample used in the experiment was pure silica particles with particle size of 106 μm. Silica particles fall freely from the tapered tube, forming particle flow with average mass flow rate of 1.26 g min−1 under given vibration frequency of the powder feeder. As Fig. 1 presented, in SENLIBS scheme, metallic target rod with diameter of 2 mm was inserted into the tapered tube and remained unchanged during the experiment. The laser was focused onto the target rod surface to generate plasma. Particles streaming down through the measurement area were ablated. Meanwhile, conventional LIBS was achieved by removing the target rod from the tapered tube without changing any other experimental parameters. In this case, particle flow streamed downwards from the tapered tube without target rod inside. Laser was focused onto the particle flow and particles were ablated directly along the path of laser beam.In the experiment, copper and aluminium were selected as the materials for target rod on the basis of no spectral line overlapping with the analytical lines, which were Si I 288.16 nm and N I 746.83 nm. Target rod surface was polished and cleaned to rule out interference of containments of the rod before each experiment. It should be noted that a crater was produced on the target rod which was likely to significantly modify the plasma after large number of laser shots. Moreover, the deposition of particles may affect laser transmission. In order to address these concerns, the original spectra from multiple shots were examined. It is believed that the spectral data are reliable within 1000 laser shots since no significant difference was detected among them. Therefore, the spectra from 1000 laser shots by SENLIBS and conventional LIBS were collected and used for analysis.
3. Results and discussion
3.1 Spurious data
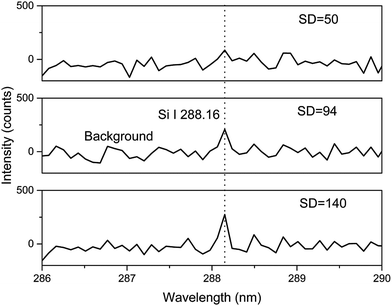
Some spectra acquired in the experiment did not contain emission lines of major elements in particles, which were identified as spurious spectra. Spurious spectra can cause significant error in analysis results. Additionally, spurious spectra rate reflected the measurement effectiveness. Prior to analyzing spectral data, it was first necessary to identify and remove spurious spectra with a proper filtering algorithm. Filtering algorithm for spurious spectra in this experiment was as follows:27 the standard deviation (SD) of the intensity of five pixels in the emission line profile of Si I 288.16 nm was calculated and compared to a manually determined threshold (94 in the experiment). Those spectra whose SD was smaller than 94 were identified as spurious spectra. Those spectra whose SD was larger than 94 were identified as true spectra. Fig. 2 compares the silicon emission line profile from single-shot spectrum with different SD values. In spurious spectra (SD = 50), the peak intensity of Si I 288.16 nm is basically equivalent to average background intensity. In critical condition (SD = 94), the silicon emission line profile can be distinguished from the background. In true spectra (SD = 140), the silicon line profile is distinct and its peak intensity is much larger than the average background intensity.3.2 Air breakdown ratio
Previous study revealed that spurious spectra stemmed from incomplete breakdown of particles resulting from uneven distribution of particles around the laser focusing spot and complex interactions between the laser and particle flow.6 It is suggested that air breakdown instead of silica breakdown has absorbed the majority of laser energy and thus caused strong nitrogen emission but weak or even no silicon emission. In order to assess the influence of random air breakdown in laser-induced plasma, a new parameter defined as the air breakdown ratio β was proposed in the following equation: | (1) |
| Spectra identification | SD (counts) | β (a.u.) |
|---|---|---|
| Spurious | 50 | 16 |
| Critical | 94 | 10 |
| True | 140 | 7 |
3.3 Enhancement effect
Subsequent spectral analysis is carried out after spurious spectra are removed. Fig. 3(a) compares the ensemble average of true spectra of silica particles in conventional LIBS and SENLIBS with copper rod. The laser energy is fixed at 90 mJ. Si I 288.16 nm, Cu I 324.75 nm, and N I 746.83 nm are chosen as the representative spectral lines for the breakdown of silica particles, the copper substrate and the air, respectively. Due to the presence of the copper target rod, strong copper emission was detected in the spectra. Spectral overlap of Cu lines with Si lines or N lines was not discovered in the experiment. However, it will be a problem for particle samples having other compositions. To address such concerns, an aluminium rod was also used as target rod to analyze silica particle flow. The spectral comparison is presented in Fig. 3(b). It was demonstrated that both copper rod and aluminium rod sufficiently enhance the silicon emission with similar enhancement effect. The result indicates that SENLIBS can be achieved by metallic targets of multiple materials. The spectral overlap of element from target rod to the analytical ones can be avoided by selecting appropriate metallic target. Due to the similar enhancement effect of using copper rod or aluminium rod as the metallic target, only the result of using copper target rod is discussed in the following analysis.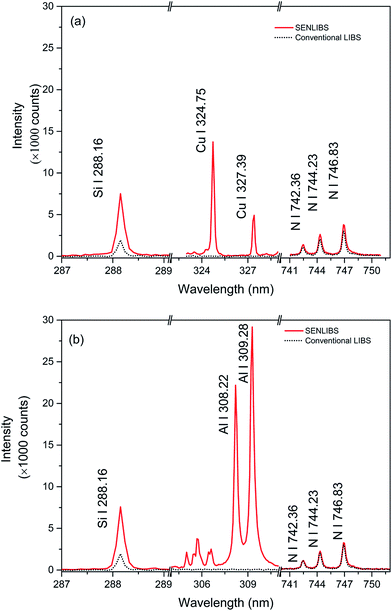 | ||
| Fig. 3 Spectra of silica particles from conventional LIBS and SENLIBS using: (a) copper rod and (b) aluminium rod. | ||
Signal intensity, pulse-to-pulse signal repeatability, measurement effectiveness and the air breakdown ratio β are further analyzed and displayed in Table 2. This data is quite revealing in several ways. First, compared with conventional LIBS, the peak intensity of Si I 288.16 nm increased by more than 3 times using the target rod. Second, the RSD of the intensity of Si I 288.16 nm declined from 116% to 48%. The pulse-to-pulse signal repeatability improved significantly, which is critical for LIBS quantitative analysis of particle flow. Last, as the ratio β decreased from 1.56 to 0.50, the effect of random air breakdown in plasma was reduced. The spurious spectra ratio dropped to 0% in the SENLIBS scheme accordingly. Overall, SENLIBS can consistently generate more stable plasma with stronger emission intensity in the analysis of particle flow compared with conventional LIBS.
| Si I 288.16 nm | Conventional | SENLIBS |
|---|---|---|
| Intensity (counts) | 1943 | 7519 |
| RSD (%) | 116 | 48 |
| Spurious spectra rate (%) | 9.7 | 0 |
| β (a.u.) | 1.56 | 0.50 |
3.4 Enhancement mechanism
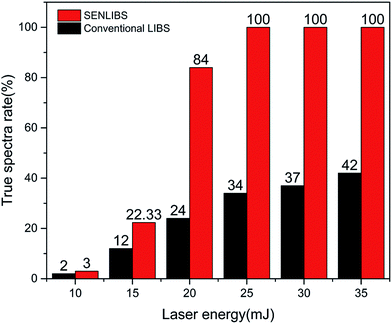
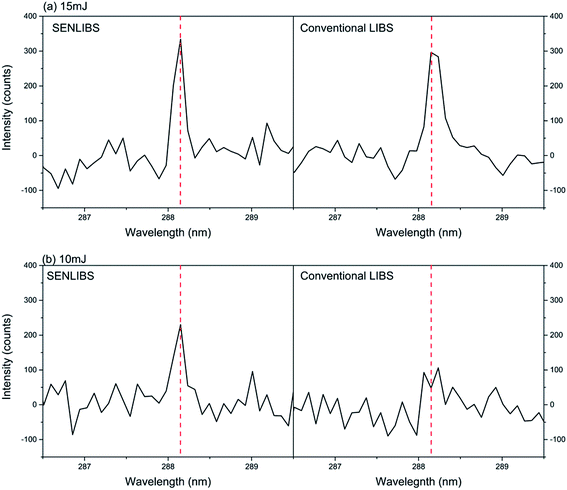
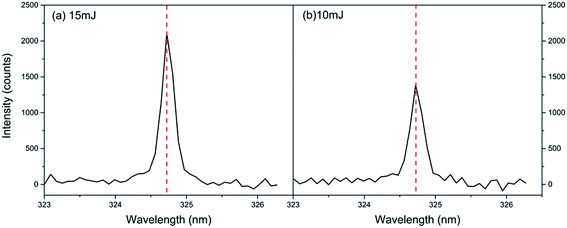
In general LIBS analysis, signal intensity is closely related to the total number density of the element. To investigate the enhancement mechanism of SENLIBS, sampling rate was studied. Sampling rate is often discussed in LIBS analysis for aerosols, defined as the percentage of particles ablated in laser-induced plasma. High sampling rate allows LIBS analysis of discrete particles distributed in plasma volume. Inspired by this, sampling rate was further studied and considered to be one of the reasons for the enhancement effect by SENLIBS. A set of experiments was carried out with laser energy ranging from 10 mJ to 35 mJ and energy gradient set to 5 mJ. Each experiment recorded 600 spectra. Each spectrum is identified as spurious spectra or true spectra by the same filtering algorithm mentioned earlier. True spectra rate was then calculated and is presented in Fig. 4. True spectra rate was utilized to indicate laser sampling rate because its value is positively correlated with the number of particles ablated in plasma. A positive correlation was found between laser energy and true sampling rate as more silica particles are ablated at high laser energy. Another important conclusion from Fig. 4 is the significant improvement in true spectra rate of SENLIBS. The improvement factors are 1.5, 1.83, and 3.5 at 10 mJ, 15 mJ and 20 mJ, respectively. When laser energy increases to 25 mJ, SENLIBS achieves 100% true spectra rate. However, conventional LIBS obtains 34% at the same laser energy. In contrast, SENLIBS ensures good measurement effectiveness at much lower laser energy, which is another advantage of SENLIBS. The application of a target rod narrows the particle outflow. Therefore, under the same mass flow rate, particle density in the measurement zone increases accordingly. In this case, the amount of silica particles ablated in plasma increases in SENLIBS. Previous study suggested that one of the significant consequences of low sampling rate with LIBS was a potential decrease in emission intensity.28 Therefore, the improvement in sampling rate of SENLIBS is one of the reasons for the significant enhancement of signal intensity.It was experimentally observed that plasma was not generated in every laser shot in conventional LIBS when laser energy was adjusted to a specific low value. However, SENLIBS can still ensure plasma generation at low laser energy. This result can be explained by the fact that the breakdown threshold of a metallic target is lower than that of silica particle flow. Breakdown threshold is generally defined as the minimum laser energy that causes laser-induced breakdown for a sample material.29,30 Previous study25 has evaluated that one of the enhancement mechanisms was that the plasma of metallic target has a lower breakdown threshold. Thus, the breakdown thresholds of silica particle and metallic target were further investigated to elucidate the possible enhancement mechanism. Fig. 5 compares the spectra from SENLIBS and conventional LIBS with laser energy set to 10 mJ and 15 mJ, respectively. The spectra are obtained by averaging all true spectra from 600 measurements. Both SENLIBS and conventional LIBS can detect significant silicon emission at 15 mJ, as shown in Fig. 5(a). However, at 10 mJ, silicon emission disappears in the spectra of conventional LIBS. In contrast, silicon emission is still present in the SENLIBS scheme. This indicates that the breakdown threshold of silica particles is greater than 10 mJ. In order to evaluate the breakdown threshold of the metallic target, Fig. 6 compares Cu I 324.75 nm at 15 mJ and 10 mJ. It is evident that the copper emission is remarkable in the spectra, with peak intensity over 1000 counts at 10 mJ. The findings reported here confirm that the breakdown threshold of metallic target is much lower than that of silica particle flow. In this way, the SENLIBS scheme is able to ensure constant generation of plasma at 10 mJ. As suggested in a prior study,19 hot and dense plasma forms on the metallic target surface. Then, plasma expands to the surroundings. Silica particles engulfed in plasma are vaporized, ionized and excited. This explains why the SENLIBS scheme can enhance signal intensity of Si I 288.16 nm.
3.5 Plasma morphology
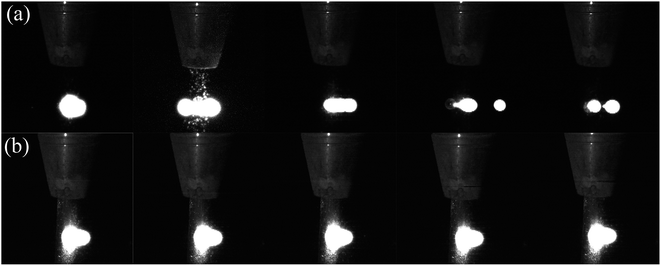
Apart from signal enhancement, pulse-to-pulse signal repeatability was also found to be improved in SENLIBS. Plasma morphology reflects the ablation situation, which has a close relationship to the LIBS signal. Thus, plasma morphology was studied to explain the enhancement of signal repeatability. A high-speed camera (Photron FASTCAM Mini UX50, Japan) was applied to record plasma morphology using 2000 fps, delay time of 0.5 μs and exposure time about 4 μs. The laser (90 mJ, 5 Hz) fired 20 times during recording time (4 s). Five typical plasma images of conventional LIBS and SENLIBS are displayed in Fig. 7. Under normal circumstances, plasma of conventional LIBS expands outward in all directions, exhibiting an approximately spherical shape, while plasma of SENLIBS is in a hemispherical shape as it is generated on a surface.What is apparent in Fig. 7 is that plasma morphology in conventional LIBS is much less stable than that in SENLIBS. As inferred in previous study,6 signal repeatability has been limited by the fluctuation of particle flow, which fails to guarantee optimal particle distribution. Therefore, it is difficult to ensure stable ablation of the silica particles, which is the major cause for signal uncertainty in conventional LIBS. Meanwhile, in SENLIBS, the copper target rod provides a surface for laser focus and plasma generation. It is assumed that ablation of the copper substrate would not be interrupted by the fluctuation of particle flow. Plasma morphology in Fig. 7(b) provides further support for this idea, because plasma location and shape are almost unchanged from pulse-to-pulse. It also shows that the plasma generated on the surface engulfs and then ablates the surrounding silica particles. This provides some explanation as to why signal uncertainty is significantly reduced in SENLIBS.
Another observed improvement was the measurement effectiveness. As can be seen in Fig. 7(a), plasma is frequently generated along the path of the laser beam and even occasionally separates to two parts in one frame. Previous study believed that a low number density of small-sized particles and no large-sized particles existing in the focus volume will result in this type of plasma morphology.6 As a result, much smaller plasma compared to normal is exhibited in the particle flow, indicating that the silica particles are incompletely ablated. Accordingly, silicon emission is much lower than the normal level in the corresponding spectrum. However, SENLIBS confines the plasma in the particle flow and thus reduces the proportion of unwanted air breakdown. Although random air breakdown also exists in the experiment, its influence has been weakened. The comparison of plasma morphology helps to understand how the lower spurious spectra rate and smaller β can be achieved in SENLIBS.
3.6 Practical use
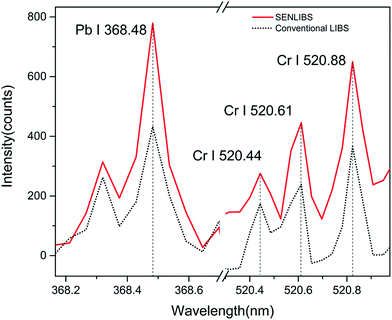
To evaluate the feasibility of SENLIBS in practical use, municipal solid waste incinerate fly ash (MSWI fly ash) was collected from a waste incineration power plant and analyzed by conventional LIBS and SENLIBS. In this experiment, a total of 200 spectra for each scheme were recorded by an eight-channel spectrometer (AvaSpec-2048-8, Avantes, Holland), covering the wavelength range from 175 nm to 1075 nm with resolution of 0.05 nm to 0.1 nm and delay time of 1 μs. The laser pulse frequency was set to 2 Hz. Other experimental settings remained the same as earlier experiments. As Si I 288.16 nm can be detected in the spectra, spurious spectra were identified following the same criteria.Analysis of trace heavy elements such as Cr and Pb, is of great interest in MSWI fly ash analysis. MSWI fly ash used in this study contained 0.1 wt% Cr2O3 and 0.1 wt% Pb2O3, making chromium emission and lead emission particularly weak in conventional LIBS. Fig. 8 compares chromium emission and lead emission spectra of conventional LIBS and SENLIBS. There is a significant signal enhancement in SENLIBS. Table 3 provides a summary of signal intensity, pulse-to-pulse RSD and SNR of Pb I 368.48 nm, where the signal intensity refers to peak intensity of average spectra with background intensity subtracted. The signal intensity was enhanced by a factor of 1.8. It should be noted that the signal enhancement factor is less than that of the earlier experiment. Such divergence can be explained in part by sample properties, including elemental components, particle size and mass flow rate. For signal repeatability, Table 3 shows that SENLIBS reduces the pulse-to-pulse RSD of Pb line, which is in accordance with the earlier experimental result in Section 3.3. The most striking finding in Table 3 is that SNR, an important indicator for measurement sensitivity and LOD, has increased in the experiment, indicating that SENLIBS has great potential in improving measurement sensitivity and LOD of trace element analysis. This result further confirms the feasibility of SENLIBS for improving analysis performance of practical samples collected from industrial sites.
| Pb I 368.48 nm | Conventional | Target rod enhanced |
|---|---|---|
| Intensity (counts) | 432 | 779 |
| RSD (%) | 101 | 50 |
| SNR (a.u.) | 9.89 | 18.63 |
4. Conclusion
This study applied SENLIBS technique for direct analysis of particle flow without extra sample pretreatment. The results of this study show that the SENLIBS scheme can significantly enhance the signal intensity, reduce pulse-to-pulse signal uncertainty, and improve measurement effectiveness. One of the more significant findings to emerge from this work is that SENLIBS shows great potential in improving the measurement sensitivity and LOD of trace elements in practical use. Analysis of sampling rate and breakdown threshold suggests the mechanisms for enhanced signal intensity. In addition, the study of plasma morphology reveals that more stable plasma can be obtained using SENLIBS, reducing signal uncertainty and the air breakdown ratio. These findings provide additional evidence for the enhancement effect. Overall, this study suggests that SENLIBS is an effective enhancement strategy for LIBS direct analysis in particle flow.Conflicts of interest
There are no conflicts of interest to declare.Acknowledgements
The study was supported by the National Natural Science Foundation of China (51676073 & 51476061), the Guangdong Province Train High-Level Personnel Special Support Program (2014TQ01N334), and the Science and Technology Project of Guangdong Province (2015A020215005).References
- X. Cheng, X. Yang, Z. Zhu, L. Guo, X. Li, Y. Lu and X. Zeng, On-stream analysis of iron ore slurry using laser-induced breakdown spectroscopy, Appl. Opt., 2017, 56(33), 9144–9149 CrossRef PubMed.
- S. Yao, J. Zhao, J. Xu, Z. Lu and J. Lu, Optimizing the binder percentage to reduce matrix effects for the LIBS analysis of carbon in coal, J. Anal. At. Spectrom., 2017, 32(4), 766–772 RSC.
- M. Dong, J. Lu, S. Yao, J. Li, J. Li, Z. Zhong and W. Lu, Application of LIBS for direct determination of volatile matter content in coal, J. Anal. At. Spectrom., 2011, 26(11), 2183–2188 RSC.
- M. Gaft, E. Dvir, H. Modiano and U. Schone, Laser Induced Breakdown Spectroscopy machine for online ash analyses in coal, Spectrochim. Acta, Part B, 2008, 63(10), 1177–1182 CrossRef.
- J. Zheng, J. Lu, M. Dong, S. Yao, W. Lu and X. Dong, Experimental study of laser-induced breakdown spectroscopy (LIBS) for direct analysis of coal particle flow, Appl. Spectrosc., 2014, 68(6), 672–679 CrossRef CAS PubMed.
- S. Yao, J. Xu, J. Zhao, K. Bai, J. Lu and Z. Lu, Characterization of fly ash laser-induced plasma for improving the on-line measurement of unburned carbon in gas–solid flow, Energy Fuels, 2017, 31(5), 4681–4687 CrossRef CAS.
- S. Yao, J. Xu, X. Dong, B. Zhang, J. Zheng and J. Lu, Optimization of laser-induced breakdown spectroscopy for coal powder analysis with different particle flow diameters, Spectrochim. Acta, Part B, 2015, 110, 146–150 CrossRef CAS.
- S. H. Lee and J. J. Yoh, Detection of Carbon Particulates from a High-Speed Stream Reaching 70 Meters/Second, Appl. Spectrosc., 2012, 66(1), 107–113 CrossRef CAS.
- R. Yoshiie, Y. Yamamoto, S. Uemiya, S. Kambara and H. Moritomi, Simple and rapid analysis of heavy metals in sub-micron particulates in flue gas, Powder Technol., 2008, 180, 135–139 CrossRef CAS.
- S. Yao, J. Zhao, J. Xu, Z. Lu and J. Lu, Optimizing the binder percentage to reduce matrix effects for the LIBS analysis of carbon in coal, J. Anal. At. Spectrom., 2017, 32(4), 766–772 RSC.
- Z. Wang, Y. Deguchi, R. Liu, A. Ikutomo, Z. Zhang, D. Chong, J. Yan, J. Liu and F. Jung Shiou, Emission characteristics of laser-induced plasma using collinear long and short dual-pulse laser-induced breakdown spectroscopy (LIBS), Appl. Spectrosc., 2017, 71(9), 2187–2198 CrossRef CAS PubMed.
- M. Cui, Y. Deguchi, Z. Wang, Y. Fujita, R. Liu, F. Shiou and S. Zhao, Enhancement and stabilization of plasma using collinear long-short double-pulse laser-induced breakdown spectroscopy, Spectrochim. Acta, Part B, 2018, 142, 14–22 CrossRef CAS.
- W. Zhou, X. Su, H. Qian, K. Li, X. Li, Y. Yu and Z. Ren, Discharge character and optical emission in a laser ablation nanosecond discharge enhanced silicon plasma, J. Anal. At. Spectrom., 2013, 28, 702–710 RSC.
- W. Zhou, K. Li, Q. Shen, Q. Chen and J. Long, Optical emission enhancement using laser ablation combined with fast pulse discharge, Opt. Express, 2010, 18(3), 2573–2578 CrossRef CAS PubMed.
- A. M. Popov, F. Colao and R. Fantoni, Spatial confinement of laser-induced plasma to enhance LIBS sensitivity for trace elements determination in soils, J. Anal. At. Spectrom., 2010, 25(6), 837–848 RSC.
- L. Guo, Z. Hao, M. Shen, W. Xiong, X. He, Z. Xie, M. Gao, X. Li, X. Zeng and Y. Lu, Accuracy improvement of quantitative analysis by spatial confinement in laser-induced breakdown spectroscopy, Opt. Express, 2013, 21(15), 18188–18195 CrossRef CAS PubMed.
- Z. Wang, Z. Hou, S. Lui, D. Jiang, J. Liu and Z. Li, Utilization of moderate cylindrical confinement for precision improvement of laser-induced breakdown spectroscopy signal, Opt. Express, 2012, 20, 1011–1018 CrossRef PubMed.
- Z. Hou, Z. Wang, J. Liu, W. Ni and Z. Li, Signal quality improvement using cylindrical confinement for laser induced breakdown spectroscopy, Opt. Express, 2013, 21(13), 15974–15979 CrossRef CAS PubMed.
- M. A. Aguirre, S. Legnaioli, F. Almodovar, M. Hidalgo, V. Palleschi and A. Canals, Elemental analysis by surface-enhanced laser-induced breakdown spectroscopy combined with liquid–liquid microextraction, Spectrochim. Acta, Part B, 2013, 79–80(3), 88–93 CrossRef CAS.
- S. Jantzi, V. Motto-Ros, F. Trichard, Y. Markushin, N. Melikechi and A. Giacomo, Sample treatment and preparation for laser-induced breakdown spectroscopy, Spectrochim. Acta, Part B, 2016, 115, 52–63 CrossRef CAS.
- J. Xiu, X. Bai, V. Motto-Ros and J. Yu, Characteristics of indirect laser-induced plasma from a thin film of oil on a metallic substrate, Front. Phys., 2015, 10(2), 231–239 CrossRef.
- J. Xiu, X. Bai, E. Negre, V. Motto-Ros and J. Yu, Indirect laser-induced breakdown of transparent thin gel layer for sensitive trace element detection, Appl. Phys. Lett., 2013, 102(24), 244101 CrossRef.
- L. Zhen, F. Cao, J. Xiu, X. Bai, V. Motto-Ros, N. Gilon, H. Zeng and J. Yu, On the performance of laser-induced breakdown spectroscopy for direct determination of trace metals in lubricating oils, Spectrochim. Acta, Part B, 2014, 99(9), 1–8 Search PubMed.
- X. Y. Yang, Z. Q. Hao, C. M. Li, J. M. Li, R. X. Yi, M. Shen, K. H. Li, L. B. Guo, X. Y. Li, Y. F. Lu and X. Y. Zeng, Sensitive determinations of Cu, Pb, Cd and Cr elements in aqueous solutions using chemical replacement combined with surface-enhanced laser-induced breakdown spectroscopy, Opt. Express, 2016, 24(12), 13410–13417 CrossRef CAS PubMed.
- X. Yang, Z. Hao, M. Shen, R. Yi, J. Li, H. Yu, L. Guo, X. Li, X. Zeng and Y. Lu, Simultaneous determination of La, Ce, Pr and Nd elements in aqueous solution using surface-enhanced laser-induced breakdown spectroscopy, Talanta, 2017, 163, 127–131 CrossRef CAS PubMed.
- Y. Tian, H. C. Cheung, R. Zheng, Q. Ma, Y. Chen, N. Delepine-Gilon and J. Yu, Elemental analysis of powders with surface-assisted thin film laser-induced breakdown spectroscopy, Spectrochim. Acta, Part B, 2016, 124, 16–24 CrossRef CAS.
- S. Yao, L. Zhang, K. Ying, K. Bai, J. Xu, Z. Lu and J. Lu, Identifying laser-induced plasma emission spectra of particles in gas–solid flow based on the standard deviation of intensity across an emission line, J. Anal. At. Spectrom., 2018, 33, 1676–1682 RSC.
- U. Panne and D. Hahn, in Laser-induced breakdown spectroscopy (LIBS), ed. A. W. Miziolek, V. Palleschi and I. Schechter, Cambridge university press, New York, 2006 Search PubMed.
- M. Hashida, A. Semerok, O. Gobert, G. Petite, Y. Izawa and J. Wagner, Ablation threshold dependence on pulse duration for copper, Appl. Surf. Sci., 2002, 197–198, 826–867 Search PubMed.
- D. A. Cremers and L. J. Radziemski, Handbook of laser-induced breakdown spectroscopy, John Wiley & Sons, Ltd, Chichester, 2013 Search PubMed.
| This journal is © The Royal Society of Chemistry 2019 |

