
 Open Access Article
 This Open Access Article is licensed under a Creative Commons Attribution-Non Commercial 3.0 Unported Licence
Recovery and conversion of acetic acid from a phosphonium phosphinate ionic liquid to enable valorization of fermented wastewater†
Ehsan
Reyhanitash
a,
Egor
Fufachev
b,
Kaspar D.
van Munster
a,
Michael B. M.
van Beek
a,
Lisette M. J.
Sprakel
a,
Carmen N.
Edelijn
a,
Bert M.
Weckhuysen
 b,
Sascha R. A.
Kersten
a,
Pieter C. A.
Bruijnincx
bc and
Boelo
Schuur
*a
b,
Sascha R. A.
Kersten
a,
Pieter C. A.
Bruijnincx
bc and
Boelo
Schuur
*a
aUniversity of Twente, Sustainable Process Technology Group, Faculty of Science and Technology, The Netherlands. E-mail: B.Schuur@utwente.nl; Tel: +31 53 489 2891
bUtrecht University, Inorganic Chemistry and Catalysis, Debye Institute for Nanomaterials Science, Utrecht University, The Netherlands
cUtrecht University, Organic Chemistry and Catalysis, Debye Institute for Nanomaterials Science, Utrecht University, The Netherlands
First published on 13th March 2019
Abstract
Production of volatile fatty acids (VFAs) by fermentation is a potential sustainable alternative for conventional petrochemical routes to VFAs. Due to the low VFA content of fermentation broths, robust and economical separation technology has to be devised to recover the VFA. Liquid–liquid extraction of VFAs with the phosphonium phosphinate ionic liquid (IL) [P666,14][Phos] allows good VFA extractability. For an extraction process using [P666,14][Phos] to be green, it is essential to efficiently regenerate the solvent and recover the VFA. To obtain insight into the (strong) intermolecular interactions between [P666,14][Phos] and acetic acid, selected as a model VFA, 1H NMR, 31P NMR, FT-IR and isothermal titration calorimetry (ITC) were applied. The observations were used to interpret operations to recover acetic acid from the IL, which included evaporation at elevated temperature under vacuum, possibly assisted by nitrogen stripping, in situ esterification and back-extraction with volatile bases. Through evaporative regeneration with nitrogen stripping, HAc could be removed, but only down to an HAc/IL molar ratio of 1. The remaining molar equivalent of HAc–IL interacts tightly with the IL by partial proton transfer and strong hydrogen bonding interactions with the phosphinate anion. Back-extraction of HAc with trimethylamine (TMA) and subsequent decomposition of the HAc–TMA complexes allowed for successful IL regeneration. This process uses ten times less amine (TMA) than conventional amine-based extraction processes (e.g. tri-n-octyl amine), and provides a sustainable process route to obtain pure carboxylic acids from highly diluted aqueous solutions without generating large streams of byproducts. Further valorization via in-line vaporization/catalytic ketonization or via in-line thermal decomposition and ketonization of the TMA–HAc salt was also demonstrated, showing the potential of the VFAs as a green platform for bio-based chemicals.
1. Introduction
Volatile fatty acids (VFAs) are important chemicals for daily life with applications ranging from precursors for polymers to food and feed preservers.1–3 Currently, they are mainly produced through petrochemical routes with a total volume of about 107 tonnes per annum.3 Fermentation provides a well-known and green alternative approach to produce VFAs from renewable resources.3,4 Next to glucose, anaerobic fermentation can run on wastewater, transforming waste into value-added VFAs, a true circular economy example.5,6 However, the limited carbon content of wastewater results in low VFA concentrations in the fermentation broth, in turn causing serious separation challenges. Since VFAs exhibit higher boiling points than water, it is not economically feasible to obtain them in high purity from such low VFA concentrations by distillation techniques. Therefore, alternative techniques have to be considered. Affinity separation techniques, such as liquid–liquid extraction (LLX), can selectively recover VFAs from dilute aqueous solutions.7,8 The solvent for such a LLX process must be selective towards VFAs to minimize the energy demand of further purification. Furthermore, it is essential that the solvent is regenerated after the extraction to release the extracted VFAs and allow for solvent reuse.Conventional solvents for carboxylic acid extraction include alcohols, ethers, ketones, esters and composite solvents thereof, often containing organophosphates and aliphatic amines to improve their extraction performance.7,9–13 When used for extraction of carboxylic acids from aqueous streams as dilute as fermented wastewater, these solvents often exhibit only a moderate extraction capacity and/or selectivity, and their use may be hindered by a significant solvent loss. In an attempt to address these limitations, ionic liquids (ILs) have been proposed for extraction of carboxylic acids.14–19 A potential advantage of ILs is their low volatility which might facilitate their regeneration.20,21 In particular, the highly hydrophobic trihexyl(tetradecyl)phosphonium bis-2,4,4-(trimethylpentyl)phosphinate ([P666,14][Phos]) has been reported to exhibit high carboxylic acid extraction capacities.14,16,22 In addition, unlike the molecular extraction solvents based on aliphatic amines, [P666,14][Phos] maintains a high extraction performance even at low carboxylic acid concentrations,14,22,23 making it an ideal medium for extraction from dilute streams such as fermented wastewater.
Unfortunately, most studies only report on extraction with an IL and do not cover subsequent regeneration of the IL. The number of studies proposing an efficient and practical regeneration method for [P666,14][Phos] that yields the actual carboxylic acids rather than their carboxylate salts is even more limited. Back-extraction of extracted carboxylic acids from [P666,14][Phos] with a strong base (e.g. NaOH) is so successful that it has been the standard analytical method for determination of its carboxylic acid content.15,18,22,24 However, the product is an aqueous carboxylate salt of the alkali metal rather than the highly concentrated free carboxylic acid stream required for further industrial processing. Blahušiak et al. have proposed molecular distillation as a regeneration strategy for [P666,14][Phos] that can deliver a free VFA stream.24,25 Although elegant and proven to work at higher carboxylic acid concentrations, the required deep vacuum may hinder scale-up and it remains to be demonstrated whether this procedure can yield a [P666,14][Phos] phase that is essentially free of carboxylic acids. Since the non-volatile nature of [P666,14][Phos] will largely determine the evaporation temperature of the mixtures at low carboxylic acid contents, deep recovery of carboxylic acids may be cumbersome due to a strongly increasing temperature even at low pressures. Incomplete evaporation of carboxylic acids from the [P666,14][Phos] phase may not limit the extraction process when they are extracted from concentrated aqueous solutions. However, when [P666,14][Phos] should extract carboxylic acids from diluted aqueous solutions such as fermented wastewater, deep regeneration is essential for effective extraction. To aid the evaporation of acids, a strip gas or sweep gas may be applied to reduce the acid fraction in the vapor phase, and maintain a driving force even at low acid activity in the liquid phase.
Strategies previously studied for the recovery of carboxylic acids from conventional solvents,26–31 are here investigated for the regeneration of [P666,14][Phos], using acetic acid (HAc) as the model VFA. The regeneration strategies include evaporation of HAc from a [P666,14][Phos]–HAc solution under vacuum, possibly assisted with a nitrogen sweep gas stream to reduce the gas phase HAc activity, esterification of HAc under reactive distillation, and reactive back-extraction of HAc with aqueous solutions of the volatile bases NH3 and trimethylamine (TMA). According to the patent literature, the complexes of these volatile bases with carboxylic acids can be thermally decomposed to release the carboxylic acids and the volatile bases.28–31 This prevents the formation of large salt streams as byproduct, which is essential for sustainable production of bio-based VFAs.
[P666,14][Phos]–HAc solutions with various HAc contents were characterized with 1H NMR, 31P NMR, FT-IR and isothermal titration calorimetry (ITC) to gain insight into the nature of the (strong) [P666,14][Phos]–HAc interactions. Furthermore, the effect of hexadecane as diluent was investigated. Dodecane was previously used to reduce the viscosity of [P666,14][Phos] and prevent emulsification.24 In addition, the presence of an inert diluent next to a reactive solvent has been shown to weaken the solvent–carboxylic acid interactions, thus facilitating solvent regeneration.26,32 The higher boiling point of hexadecane in our studies avoids significant co-evaporation of the diluent with the HAc.
To demonstrate the value of VFAs as green bio-based platform chemicals, regeneration of [P666,14][Phos] was coupled with gas-phase catalytic conversion of the liberated HAc, be it directly or from TMA–HAc, over a TiO2-based catalyst into a mixture of ketones, which are valuable chemical building blocks, e.g. for the production of alkylated aromatics.
2. Experimental
2.1. Chemicals
Acetic acid (HAc, ≥99.7%), ammonium acetate (NH4Ac, ≥99%), ammonium hydroxide (NH4OH, 28.0–30.0%), methyl acetate (MeAc, ≥99.8%), dodecane (DoD, ≥99%) and hexadecane (HexD, ≥99%), titanium dioxide P25 (Aeroxide, Evonik) were purchased from Sigma-Aldrich. Methanol (MeOH, ≥99.9%) and potassium hydroxide (KOH, 1 M) were supplied by Merck. [P666,14][Phos] (IL, Cyphos® IL104, ≥95%) was purchased from io-li-tec. Cyanex 272 (H[Phos]) was kindly provided by CYTEC Industries France SARL. Aqueous TMA solution (45 wt%) was purchased from Alfa Aesar.2.2. Acid loading and characterization of acid-loaded IL phases
The IL–HAc solutions were prepared by adding various amounts of HAc to a fixed amount of IL to achieve the desired HAc![[thin space (1/6-em)]](https://www.rsc.org/images/entities/char_2009.gif) :IL molar ratios (Z, defined in eqn (1)). To prepare the IL–HAc–HexD and IL–HAc–DoD solutions, various amounts of HAc were added to a fixed amount of a IL–HexD or IL–DoD solution with a IL:HexD or IL:DoD mass ratio of 70:30.
:IL molar ratios (Z, defined in eqn (1)). To prepare the IL–HAc–HexD and IL–HAc–DoD solutions, various amounts of HAc were added to a fixed amount of a IL–HexD or IL–DoD solution with a IL:HexD or IL:DoD mass ratio of 70:30. | (1) |
For the 31P NMR and FT-IR studies, IL–HAc solutions with 0.25 < Z < 40 were prepared. Pure H[Phos] was included as the reference point for the protonated anion ([Phos]−) of the IL.
ITC was performed on a IL–HexD solution with 70 wt% IL by a TA Instruments TAM III Microcalorimeter operated with a measurement principle based on dynamic correction. The titration syringe was filled with 300 μL HAc. The 4 mL sample vial contained about 2.7 mL of the IL–HexD solution. A certain amount of water with an equal heat capacity to that of the IL–HexD solution was transferred into the reference cell. The stirrer speed was set at 80 rpm and the temperature at 25 °C. The injection volume was 10 μL for the first 26 injections and 20 μL for the following injections. The injection interval was 85 min to ensure that the signal was back at the baseline level before the following injection.
2.3. Experimental procedures
:residue mass ratio of 10:1 which was sufficient to extract all the remaining HAc into the alkali phase. The alkali phase was then neutralized with H2SO4 and analyzed with IC to quantify the unevaporated HAc and assess the efficiency of regeneration.
:HAc mass ratio of about 20:80 to the solution with Z = 6.7, and about 50:50 to the solution with Z = 1.7. The mixtures were then heated to 50 °C at ambient pressure while being stirred. At 50 °C, MeOH was added to the solution with Z = 6.7 at a MeOH:HAc molar ratio of 1:1, and to the solution with Z = 1.7 at a MeOH:HAc molar ratio of 1.85:1. Several samples were taken from the liquids over time and analyzed for their water content with a Karl Fischer titrator to calculate the conversion. The esterification equilibrium reaction is given in eqn (2). Fig. S2 in the ESI† shows a schematic view of the experimental setup.| HAc + MeOH ⇌ MeAc + H2O | (2) |
:1. The two phases were contacted for 1 h (sufficient to reach equilibrium) at room temperature. Afterwards, the alkali phase (back-extract) was separated from the IL phase (raffinate), and after taking a sample for analysis, without further treatment contacted with a fresh IL–HAc solution at the same mass ratio. Subsequent back-extraction stages were carried out until the composition of the alkali phase did not change anymore, implying that it was in equilibrium with the 4.4 wt% HAc in IL solution. Both the loading of HAc and the concentration of NH3/TMA in the alkali phases were determined by ion chromatography (IC). The amounts of NH3/TMA leaching into the IL phase was calculated based on the difference between their initial and final amounts.
:water mass ratio of 50:50, or by adding HAc to a 25 wt% aqueous TMA solution to reach the HAc:TMA molar ratio of 1:1. Approximately 20 g of an HAc-containing aqueous solution of the volatile base was loaded into a three-neck flask. The flask, equipped with a thermocouple and stirring magnet, was placed on a heater/stirrer. A flow of N2 was let into the liquid to facilitate evaporation of HAc and the volatile base. The temperature set point was set 150 °C, higher than all the boiling points. The liquid loss over time was monitored visually. After either fully evaporating/decomposing the contents of the flask or obtaining a visually unchanging residue, the flask was cooled down to room temperature and weighed to determine the mass loss. A sample was then taken from the residue to be analyzed with IC. A schematic view of the experimental apparatus is shown in Fig. S3 in the ESI.†
:1 TMA:HAc molar ratio. In a typical experiment, 2 mL of the aq. TMA–HAc solution was transferred into a round bottomed flask connected to an in-line fixed bed reactor. The borosilicate reactor (i.d. 8 mm) was loaded with 80 mg of TiO2 P25 (212–150 μm sieve fraction) mixed with two volumes of silicon carbide. Prior to desorption, the catalyst was dried at 425 °C for 1 h under a N2 flow of 100 mL min−1. The ketonization reaction was done at 375 °C. Prior to reaction the solution was kept at 100 °C for 30 min to remove water. Finally, thermal decomposition of HAc–TMA was performed at 150 °C under N2-flow (100 mL min−1). All lines between the glass flask and the reactor were heat traced to prevent condensation. Products were collected in a liquid nitrogen cold trap. 0.8 mL of aqueous HCl (37%) was added to the trap to retain TMA. The experimental setup is the same as in Fig. S4†.
2.4. Analysis
HAc concentrations were determined with IC (using a Grom Resin H+ IEX column, 8 μm, 250 × 8 mm, 1 mM H2SO4 solution as mobile phase, a column temperature of 45 °C, and a flow rate of 0.6 mL min−1, on a Metrohm 850 Professional IC). NH4+ concentrations were measured with IC as well (Metrosep C6 – 150/4.0 column, 1.7 mM HNO3 + 1.7 mM dipicolinic acid solution as mobile phase, column temperature of 20 ± 1 °C, flow rate of 1.0 mL min−1, Metrohm 850 Professional IC). Water contents of IL phases were quantified with Karl-Fischer titration (Metrohm 787 KF Titrano). The pH was measured with a Metrohm pH probe (6.0234.100) connected to a Metrohm 780 pH meter.31P NMR and 1H NMR spectra were recorded on an Agilent 400-MR 400 MHz NMR spectrometer. The chemical shifts in the 31P NMR were referenced to an external standard of 85% H3PO4. Attenuated total reflectance Fourier transform infrared spectroscopy (ATR-FTIR) was performed using a Thermo Nicolet iS5 FT-IR Spectrometer equipped with a diamond ATR crystal iD5 accessory. All the measurements were conducted under ambient conditions in air. For each spectrum, 24 scans were recorded with a resolution of 4.0 cm−1.
Product analysis for ketonization of HAc recovered from IL by evaporation was performed with HPLC (Shimadzu Prominence equipped with a RID detector, a Bio-Rad Aminex HPX-87H analytical column and a micro guard H+ column). A 0.5 mM H2SO4 solution was used as the mobile phase flowing at a rate of 0.55 mL min−1 and t-BuOH as the internal standard. The oven temperature was set at 60 °C with a detector temperature of 40 °C. To analyze the HAc that remained in the IL after regeneration, the IL–HAc solution was subjected to a silylation procedure. 0.2 mL of the IL–HAc solution was first mixed with 1 mL of a silylation agent [a mixture of hexamethyldisilazane and trimethylchlorosilane (molar ratio of 2:1)]. The mixture was then heated up to 45 °C, and kept at 45 °C for 30 min. The mixture was subsequently filtered and analyzed on an Agilent 7890 GC-FID equipped with a Vf-5 ms analytical column (30 m × 0.25 mm × 0.25 μm) and a Ret Gap MPolar guard column (2.5 × 0.32, CP8018). Acetone yields and HAc conversions were calculated according to eqn (3) and (4), respectively.
 | (3) |
 | (4) |
Analysis of the reaction products of HAc ketonization from TMA–HAc was done by 1H NMR with an Agilent 400-MR 400 MHz NMR spectrometer. 0.1 mL of collected product mixture was dissolved in 0.5 mL of dimethylsulfoxide-d6 (99.9 atom %D) in a 5 mm NMR tube. The chemical shifts were referenced to the residual solvent peak and 1,4-dioxane was used as internal standard. Acetone yields, HAc conversions and TMA recovered were calculated according to eqn (3)–(5), respectively.
 | (5) |
3. Results and discussion
3.1. Characterization of HAc-loaded IL phases
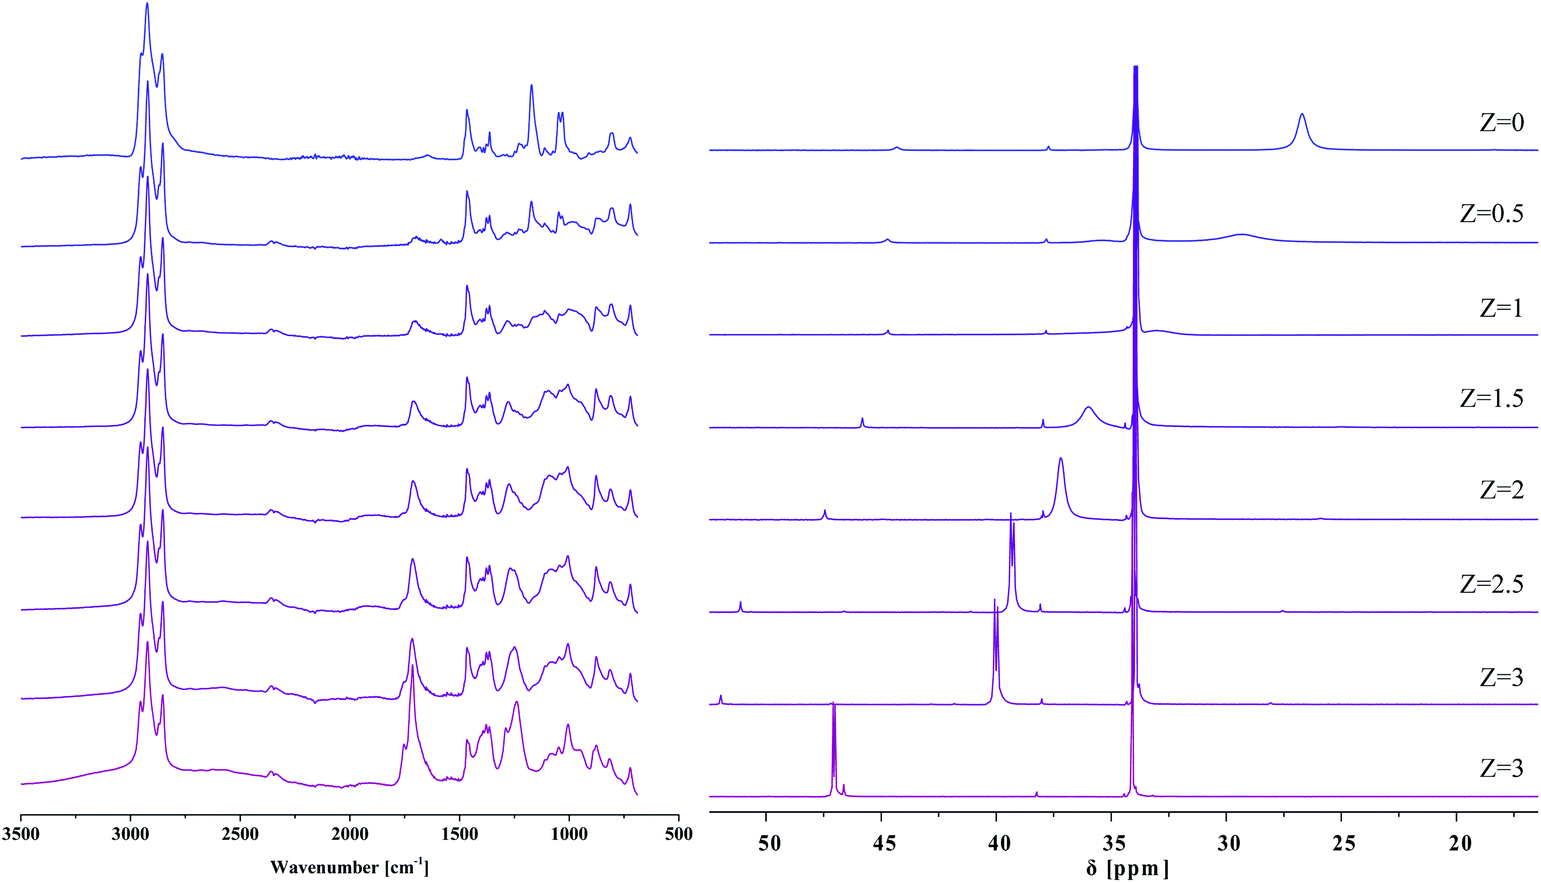
It has been known for over ten years that IL phases are micro-structured,35 and that such micro-structuring may affect their properties. Blahušiak and Schlosser showed that reversed micelles can be formed in [P666,14][Phos] phases.36 Giant vesicles37 and bicontinuous phases with continuous hydrophilic and hydrophobic domains38 have been reported as well. Kashin et al. showed that even with an IL miscible in all ranges with water, at the microscopic level, the system organizes itself in hydrophilic and hydrophobic domains.39 In line with these observations, aggregate formation with carboxylic acids, thus micro-structuring is expected for [P666,14][Phos] as well, as suggested by Marták et al.40,41 To understand the effects of micro-structuring and intermolecular interactions in the [P666,14][Phos] phase on the behavior and recoverability of HAc, IL–HAc mixtures of varying Z were studied with FT-IR, 31P NMR, and 1H NMR. The degree of proton transfer and hydrogen bonding between HAc and the [Phos]− anion were monitored. The 31P NMR and 1H NMR spectra of the IL–HAc solutions with 0 < Z < 40 are shown in Fig. 1.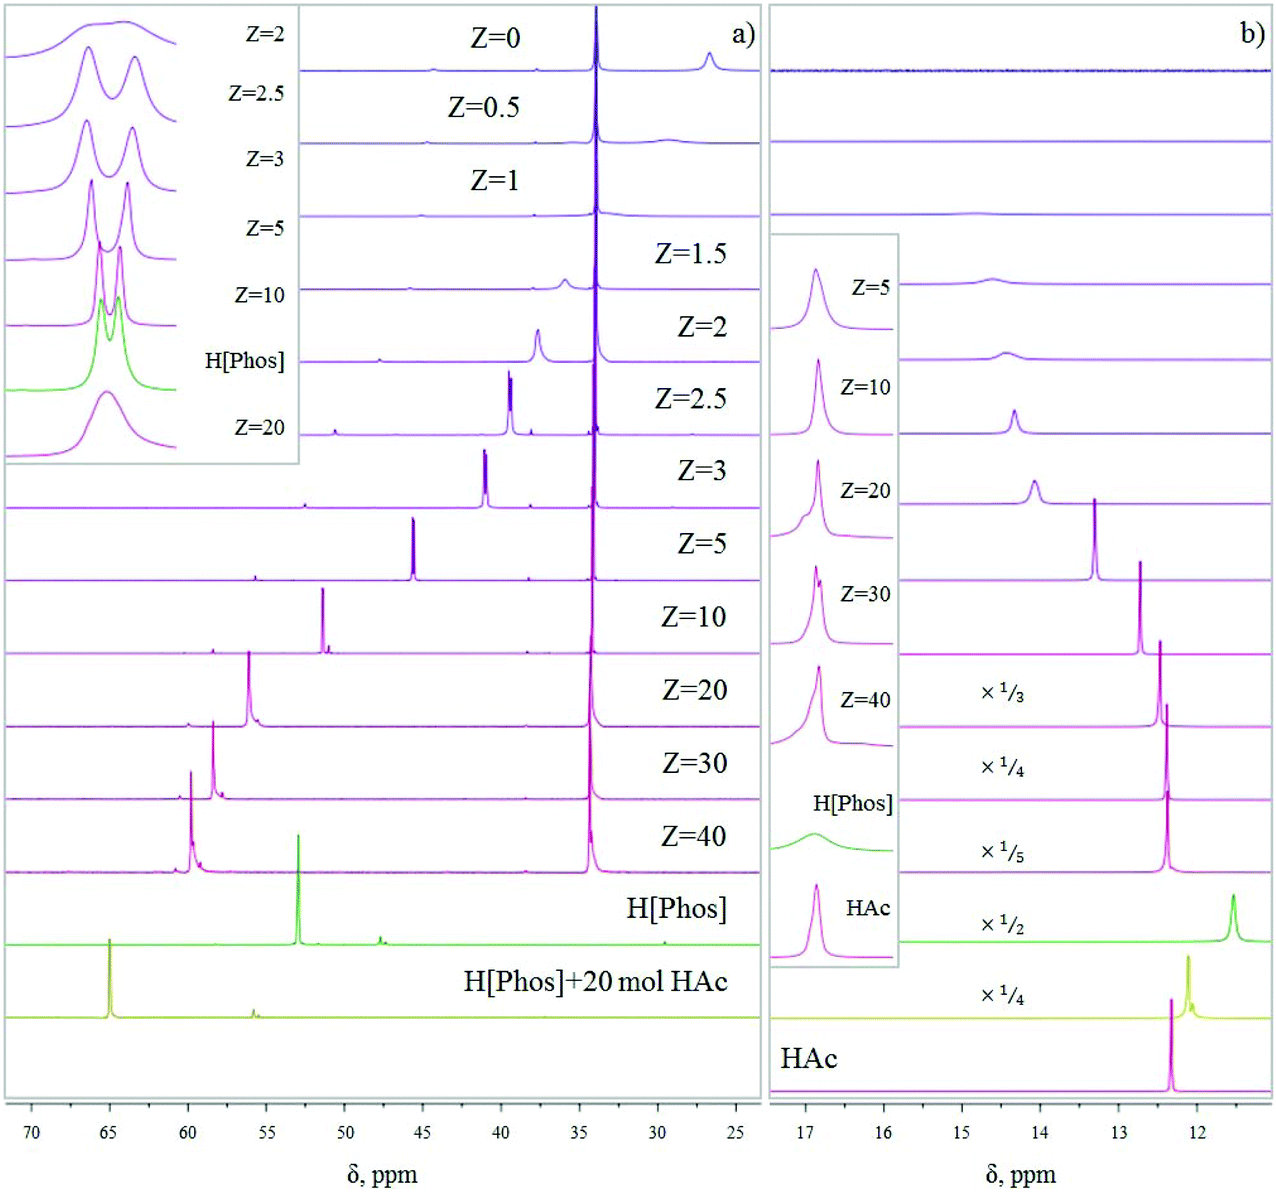 | ||
| Fig. 1 (a) 31P NMR spectra obtained for IL–HAc solutions at various Z values; (b) 1H NMR spectra for the same solutions. The inset shows the evolution of the signal shape. | ||
At Z = 0, the 31P NMR spectrum shows the two expected peaks at 26.7 ppm and 34.3 ppm for the anion and cation of IL, respectively. Minor amounts of organophosphorus impurities were detected in the IL as well.42 Upon addition of HAc to IL, a considerable downfield shift is seen for the anion signal with a concomitant change in peak shape, whereas the cation peak remains unchanged. Cholico-Gonzalez et al. previously attributed an opposite shift to partial deprotonation of the conjugate acid of [Phos]− (H[Phos] or Cyanex 272).43 Here, the gradual downfield shift can then be attributed to an increasing degree of protonation of [Phos]− upon addition of more HAc. With the equilibrium being dynamic and proton exchange fast on the NMR timescale, a weighted average chemical shift was thus observed. If it would be assumed that the weighted average chemical shift is only due to protonation of the anion [Phos]− and deprotonation of HAc, then based on the comparison with the chemical shift of pure H[Phos], full protonation of the anion of IL-104 would occur between 10 < Z < 20.
In addition to the shift of the signal, the signal also sharpened and split upon increasing Z, giving a peak shape similar to pure H[Phos] at Z = 10. The origin of this doublet for H[Phos] and the IL–HAc with Z = 10 is unclear, as singlets were expected for the 31P{1H} spectra.43,44 Upon addition of HAc beyond Z = 10 the signal broadened again and shifted beyond the H[Phos] position. A similar shift was observed upon adding 20 equivalents HAc to H[Phos], suggesting in both cases an additional strong interaction of HAc with H[Phos]. Strong hydrogen bonding and possibly formation of clusters is expected at these HAc loadings,45 also possibly explaining the shoulder in the 1H NMR spectrum at Z ≥ 20. Apparently, at high loadings, protons can be present in different types of clusters that have a slightly different chemical shift, and exchange relatively slowly between different clusters.
The infrared spectra of IL–HAc solutions with various Z are shown in Fig. 2 with peak assignments listed in Table 1.46–48
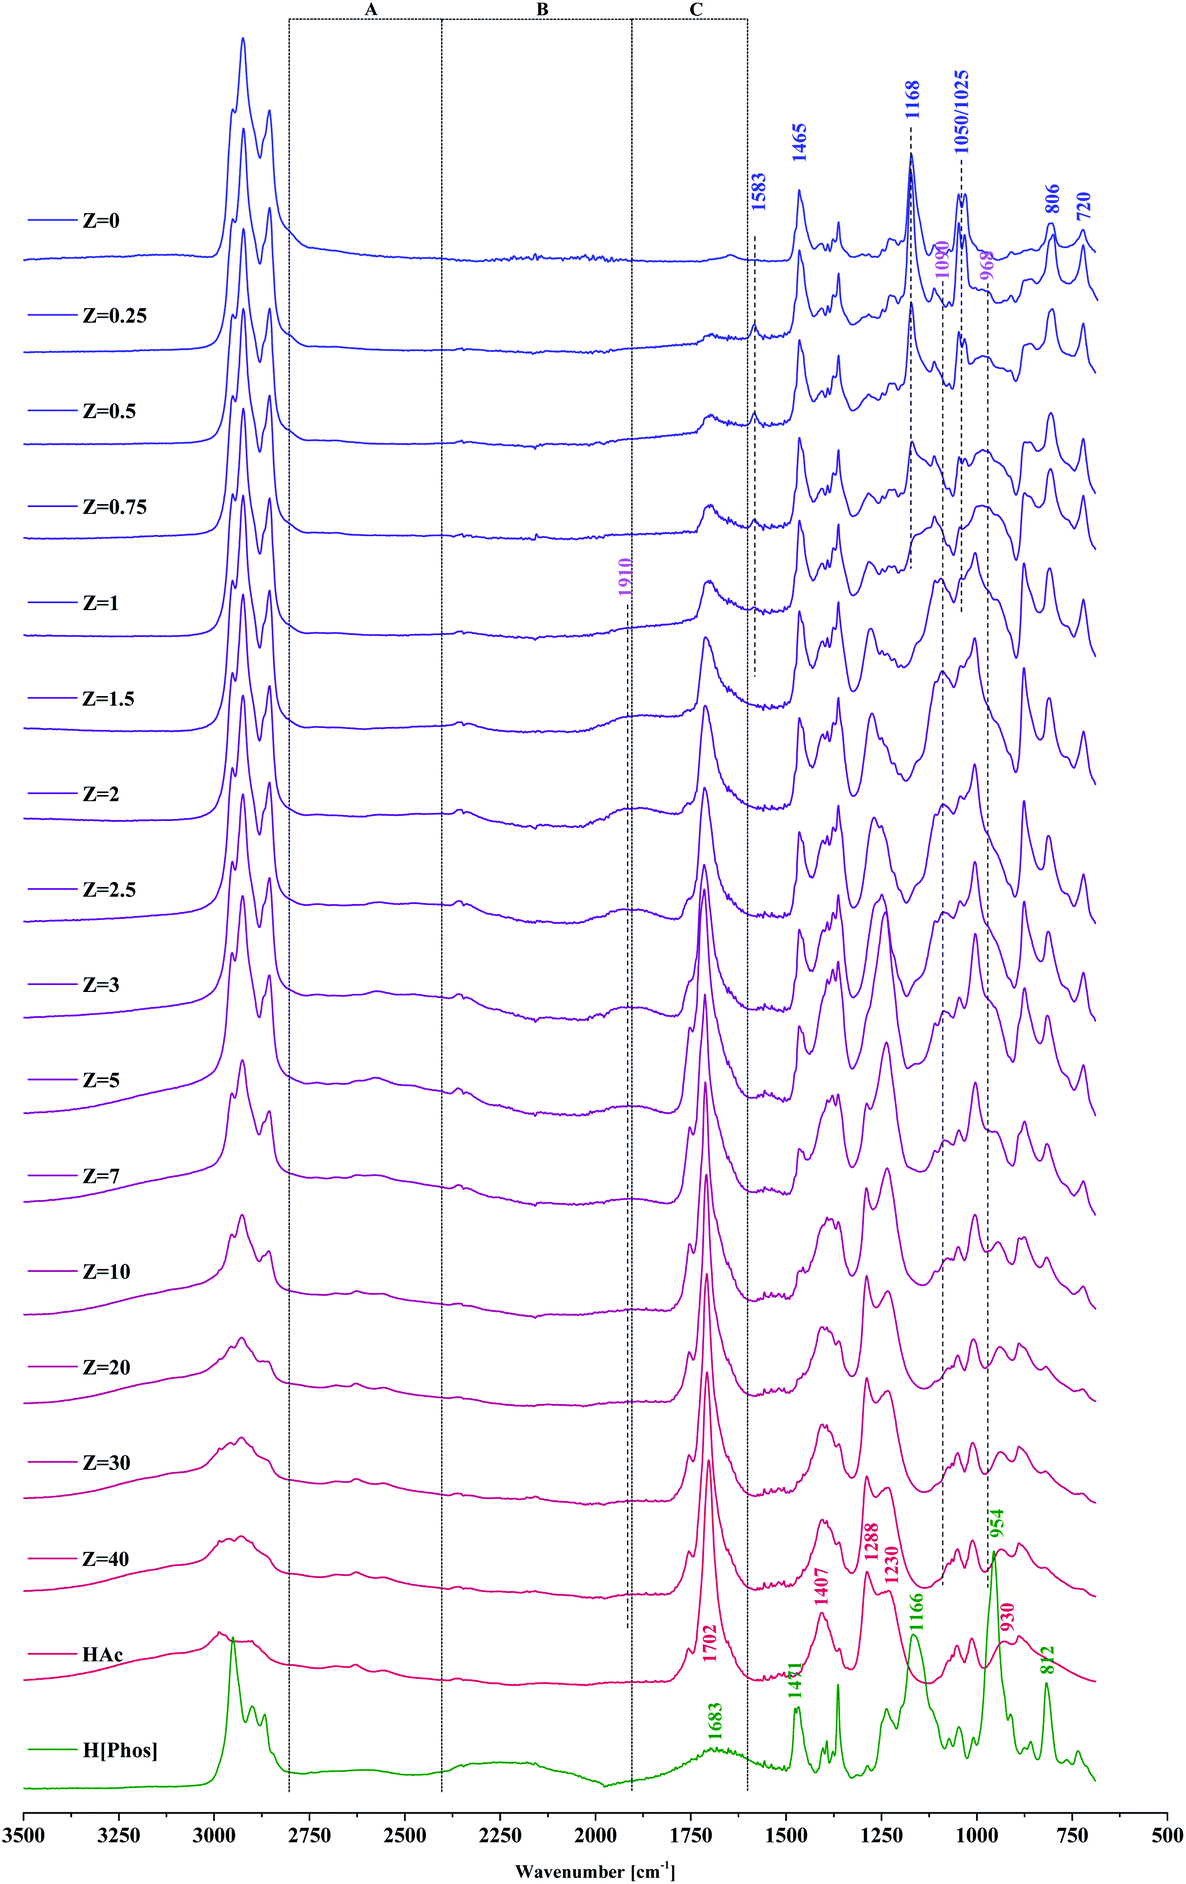 | ||
| Fig. 2 FT-IR spectra of IL–HAc solutions with varying Z. Bands in A, B and C regions are indicative of the strength of hydrogen bonding in IL–HAc solutions. | ||
| Assignment | Assignment | Assignment | |||
|---|---|---|---|---|---|
| [P666,14][Phos] | Wavenumber (cm−1) | HAc | Wavenumber (cm−1) | H[Phos] (Cyanex 272) | Wavenumber (cm−1) |
| C–H str | 2953 (s) | O–H | 3000–2500 (m, w) | C–H str | 2948 (s) |
| C–H str | 2925 (s) | C![[double bond, length as m-dash]](https://www.rsc.org/images/entities/char_e001.gif) O str(asym) O str(asym) |
1702 (s) | C–H str | 2898 (s) |
| C–H str | 2861 (s) | C–O str coupled with OH def(in-plane) | 1407 (s) & 1288 (s) | C–H str | 2869 (m) |
| CH2/CH3 bend | 1465 (s) | C–O str | 1230 (s) | O–H str | 2589 (w) |
| PO2− str(asym) | 1168 (s) | OH⋯O def(out-of-plane) | 930 (s) | O–H str | 2245 (w) |
| PO2− str(sym) | 1050 (s) & 1025 (s) | OH def | 1683 (w, br) | ||
| C–C skeletal | 806 (s) | CH2/CH3 bend | 1471 (m) | ||
| C–H and P–Cstr | 720 (s) | PO str |
1166 (s) | ||
| P–O str | 954 (s) | ||||
| C–C skeletal | 812 (s) | ||||
| C–H and P–C str | 730 (s) |
The shift of the phosphoryl group, a strong proton acceptor,49 suggests its involvement in strong hydrogen bonds with HAc, decreasing the double-bond character of the phosphoryl group, thereby lowering the frequency and broadening the band.50 Indicative of the strength of the hydrogen bonding in the IL–HAc solutions are the broad characteristic A, B and C bands in the ranges of 2800–2400 cm−1, 2400–1900 cm−1 and 1900–1600 cm−1, respectively.51 Appearance of the band around 1910 cm−1 at Z > 1 indicates that the hydrogen bonds formed are very strong, significantly stronger than those between carboxylic acid dimers.51 The significant shift of the out of plane OH deformation from 930 to 950 cm−1 is in line with such strong hydrogen bonding.52 Upon addition of HAc, already at Z = 0.25, a small band appeared at 1583 cm−1 assigned to the asymmetric COO− stretching vibration of carboxylates,47,48,50 which confirms the interpretation of the NMR-results, i.e. that next to the strong hydrogen bonds, also deprotonation of HAc occurs according to eqn (6).
CH3COOH + R2POO− ![[left over right harpoons]](https://www.rsc.org/images/entities/char_21cb.gif) CH3COO− + R2POOH CH3COO− + R2POOH | (6) |
Taken together, the NMR and IR data show that both partial protonation and strong hydrogen bonding contribute to the tight HAc–IL interactions, as shown in Fig. 3. A similar interaction was previously proposed,40 but it did not consider protonation of the anion [Phos]−.
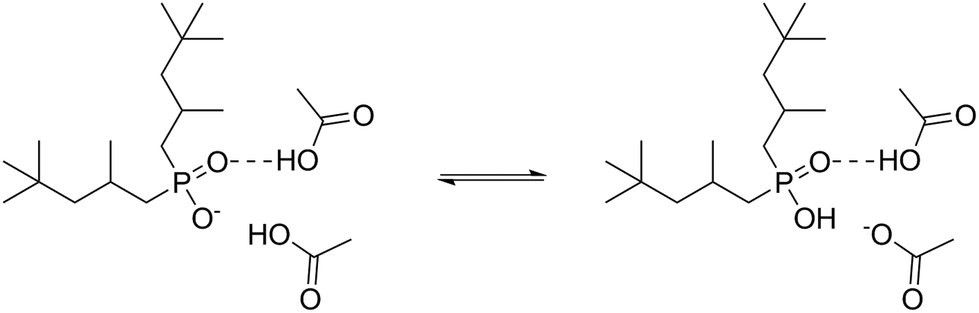 | ||
| Fig. 3 Intermolecular interactions between [Phos]− and HAc. | ||
To study the effect of dilution with an apolar co-solvent on the HAc–IL interactions, the FT-IR and 31P NMR spectra were also measured for several IL–HAc–DoD solutions with varying Z. The results are given in Fig. 4, and are very similar to those given in Fig. 1 and 2 for the undiluted mixtures. For instance, the 31P chemical shifts for [Phos]−, indicative of the equilibrium shown in Fig. 3, are at 39.4 ppm and 39.3 ppm for undiluted and diluted solutions with Z = 2.5 respectively. Overall, the IR and NMR spectra suggest that the ionic and hydrogen bonding HAc–IL interactions stay unchanged upon dilution with dodecane, contrary to earlier observations for other systems where the diluent weakened solvent–carboxylic acid interactions.36,46 Similar behavior is expected for hexadecane, the diluent that was used as well in this study because of its higher boiling point.
 | ||
| Fig. 4 FT-IR (a) and 31P NMR (b) spectra obtained for IL–HAc–DoD solutions with varying Z. | ||
The thermodynamics of HAc–IL interactions were also studied by ITC, measuring the energy released upon HAc addition to a IL–HexD mixture over time. The injections were stopped when the energy released was not significant anymore implying that no further changes in complexation between HAc and IL was taking place. The obtained values over the injection intervals are shown in Fig. 5.
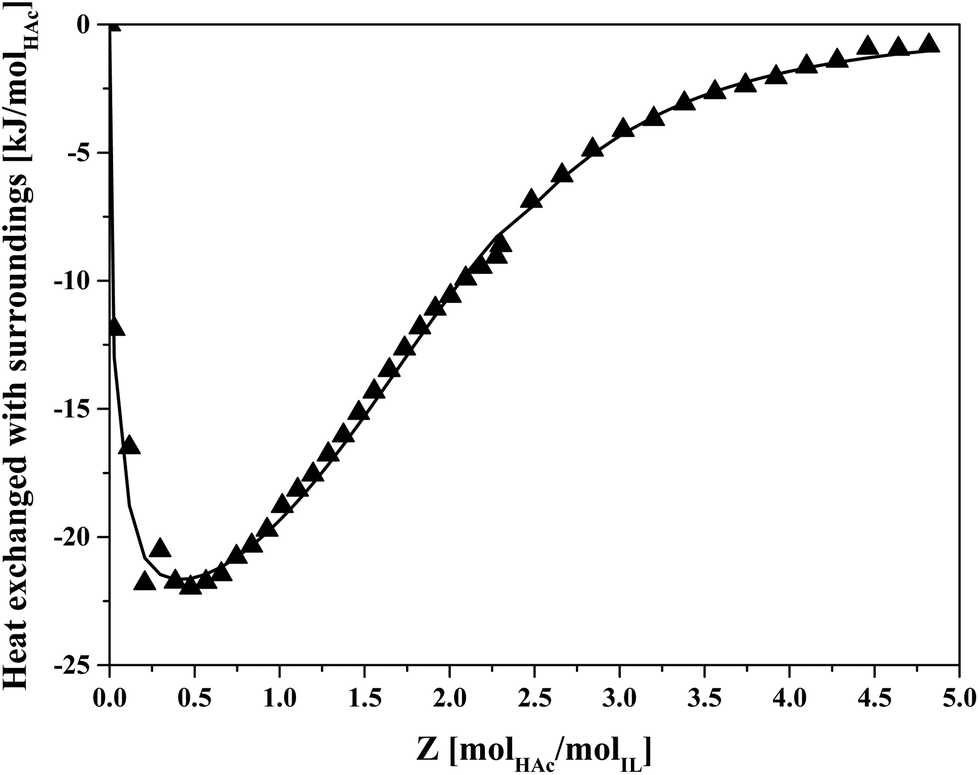 | ||
| Fig. 5 Energy released from sequential injections of HAc into 70 wt% IL IL–HexD solution using ITC. Symbols: measured data, line: fit. | ||
Fig. 5 shows that when approaching Z = 5, the energy release becomes negligible, suggesting at average loadings of more than five molecules HAc per IL ion pair, the heat of interaction due to formation of higher order IL–HAc complexes becomes insignificant. The fitted line corresponds to an average complex stoichiometry of Z = 2. Previously, an overall complexation stoichiometry of Z = 8 was estimated for IL:butyric acid based on biphasic equilibrium data, and complexes with an stoichiometry of up to Z = 11 were applied in a model predicting the distribution of butyric acid in IL–butyric acid solutions.40 That higher loadings have been observed for butyric acid than with HAc may be due to the larger hydrophobic hydrocarbon tail of butyric acid. From the shape of the curve in Fig. 5 it follows that at higher HAc loading, there was a much smaller heat effect than for the first stoichiometric acid:IL pairs, indicating that solvation at higher loading less strongly affects the chemistry in the system than it does at lower loading.
3.2. Regeneration by VFA evaporation under vacuum
Evaporation of HAc from IL–HAc and IL–HAc–HexD solutions under vacuum was studied to investigate whether HAc evaporation would be affected by the diluent or not (Fig. 6).26,32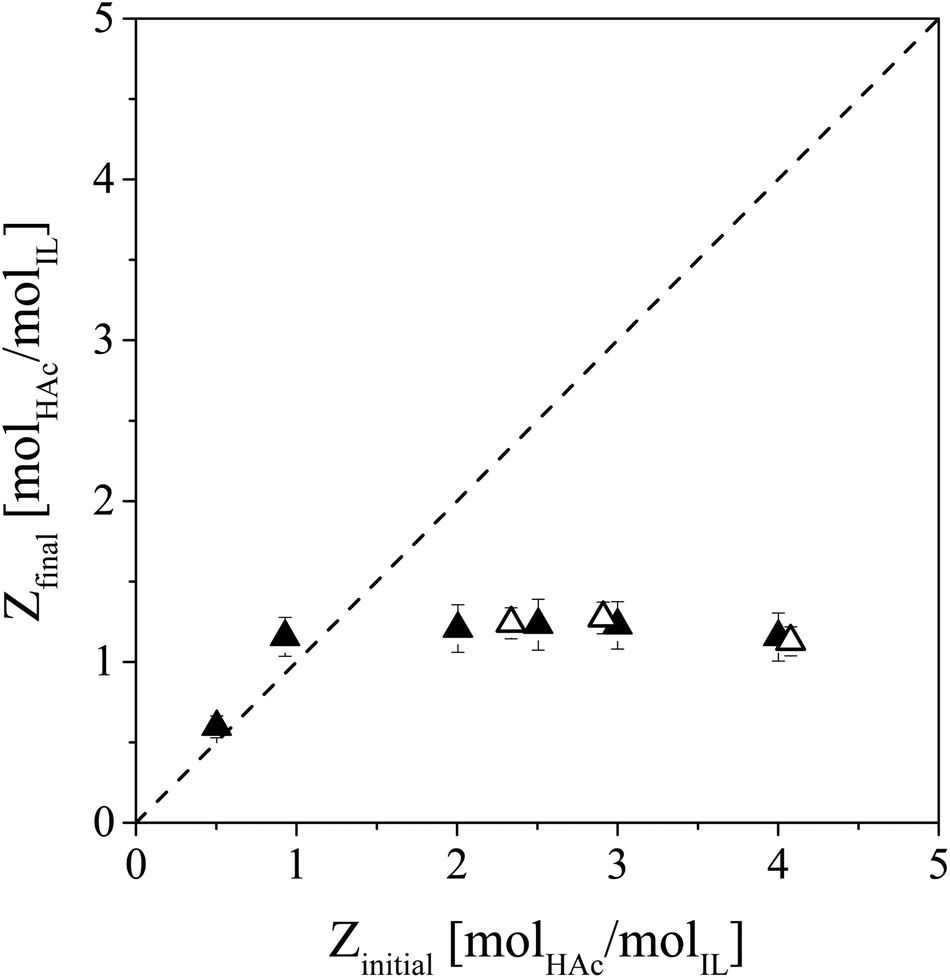 | ||
| Fig. 6 IL regeneration by vacuum evaporation with a nitrogen sweep gas stream. Displayed is the final loading versus the initial loading of HAc in IL–HAc and IL–HAc–HexD solutions. Open symbols: IL–HAc solutions, closed symbols: IL–HAc–HexD solutions, dashed line: Zinitial = Zfinal. | ||
For any initial HAc loading of Z > 1, evaporation lowered the HAc loading in the solutions down to Z ≅ 1, but not any lower. Repeating the same experiments without the stripping gas showed no further reduction in Z than Z ≅ 2.5. Blahušiak et al. showed that under very reduced pressures as low as 5 mbar, and prolonged time, the initial Z of an IL–butyric acid solution can be lowered down to 0.1.24 Our observations indicate that the activity of a VFA in IL is very low. Even under reduced pressure and in the presence of a sweep gas, the first equivalent of HAc could not be removed, suggesting a very strong affinity between [Phos]− and the first HAc equivalent. As the lowest Z that could be obtained in the systems diluted with HexD was approximately 1 as well, it seems that, in these systems as well as in the systems with only IL and HAc, higher order complexes that formed at Z > 1 due to hydrogen bonding and proton transfer are upon evaporation of HAc reduced to 1:1 complexes in which HAc or Ac− tightly binds to H[Phos] or [Phos]−. The strong hydrogen bonds observed with FT-IR support this hypothesis. Since the VFA loading of the saturated IL after LLX from fermented wastewater is below or at best around one,18,22 unfortunately, for this application regime, regeneration of IL by VFA evaporation under vacuum is not feasible. With physical removal of HAc from the IL phase thus not being possible, the IL phase has to be exposed to chemical regeneration.
3.3. Reactive regeneration by esterification
Solvent regeneration by in situ conversion of the carboxyl group of an extracted organic acid into a chemical functionality for which the solvent has a significantly lower affinity has been reported in the literature.9,27,53 Since [P666,14][Phos] is expected to have a much lower affinity for methyl acetate than HAc, an attempt was made to esterify HAc to methyl acetate. Two esterification experiments were at Z = 6.7 and Z = 1.7 and conversion over time is displayed in Fig. 7.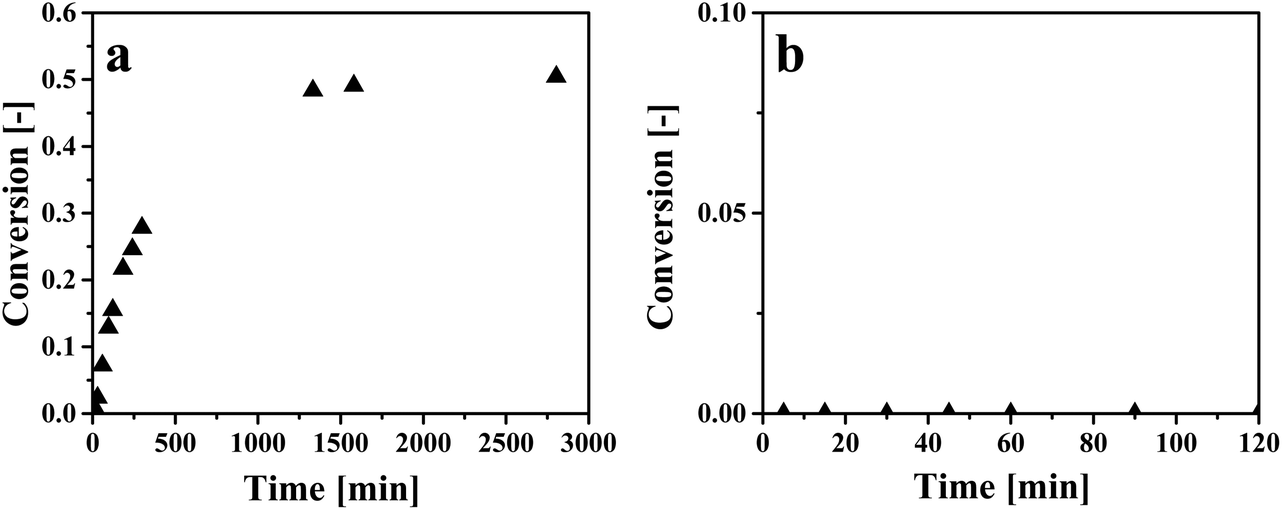 | ||
| Fig. 7 Esterification of HAc in IL–HAc solutions with MeOH. (a) Zinitial = 6.7, molar MeOH:HAc = 1:1, (b) Zinitial = 1.7, molar MeOH:HAc = 1.85:1. | ||
As can be seen in Fig. 7a, when Z was 6.7, an equilibrium conversion of around 0.50 was achieved. An equilibrium conversion of around 0.65 was previously observed for esterification of pure HAc with MeOH at 50 °C when the HAc:MeOH molar ratio was 1:1.54 Thus, the conversion in the presence of IL is in line with the reported value in the literature on esterification without IL. At the lower Z of 1.7 (see Fig. 7b), no conversion was observed at all, most likely due to the limited reactivity of HAc in the IL phase induced by IL:HAc complex formation. This implies that esterification is not possible at HAc loadings achievable when HAc is extracted from dilute aqueous solutions such as artificial fermented wastewater.22 Therefore it is concluded that in situ esterification of HAc is not practical for regeneration of IL, and that another chemical regeneration method has to be found that reduces the chemical interaction of HAc with the IL.
3.4. Regeneration by reactive back-extraction with a volatile base
Complete back-extraction of a carboxylic acid from IL with an aqueous solution of a strong base has been reported in the literature.15,18,22 In this study, aqueous solutions of the volatile bases NH3 and TMA were used to back-extract HAc from IL. The molar loading of HAc in the basic aqueous solutions at equilibrium with the 4.4 wt% IL–HAc solution was determined by multistage cross-current back-extraction experiments. The obtained results are depicted in Fig. 8.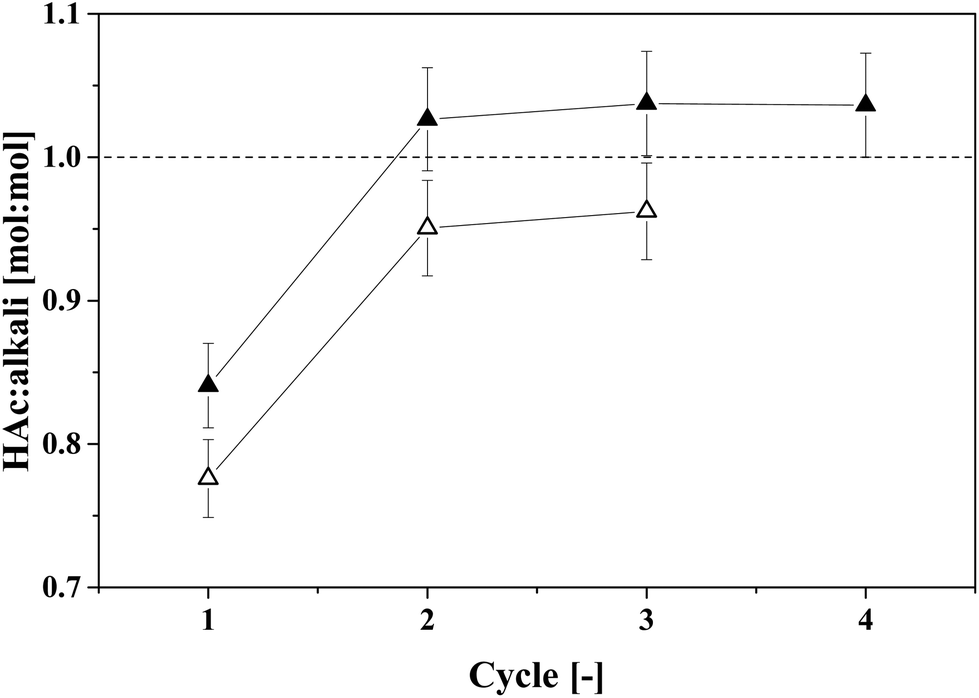 | ||
| Fig. 8 Cross-current back-extraction of HAc from 4.4 wt% IL–HAc solution with aqueous NH3 or TMA solution. Closed symbols represent NH3 solution and open symbols represent TMA solution. The error bars are calculated based on a 2% error in analysis. | ||
Fig. 8 shows that for both volatile bases a back-extraction stoichiometry of approximately unity was achieved after two cross-current extraction stages. Previously, King et al. reported that approximately 2 mol TMA is needed to completely recover 1 mol succinic acid (a dicarboxylic acid) from an adsorbent, pointing to straightforward acid–base chemistry.31 Approximately 10 wt% of the initial NH3 and 2 wt% of the initial TMA were leached into the HAc-free IL phase after back-extraction. This suggests that, to prevent losses of the volatile bases, the back-extracted IL should be stripped to recover the leached volatile base before it is sent back to the primary extraction stage. The obtained molar ratio of 1:1 can be used to determine the required flow rate of a concentrated NH3 or TMA solution for back-extraction, taking into account also the leaching of the volatile base into the IL. Aiming at HAc concentrations as high as possible after thermal regeneration of the TMA–HAc complexes, the TMA concentration should be as high as possible, and when a saturated TMA solution (40 wt% TMA in water) is applied for back-extraction, calculation shows that up to 46.9 wt% HAc can be achieved in the back-extract. By thermal regeneration this can then be converted in a 90 wt% HAc stream with 10 wt% water. These concentrations are calculated assuming that a 4.4 wt% HAc–IL stream containing also 8.4 wt% water is obtained after extraction of HAc from fermented wastewater with only 1 wt% HAc,22 and the regenerated IL stream has a water content of 14.4 wt%.41 An average TMA loss of 1.75 wt% (on initial TMA content basis) was considered. The compositions of all calculated streams are listed in Table 2. Other VFAs may be similarly regenerated, as we observe the same 1:1 stoichiometric acid:base ratio with TMA that was previously reported in studies with several different acids.15,18,22 It may thus be concluded that the amount of TMA needed depends only on the amount (and not the nature) of the VFAs in the broth.
| Species | Concentration [wt%] | ||||
|---|---|---|---|---|---|
| Saturated TMA solution before back-extraction | HAc–IL solution to be back-extracted | TMA solution after back-extraction | Lean IL solution after back-extraction | Final product stream after TMA removal | |
| TMA | 40.0 | 0.0 | 47.9 | 0.1 | 0.0 |
| Water | 60.0 | 8.4 | 5.2 | 14.4 | 10.0 |
| HAc | 0.0 | 4.4 | 46.9 | 0.0 | 90.0 |
| IL | 0.0 | 87.2 | 0.0 | 85.5 | 0.0 |
Table 2 shows that an impressive purification step from 1 wt% (ref. 22) to 90 wt% HAc is possible by LLX with [P666,14][Phos], back-extraction with TMA and thermal regeneration. Comparing the use of TMA with the use of tri-n-octyl amine (TOA) in traditional solvent systems, the data shows that with 1.23 kg TMA per kg HAc versus 12 kg TOA per kg HAc, the approach presented here can reduce the amount of amine use tenfold. A similar concentration enhancement would be possible using NH3 as volatile base, and because of the large driving force by the acid–base interaction, this approach will be applicable for other VFAs as well as mixtures, independent on their composition.
3.5 Thermal regeneration of volatile base – HAc complexes
To complete the recovery of HAc, the HAc should be recovered from the aqueous HAc–volatile base complexes obtained after back-extraction. Thermal decomposition of carboxylic acid–volatile base complexes has been previously examined in the literature.28–31 An incomplete decomposition of the complexes is a potential difficulty, indicated by residual liquid with a high viscosity or a solid residue. Decomposition of NH4Ac and TMA–HAc was assessed and in the first stage in each decomposition experiment a significant mass loss at 100 ± 1 °C was observed, associated with evaporation of water. After evaporation of water from the solutions at 100 ± 1 °C, two relatively viscous liquids were obtained that maintained a relatively stable mass until 140 °C. From 140 °C to 150 °C, the temperature rise was obviously slower, and the viscous liquids continuously lost mass. At 150 °C, all the viscous liquids had disappeared, indicating that a complete decomposition was achieved, demonstrating the feasibility of IL based extraction processes to recover VFAs from fermented wastewater. When applying this technology to extract VFAs from fermented wastewater, it should be considered that butyric acid (HBu) is the main VFA with the highest loading in the IL.18 It is know that ammonium butyrate converts into butyramide at about 185 °C,55 and based on the results of this work, the decomposition temperature of ammonium butyrate is estimated at about 200 °C. The possible butyramide formation makes ammonia an unfavorable candidate for regeneration of IL, and because the tertiary amine TMA is not prone to amide formation, TMA is the best candidate for regeneration of volatile fatty acid-containing IL.A decomposition temperature above the boiling point of HAc results in a gaseous mixture of HAc and TMA that still needs to be purified. In a similar situation, Merciér and Kobler et al. proposed the use of an entrainer in the NH4Ac decomposition that captures HAc while having no interaction with NH3.28,29 The disadvantage of using the entrainer is the need for an extra distillation column to separate HAc from the entrainer. Nevertheless, as these downstream operations are much smaller in volume than the primary extraction, applying a TMA solution for back-extraction presents an effective solution, enabling the use of ILs for extraction of carboxylic acids from dilute aqueous solutions such as fermented wastewater. To further boost the performance of the process, extraction of VFAs may be carried out under pressurized CO2.22Fig. 9 presents a schematic view of this process, in which only the main operations are displayed.
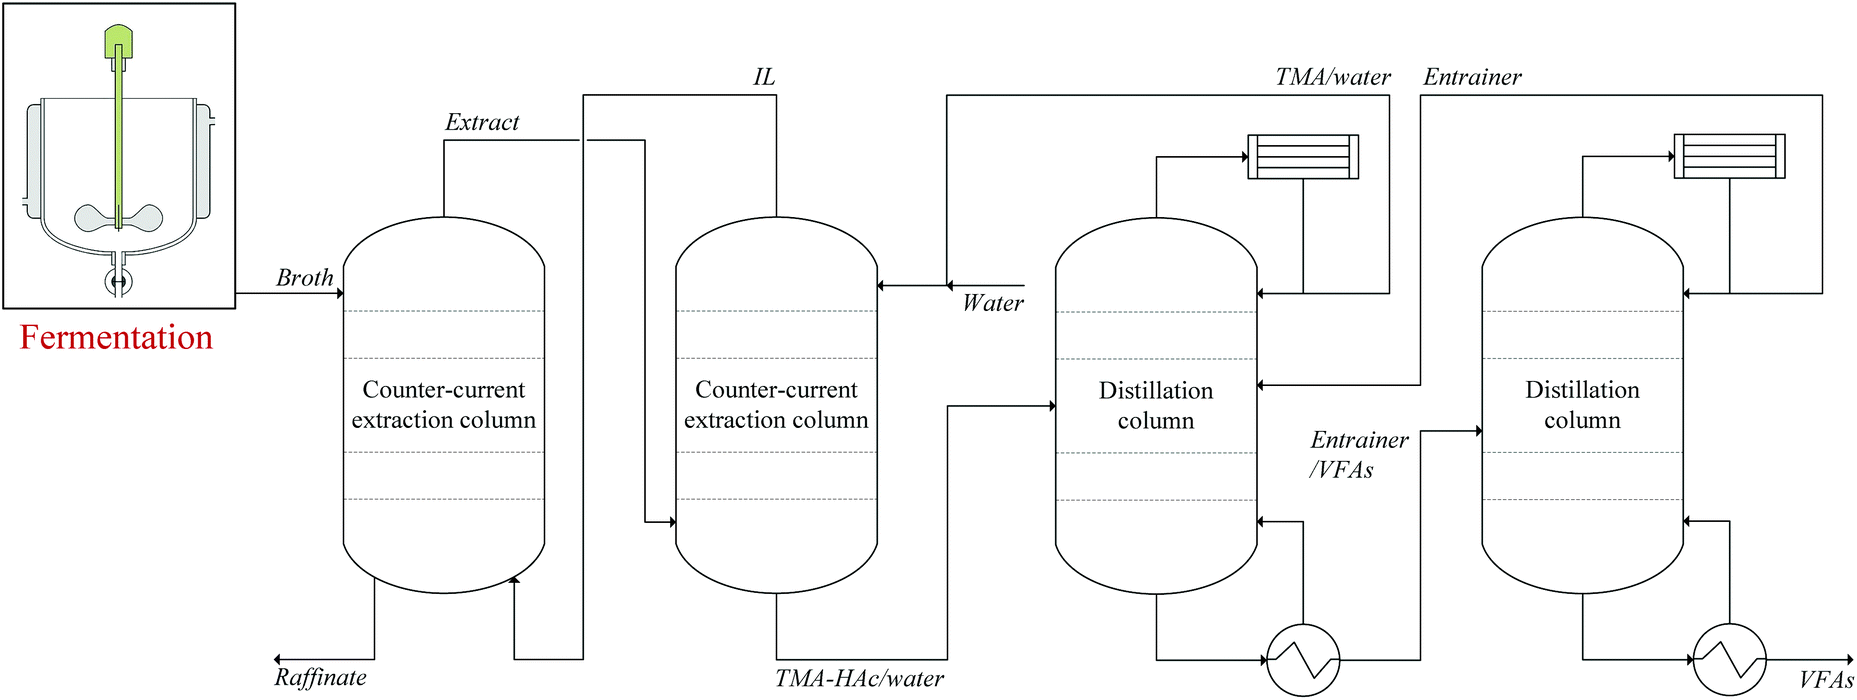 | ||
| Fig. 9 Scheme of LLX-based process for recovery of VFAs from fermented wastewater using [P666,14][Phos] as extraction solvent and TMA as back-extraction solvent. | ||
Key to green, sustainable LLX based recovery of VFAs is to keep the solvents [P666,14][Phos] and TMA in the system, for which in the simplified scheme shown in Fig. 9 no additional operations are displayed, but should be considered.
3.6. Regeneration followed by in-line catalytic ketonization
Having established that HAc can be removed from IL down to a Z of 1 by evaporation, the IL regeneration step can now be integrated with an in-line further valorization step. VFAs are valuable platform chemicals that can be converted to, e.g., mixed ketones. Gas-phase ketonization is well-established,34 with amphoteric reducible metal oxides, such as TiO2, typically being used as active and selective ketonization catalysts. The ketonization experiments were performed with an IL–HAc solution with Z = 6.6 by passing the liberated gaseous HAc over a fixed TiO2 bed at 375 °C. The catalytic ketonization results are given in Fig. 10a.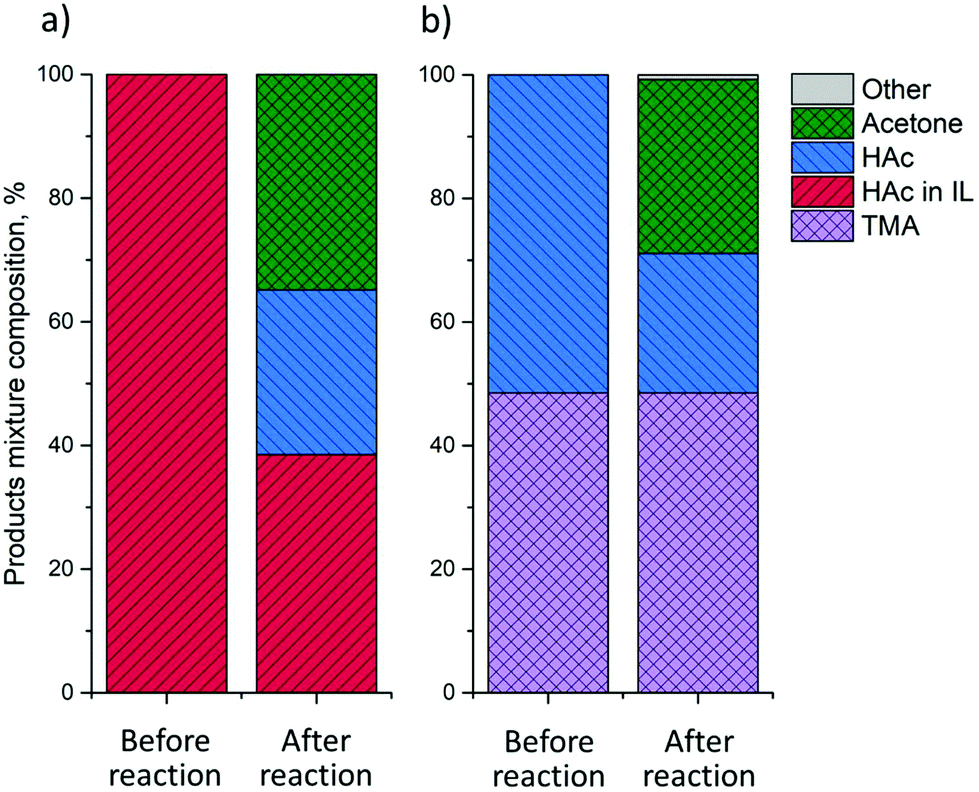 | ||
| Fig. 10 Ketonization over TiO2 P25 at 375 °C of HAc liberated from: (a) IL–HAc solution with Z = 6.6; (b) a TMA–HAc solution. | ||
Fig. 10a suggests that HAc evaporation from IL can indeed be successfully coupled to ketonization, with acetone being detected at a yield of 35%, based on initial HAc loading in IL. No other product was detected. However, given that only 60% of HAc can be liberated under these conditions, i.e. without vacuum, the yield based on liberated gaseous HAc is actually 57%.
As demonstrated in section 3.4, back extraction of HAc using aqueous volatile base allows for complete regeneration of the IL, making this the most attractive route for VFAs recovery. Therefore, in-line HAc conversion from a TMA–HAc solution was studied as well. Following the same procedure as in section 3.4, first, water was removed by evaporation at 100 °C leaving a viscous TMA–HAc liquid. Upon thermal decomposition at 150 °C liberated HAc and TMA were led over a fixed bed of TiO2 catalyst at 375 °C. The results presented in Fig. 10b show that around 55% of HAc was successfully converted to acetone at >97% selectivity and, importantly, that TMA could be completely recovered. These ketonization experiments already demonstrate that further-upgrading of waste-derived HAc is indeed possible and operating conditions were not further optimized. Conversion and ketonization yield can be maximized by changing the residence time over the catalyst, i.e. by optimization of the N2 flow rate.
4. Conclusions
Regeneration of acetic acid (HAc)-containing [P666,14][Phos] phases was studied to enable a sustainable extraction process for dilute aqueous HAc solutions and recover HAc as well as recycle [P666,14][Phos] for further extraction cycles. With evaporation of HAc at 130 °C and 40 mbar it was not possible to lower the HAc:IL molar ratio down to below 1:1. Extensive analysis with NMR and FT-IR suggested that (partial) deprotonation of HAc and very strong hydrogen bonding prevent evaporation of HAc below a stoichiometry of 1:1. The very strong hydrogen bonds also limited the reactive recovery of HAc through esterification with methanol inside the IL phase, it was not capable of regenerating the IL to HAc loadings of Z < 1 either. However, back-extraction of HAc from the IL phases with an aqueous solution of trimethylamine did prove successful, and complete IL regeneration was possible. Furthermore, through decomposition of HAc–TMA complexes, free HAc could be obtained. The amount of amine needed for this IL regeneration is tenfold less than the amount of amine required with traditional amine extractant systems. Calculations showed that this method can yield highly concentrated streams with up to 90 wt% HAc, while starting with a fermented wastewater as dilute as 1 wt%. In-line gas-phase catalytic ketonization showed that a selective conversion of the liberated HAc to acetone is possible at higher HAc loadings in the IL, providing a potential route produce higher value VFA-derived chemicals.
Nomenclature
| VFAs | Volatile fatty acids |
| HAc | Acetic acid |
| Ac− | Acetate |
| TOA | Trioctylamine |
| TMA | Trimethylamine |
| [P666,14][Phos] | Trihexyl(tetradecyl)phosphonium bis-2,4,4-(trimethylpentyl) phosphinate |
Conflicts of interest
There are no conflicts to declare.Acknowledgements
The authors acknowledge the financial support provided by NWO-TTW and Paques through the STW-Paques Program. Dr Peter de Peinder (UU) and Dr Christopher S. Lancefield (UU) are kindly acknowledged for helpful discussions on the IR and NMR analysis. The TAM III apparatus was financed in an ISPT project.References
- V. H. Agreda, Acetic Acid and its Derivatives, CRC Press, New York, 1992 Search PubMed.
- C. Le Berre, P. Serp, P. Kalck and G. P. Torrence, in Ullmann's Encyclopedia of Industrial Chemistry, Wiley-VCH Verlag GmbH & Co. KGaA, 2000, DOI:10.1002/14356007.a01_045.pub3.
- A. J. J. Straathof, Chem. Rev., 2014, 114, 1871–1908 CrossRef CAS PubMed.
- W. S. Lee, A. S. M. Chua, H. K. Yeoh and G. C. Ngoh, Chem. Eng. J., 2014, 235, 83–99 CrossRef CAS.
- T. I. M. Grootscholten, D. P. B. T. B. Strik, K. J. J. Steinbusch, C. J. N. Buisman and H. V. M. Hamelers, Appl. Energy, 2014, 116, 223–229 CrossRef CAS.
- D. Arslan, K. J. J. Steinbusch, L. Diels, H. V. M. Hamelers, D. P. B. T. B. Strik, C. J. N. Buisman and H. De Wever, Crit. Rev. Environ. Sci. Technol., 2016, 46, 592–634 CrossRef CAS.
- A. S. Kertes and C. J. King, Biotechnol. Bioeng., 1986, 28, 269–282 CrossRef CAS PubMed.
- C. S. López-Garzón and A. J. J. Straathof, Biotechnol. Adv., 2014, 32, 873–904 CrossRef PubMed.
- V. H. Shah, V. Pham, P. Larsen, S. Biswas and T. Frank, Ind. Eng. Chem. Res., 2016, 55, 1731–1739 CrossRef CAS.
- D. F. Othmer, US Patent2170834, 1939 Search PubMed.
- J. D. Seader, E. J. Henley and D. K. Roper, Separation Process Principles, John Wiley & Sons, 3rd edn, 2010 Search PubMed.
- M. Matsumoto, T. Otono and K. Kondo, Sep. Purif. Technol., 2001, 24, 337–342 CrossRef CAS.
- N. A. Mostafa, Energy Convers. Manage., 1999, 40, 1543–1553 CrossRef CAS.
- J. Marták and Š. Schlosser, Sep. Purif. Technol., 2007, 57, 483–494 CrossRef.
- F. S. Oliveira, J. M. M. Araújo, R. Ferreira, L. P. N. Rebelo and I. M. Marrucho, Sep. Purif. Technol., 2012, 85, 137–146 CrossRef CAS.
- K. Tonova, I. Svinyarov and M. G. Bogdanov, Sep. Purif. Technol., 2014, 125, 239–246 CrossRef CAS.
- G. Cevasco and C. Chiappe, Green Chem., 2014, 16, 2375–2385 RSC.
- E. Reyhanitash, B. Zaalberg, S. R. A. Kersten and B. Schuur, Sep. Purif. Technol., 2016, 161, 61–68 CrossRef CAS.
- S. Wang, J. Liu, R. Hembre, S. Barnicki, P. Goodrich, T.-L. Hughes, D. W. Rooney, C. Sink, J. Jacquemin and C. Hardacre, J. Chem. Eng. Data, 2017, 62, 653–664 CrossRef CAS.
- J. McFarlane, W. B. Ridenour, H. Luo, R. D. Hunt, D. W. DePaoli and R. X. Ren, Sep. Sci. Technol., 2005, 40, 1245–1265 CrossRef CAS.
- H. Zhao, S. Xia and P. Ma, J. Chem. Technol. Biotechnol., 2005, 80, 1089–1096 CrossRef CAS.
- E. Reyhanitash, B. Zaalberg, H. M. Ijmker, S. R. A. Kersten and B. Schuur, Green Chem., 2015, 17, 4393–4400 RSC.
- A. Krzyzaniak, B. Schuur and A. B. De Haan, Chem. Eng. Sci., 2014, 109, 236–243 CrossRef CAS.
- M. Blahušiak, Š. Schlosser, J. Cvengroš and J. Marták, Chem. Pap., 2011, 65, 603–607 Search PubMed.
- M. Blahušiak, Š. Schlosser and J. Cvengroš, Sep. Purif. Technol., 2012, 97, 186–194 CrossRef.
- A. M. Baniel, R. Blumberg and K. Hajdu, US Patent4275234, 1981 Search PubMed.
- S. T. Yang, US Patent8357519B2, 2013 Search PubMed.
- J. Merciér, US Patent4100189, 1978 Search PubMed.
- C. Kobler, D. Buss, A. Ronneburg and C. Weckbecker, US Patent20100210871A1, 2010 Search PubMed.
- C. J. King and S. M. Husson, US Patent5965771, 1999 Search PubMed.
- C. J. King and L. A. Tung, US Patent5132456, 1992 Search PubMed.
- J. McMorris and S. M. Husson, Sep. Sci. Technol., 2001, 36, 1129–1148 CrossRef CAS.
- S. Ren, Y. Hou, W. Wu and W. Liu, J. Chem. Eng. Data, 2010, 55, 5074–5077 CrossRef CAS.
- T. N. Pham, T. Sooknoi, S. P. Crossley and D. E. Resasco, ACS Catal., 2013, 3, 2456–2473 CrossRef CAS.
- J. N. A. Canongia Lopes and A. A. H. Pádua, J. Phys. Chem. B, 2006, 110, 3330–3335 CrossRef CAS PubMed.
- M. Blahušiak and Š. Schlosser, J. Chem. Thermodyn., 2014, 72, 54–64 CrossRef.
- C. R. López-Barrón, D. Li, L. DeRita, M. G. Basavaraj and N. J. Wagner, J. Am. Chem. Soc., 2012, 134, 20728–20732 CrossRef PubMed.
- K. Shimizu, M. F. Costa Gomes, A. A. H. Pádua, L. P. N. Rebelo and J. N. Canongia Lopes, J. Mol. Struct.: THEOCHEM, 2010, 946, 70–76 CrossRef CAS.
- A. S. Kashin, K. I. Galkin, E. A. Khokhlova and V. P. Ananikov, Angew. Chem., Int. Ed., 2016, 55, 2161–2166 CrossRef CAS PubMed.
- J. Marták and Š. Schlosser, J. Chem. Eng. Data, 2016, 61, 2979–2996 CrossRef.
- J. Marták and Š. Schlosser, Chem. Pap., 2008, 62, 42–50 Search PubMed.
- C. J. Bradaric, A. Downard, C. Kennedy, A. J. Robertson and Y. Zhou, Green Chem., 2003, 5, 143–152 RSC.
- D. Cholico-Gonzalez, M. Avila-Rodriguez, G. Cote and A. Chagnes, J. Mol. Liq., 2013, 187, 165–170 CrossRef CAS.
- M. S. Markoulides and A. C. Regan, Org. Biomol. Chem., 2013, 11, 119–129 RSC.
- J. Marták and Š. Schlosser, J. Chem. Eng. Data, 2017, 62, 3025–3035 CrossRef.
- R. A. Nyquist, Interpreting Infrared, Raman, and Nuclear Magnetic Resonance Spectra, Academic Press, 2001 Search PubMed.
- L. J. Bellamy, The Infrared Spectra of Complex Molecules, Chapman and Hall, London, 1975 Search PubMed.
- N. B. Colthup, L. H. Daly and S. E. Wiberley, Introduction to Infrared and Raman Spectroscopy, Academic Press, 3rd edn, 1964 Search PubMed.
- A. M. Modro and T. A. Modro, Can. J. Chem., 1999, 77, 890–894 CrossRef CAS.
- G. Socrates, Infrared and Raman Characteristic Group Frequencie. Tables and Charts, Wiley, Chichester, 2001 Search PubMed.
- L. J. Bellamy, The Infrared Spectra of Complex Molecules. Volume Two: Advances in Infrared Group Frequencies, Chapman and Hall, London, 1968 Search PubMed.
- I. Fischmeister, Spectrochim. Acta, 1964, 20, 1071–1079 CrossRef CAS.
- T. Eggeman and D. Verser, Appl. Biochem. Biotechnol., 2005, 122, 605–618 CrossRef.
- M. Mekala and V. R. Goli, Asia – Pac. J. Chem. Eng., 2014, 9, 791–799 CrossRef CAS.
- S. R. Sandler and W. Karo, Sourcebook of advanced organic laboratory preparations, Academic Press, 2012 Search PubMed.
Footnote |
| † Electronic supplementary information (ESI) available. See DOI: 10.1039/c9gc00725c |
| This journal is © The Royal Society of Chemistry 2019 |