Electrosynthesis of 2,3-butanediol and methyl ethyl ketone from acetoin in flow cells†‡
José R.
Ochoa-Gómez
 *a,
Francisco
Fernández-Carretero
 a,
Francisca
Río-Pérez
 b,
Alberto
García-Luis
 a,
Tomás
Roncal
 a and
Eduardo J.
García-Suárez
 a
a
aTecnalia R&I, Parque Tecnológico de Álava, Leonardo da Vinci 11, 01510 Miñano, Spain. E-mail: jramon.ochoa@tecnalia.com
bBiokemik, Parque Científico y tecnológico de Bizkaia, Astondo Bidea Ed. 612, 48160 Derio, Spain. E-mail: paqui.rio@biokemik.eu
First published on 28th November 2018
Abstract
Acetoin could shortly become a platform molecule due to current progress in fermentation technology, the megatrend for shifting from an oil-based economy to the one based on biomass, the quest for green manufacturing processes and its two highly reactive carbonyl and hydroxyl moieties. In this paper, the successful electro-conversion of acetoin into two valuable chemicals, 2,3-butanediol (2,3-BD) and methyl ethyl ketone (MEK), at a constant electrical current in an aqueous phase at room temperature using both divided and undivided 20 cm2 filter-press flow cells under experimental conditions suitable for industrial production is reported. Cathode material is the key parameter to drive the electroreduction towards one or another chemical. 2,3-BD is the major chemical produced by electrohydrogenation when low hydrogen overvoltage cathodes, such as Pt and Ni, of high surface areas obtained by PVD coating on a carbon gas diffusion layer are used, while MEK is the principal product produced by electrohydrogenolysis when high hydrogen overvoltage cathodes, such as graphite, Pb and Cd foils, are employed. 2,3-BD and MEK can be obtained, respectively, in 92.8% and 85.7% selectivities, 71.7% and 80.4% current efficiencies, with 1.21 and 1.08 kg h−1 m−2 productivities and power consumptions of 2.94 and 4.1 kWh kg−1 using undivided cells and aqueous K2HPO4 electrolysis media at pH values of 3.6 and 5.5. The reported electroconversion of acetoin is highly flexible because 2,3-BD and MEK can be produced by changing just the cathode but using the same cell, with the same electrolyte at the same current density.
Introduction
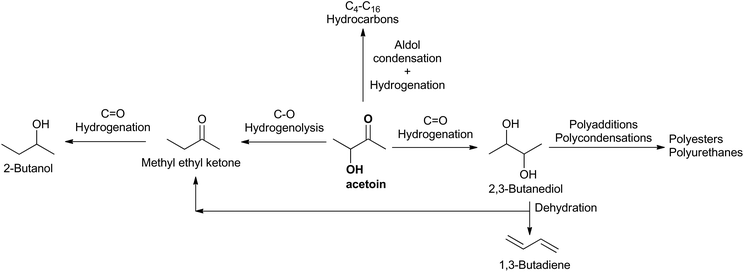
Acetoin (3-hydroxy-2-butanone) is currently a fine chemical used in foods and cosmetics as a flavoring agent. Its reactive carbonyl and hydroxyl moieties, together with its biomass origin, led to the NREL of the U.S. Department of Energy to classify acetoin as one of the 30 potential platform chemicals for a biobased economy in 2004.1 As an example, some chemicals that could be obtained from acetoin are depicted in Scheme 1. However, since then two barriers have prevented its general use as a platform chemical: its high price, ranging between 6 $ kg−1 for synthetic acetoin and 10 $ kg−1 for natural acetoin, and the lack of effective processes to produce high-volume-acetoin-derived chemicals to act as a driving force for increasing its production, a key issue to reducing its price.The first barrier has been overcome by means of new very effective fermentation processes,2 and highly efficient downstream procedures for acetoin recovery.3 Thus, our group has developed a fermentation process to acetoin using the newly isolated non-pathogenic Risk Group 1 (and GRAS, Generally Recognized As Safe) mutant strain Lactococcus lactis subsp. lactis CML B4 and glucose as the carbon source.4 Acetoin titers of 59 g L−1 and productivities exceeding 2 g L−1 h−1, the highest ever reported among non-pathogenic bacteria, are obtained. As far as we know, this productivity is only surpassed by Enterobacter cloacae,4 which is classified as a Risk Group 2 (RG2) pathogenic bacterium, similar to Serratia marcescens, another acetoin producer with productivities close to 2 g L−1 h−1. Pathogenic bacteria increase the production costs due to the strict biosafety and containment requirements.
The second barrier is being continuously and strongly weakened by some market disturbances and world megatrends. Thus, in the last few years a disturbance in the huge 1,3-butadiene (BDE) market has been occurring. BDE is currently key to manufacture synthetic rubber for tires. It has been a co-product in the ethylene production by steam cracking of naphtha, but crackers are shifting the raw material from naphtha to ethane,5 resulting in a BDE yield drop from about 16 to 2 kg per 100 kg of ethylene. Therefore, a shortage in the BDE supply is expected, and consequently new on-purpose processes to BDE are being developed.6 Moreover, sustainability is a strong and unstoppable current megatrend requiring the use of renewable resources in production processes. Therefore, it is understandable that one of the new on-purpose BDE processes more studied is the catalytic dehydration of 2,3-butanediol (2,3-BD), for which yields as high as 91.9% have been reported.7
2,3-BD is an oil-derived chemical with a potentially high volume market for manufacturing polyesters and polyurethanes provided its manufacturing cost is reduced, which can be done by glucose fermentation.8–12 Another economically efficient approach developed through the collaboration of Tecnalia and Biokemik is the catalytic hydrogenation of biomass-derived acetoin both under batch13 and continuous conditions.14 Using a carbon-supported ruthenium catalyst, yields higher than 99% are obtained in both cases, with productivities suitable for large production plants. However, the use of hydrogen as a reactant makes them unsuitable for small production plants in which the construction of an in situ hydrogen production facility by the steam reforming of natural gas is not economically feasible.
Organic electrosynthesis provides a green and economically feasible solution. As reported by Frontana-Uribe et al.,15 “…organic electrosynthesis has become recognized as one of the methodologies to develop environmentally compatible processes. It can be used to replace toxic or dangerous oxidizing or reducing reagents, reduce energy consumption, and can be used for the in situ production of unstable and hazardous reagents...”. For electrohydrogenations, as that of acetoin into 2,3-BD, hydrogen is cathodically generated in situ at ambient pressure and temperature through the electroreduction of water or protons present in the reaction medium, and it is simultaneously consumed during electrolysis. This inherent characteristic of electrohydrogenations paves the way for performing hydrogenations in an economically and safe manner in both large and small production plants.
Fedoroňko et al.16 showed that acetoin could be polarographically electroreduced to 2,3-BD and methyl ethyl ketone (MEK) but, their work, while important for analytical chemistry, has little interest for synthetic purposes. As far as we know, the only paper valuable for synthetic purposes is that of the great organic electrochemist M. M. Baizer.17 He and his coworkers developed a process for converting 2,3-BD in aqueous solution to MEK at room temperature and pH 7 by passing it through a porous graphite anode at which it was oxidized to acetoin in the electrolyte by anodically electrogenerated NaBrO from NaBr, and then pumping to a porous cathode (Pb/Hg or Zn/Hg) at which acetoin was reduced to MEK. The overall current yield for 2,3-BD conversion into MEK was 45%.
This process is an interesting example of a combination of indirect electrosynthesis leading to acetoin and a paired electrosynthesis leading to a chemical (MEK) with a large market as a solvent. However, it has no industrial feasibility due to its very low current density of 20 A m−2, far below the useful industrial one ranging from 500–1000 A m−2 to 5000 A m−2. Additionally, Baizer et al. stated that working above 20 A m−2 caused more H2 evolution resulting in poor current efficiency. Therefore, the process of Baizer et al. results in very poor specific productivities (kg h m−2) requiring a huge capital investment. Additional strong drawbacks from an environmental standpoint are that Hg-based cathodes are used and the presence of NaBrO within the electrolyzed solution.
In this paper, the direct batch electro-conversion of acetoin into 2,3-BD (eqn (1)) and MEK (eqn (2)) at a constant electrical current in the aqueous phase at room temperature using filter-press flow cells is reported.
| C4H8O2 + 2e− + 2H+ → C4H10O2 | (1) |
| C4H8O2 + 2e− + 2H+ → C4H8O + H2O | (2) |
The influence of cathode nature, electrolyte, pH, cell type (divided or undivided), acetoin concentration, current density and circulated electric charge is studied. The challenge is to develop industrially feasible green electroreduction processes for 2,3-BD and MEK production. Whenever possible, this requires working under the following conditions: (a) Use of an undivided cell instead of a divided one provided the usual decrease in current yield is counterbalanced by the decrease in power consumption; (b) use of water as a solvent; (c) working at ambient pressure and temperature; (d) current densities ≥1000 A m−2. If properly handled all these conditions lead to lower CAPEX and OPEX as well as to a safer process.
Results and discussion
Cathode influence and reaction mechanisms
When in an electrosynthesis carried out in aqueous media the anodic reaction has no synthetic interest, as is the case of the present work, the choice of the anode material is in most cases obvious: a low oxygen overvoltage anode for both divided and undivided cells. In the first case to decrease the power consumption while in the second one also to avoid or minimize the anodic electrooxidation of both the substrate and the target chemical obtained in the cathode. Therefore, a low oxygen overvoltage DSA®-O2 anode based on iridium oxide supported on titanium has been used in all experiments reported herein.The results obtained with different cathode materials in both undivided and divided cells are given in Table 1 under the experimental conditions reported therein. Reported cathodes can be classified into low hydrogen overvoltage (LHO) cathodes (entries 1–7) and high hydrogen overvoltage (HHO) cathodes (entries 8–14) with hydrogen overvoltages being reported by Popp and Schultz.18 As can be seen LHO cathodes lead to a high 2,3-BD selectivity while selectivity moves towards MEK when HHO cathodes are used. LHO cathodes studied are based on Pt and Ni, typical hydrogenation catalysts, which explains that 2,3-BD is the main chemical resultant as 2,3-BD is obtained by hydrogenation of the carbonyl moiety of acetoin. In contrast, electroreduction to MEK involves the hydrogenolysis of the C–O bond of the C–OH moiety which requires that the applied electrical energy is used in breaking the C–O bond instead of electrogenerating hydrogen. Consequently, HHO cathodes are required to obtain MEK by preventing or minimizing hydrogen electrogeneration from water or protons in an acidic medium because in the presence of hydrogen the reduction of the carbonyl group is favored relative to that of the hydroxyl one, as shown by us.13 We reported the selective reduction of acetoin to 2,3-BD by hydrogenation using pressures up to 5 MPa and temperatures up to 125 °C. No MEK was found.
| Entry# | Cell | ECa | Cathode | C (%) = εactb (%) | S 2,3-BD (%) | S MEK (%) | S 2-BuOH (%) | H2 overvoltage (V) |
|---|---|---|---|---|---|---|---|---|
| a Experimental conditions: A: 1000 A m−2, anode: DSA-O2, electrolyte: 5 wt% KH2PO4 + 100 g L−1 acetoin, room temperature, electric charge: 100% of theoretical one = 2 F mol−1 of acetoin; B: 1500 A m−2, anode: DSA-O2, anolyte: 5 wt% aqueous sulfuric acid, Nafion 324 membrane, catholyte: 5 wt% KH2PO4 adjusted at pH 5.5 with 20 wt% KOH + 100 g L−1 acetoin, room temperature, electric charge: 100% of the theoretical one. b Acetoin conversion matches the acetoin current efficiency because the electric charge used was the theoretical one: 2 F mol−1 of acetoin. c Undivided cell. d Divided cell. e GDL: porous gas diffusion layer Sigracet® 24-BC. | ||||||||
| 1 | Uc | A | Pt/Ti (sheet) | 29.9 | 52.4 | — | — | 0.29 |
| 2 | U | A | Ni (sheet) | 50.2 | 34.8 | — | — | 0.56 |
| 3 | U | A | Pt-30/GDL | 33.7 | 59.2 | — | — | 0.29 |
| 4 | U | A | Pt3Co-30/GDLe | 45.7 | 62.8 | — | — | 0.29 (Pt) |
| 5 | U | A | Pt3Ni-30/GDL | 49.9 | 60.3 | — | — | 0.29 (Pt)-0.56 (Ni) |
| 6 | U | A | Pt-47/GDL | 57.9 | 74.7 | — | — | 0.29 |
| 7 | U | A | PtOx-80/GDL | 69.0 | 74.6 | — | — | 0.29 (Pt) |
| 8 | U | A | GDL | 75.6 | 9.0 | 64.2 | — | 0.77 |
| 9 | Dd | B | GDL | 74.1 | 11.0 | 74.1 | 6.5 | 0.77 |
| 10 | D | B | RVC-4000 | 77.8 | 8.3 | 68.2 | 2.1 | 0.77 |
| 11 | D | B | Graphite (sheet) | 65.6 | 17.6 | 73.0 | 2.0 | 0.77 |
| 12 | D | B | Zn | 88.1 | 30.4 | 49.7 | 6.5 | 0.94 |
| 13 | D | B | Pb | 74.3 | 9.7 | 77.2 | 3.2 | 1.0 |
| 14 | D | B | Cd | 91.8 | 16.6 | 55.4 | 7.9 | 1.22 |
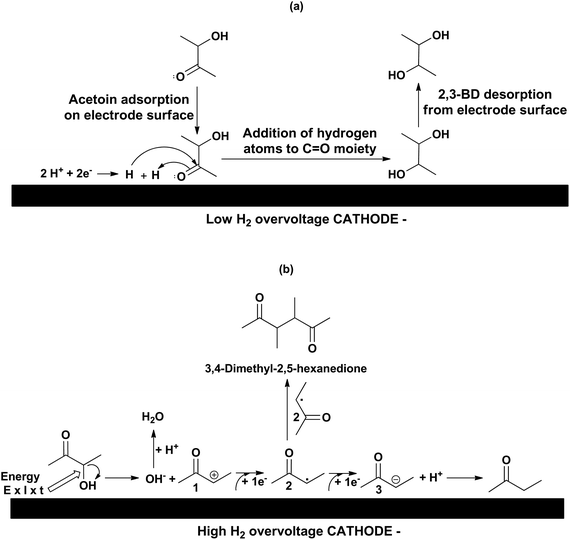
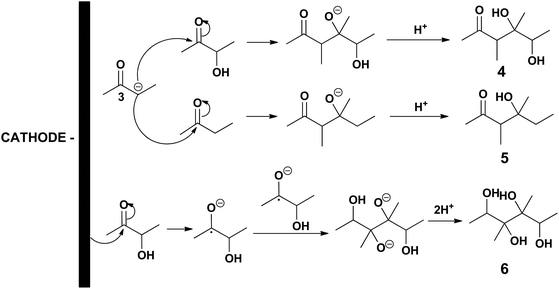
The reaction mechanisms leading to 2,3-BD and MEK are depicted in Scheme 2(a) and (b), respectively. The electro-conversion of acetoin into 2,3-BD using LHO metal cathodes is an electrohydrogenation whose mechanism involves hydrogen electrogeneration and reaction between the nascent hydrogen atoms and substrate both adsorbed onto the electrode surface.19 In the acidic medium used, the first step of the reaction pathway is the electroreduction of protons to hydrogen. The nascent hydrogen is adsorbed and dissociated onto the catalytic metal cathodic surface while an acetoin molecule is also adsorbed onto the metal surface. Then, the hydrogen atom with a positive charge density adds to the oxygen atom of the carbonyl group in acetoin activating the carbon atom of the said group. Next, the hydrogen atom with a negative charge density attacks the carbon atom of the carbonyl moiety leading to 2,3-BD which is subsequently desorbed from the electrode surface. However, when HHO cathodes are used, the electroreduction mechanism corresponds to a hydrogenolysis. The electrical energy supplied via the cathode is not used in producing hydrogen because the applied cathode potential is below that needed for hydrogen evolution. Instead, the carbon–oxygen bond is broken leading to one hydroxyl ion and a carbocation 1 which takes an electron to be converted into the radical 2 which, after taking another electron, is converted into the carbanion 3, which eventually reacts with a proton in the acidic medium resulting in MEK formation. Evidence of this mechanism is provided by the fact that 3,4-dimethyl-2,5-hexanedione was detected by GC-MS (see Fig. S1 in ESI‡), which can only be obtained by a coupling of two radicals 2. The formation of 2-butanol detected in most reactions is a result of MEK electrohydrogenation.
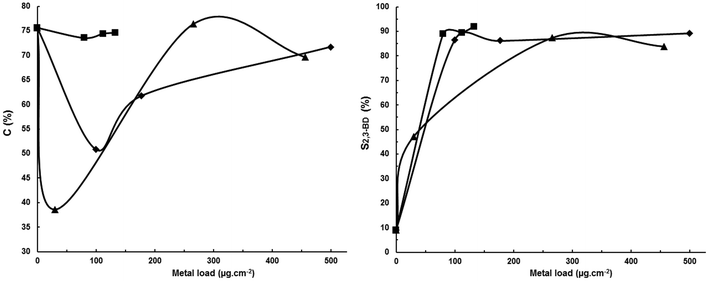
Regarding the LHO cathodes (entries 1–7) it can be observed that the use of bidimensional (flat sheet) Pt and Ni (entries 1 and 2) leads to poor acetoin current efficiencies as shown by the low conversions of 29.9% and 50.2%, respectively, as well as low selectivities to 2,3-BD, mainly with Ni due to its higher hydrogen overvoltage than Pt which increases the electrode potential window for electroreducing acetoin to chemicals other than 2,3-BD. According to the results reported in Table 1 for HHO cathodes (entries 8–14) presumably MEK is the other main chemical produced. The low conversions obtained mean that energy is being wasted in producing hydrogen. This can be avoided or minimized by decreasing the current density, i.e. by decreasing the current intensity, but this results in a decreased productivity and, therefore, in an increased CAPEX. A typical way for overcoming this problem is to use porous materials to increase the electrode surface area while keeping constant the geometric one. In this way, it is possible to decrease the actual current density while working at the same current intensity, i.e. which in turn leads to a lower cathode potential resulting in a lower hydrogen current yield favoring a higher substrate conversion and product selectivity. Thus, in entries 3–7 Pt, Ni and mixtures of Pt–Co and Pt–Ni were deposited by physical vapor deposition on a porous gas diffusion layer (Sigracet® GDL-24BC) as described in the Experimental section. In entry 7 platinum oxide was deposited on GDL but it is reduced to Pt during electrolysis. As can be seen, these so-called decorated cathodes lead to an increase in both acetoin conversion and 2,3-BD selectivity with both values increasing as the metal load increases. Thus, a metal load of 30 μg cm−2 (entry 3) can be considered as the threshold load for improving the cathode efficiency because both conversion and 2,3-BD selectivity increase slightly relative to a Pt bidimensional cathode (entry 1). Above a load of 30 μg cm−2 both conversion and selectivity increase (entries 6 and 7) reaching values as high as 69.0% and 74.6%, respectively, at a load of 80 μg cm−2. This increase must be ascribed to the noble metal deposition on the porous GDL support and not to the support porosity as shown by the results in entry 8 in which, although a high 75.6% acetoin conversion is reached, a low 9.0% 2,3-BD selectivity is obtained with MEK being the main product.
Regarding the HHO cathodes (entries 8–14) studied, they can be divided into porous (entries 8–10) and non-porous (entries 11–14) cathodes. All porous cathodes are based on carbon. There is no appreciable difference among them with respect to both acetoin conversions and MEK selectivities. The higher selectivity obtained in entry 9 relative to entry 8 must be ascribed to the use of a divided cell which prevents MEK anodic oxidation. However, in comparison with a non-porous material of the same chemical composition such as graphite (entry 11) using the same type of divided cell, conversions are about 10 points higher while selectivities to MEK are similar (selectivities of 74.1, 68.2 and 73.0% for entries 9, 10 and 11, respectively, are within the analytical experimental error; the mean value is 71.8% with a standard deviation of 3.1%). The reduced cathode potentials in porous electrodes in comparison with sheet electrodes at the same current intensity explain the higher conversions obtained with the former electrodes. Acetoin electroreduction is favored relative to proton electroreduction to hydrogen.
On the other hand, with non-porous flat electrodes of increasing hydrogen overvoltage there is a clear correlation between acetoin conversion and H2 overvoltage. The former increases when the latter increases except for Zn. The higher conversion with Zn than with Pb despite its lower H2 overvoltage can be attributed to the fact that Zn is a well-known reducing agent while Pb and Cd are not. The use of Zn as a catalyst in the reduction of ketones to alcohols has been reported.20–22 Therefore, Zn can have a dual behavior in the electroreduction of acetoin acting both as a hydrogenation cathode due to its hydrogenation catalytic activity and as a hydrogenolysis cathode thanks to its high hydrogen overvoltage. This dual behavior of Zn can explain the higher acetoin conversion which is equal to that with a Cd cathode (entry 14), the material with the highest hydrogen overvoltage, and at the same time the high 30.4% 2,3-BD selectivity in comparison with the other HHO sheet cathodes. MEK selectivity increases from graphite to lead and then decreases sharply with Cd, most probably because its high hydrogen overpotential favors acetoin reduction to other chemicals. This explains both the 7.9% 2-butanol (obtained by MEK electroreduction in a two-electron process) selectivity which is the highest of the whole series, and the sum of 2,3-BD, MEK and 2-BuOH selectivities (79.9% while values of 92.6%, 86.6% and 90.1% are obtained for graphite, Zn and Pb, respectively) which is the lowest of the whole series. Cd leads to a higher number of unidentified chemicals. Pb leads to the best results for MEK electrosynthesis based on MEK selectivity providing also a good acetoin conversion, while Cd results in the best results based on acetoin conversion although with a low MEK selectivity. However, the high 91.8% current efficiency for acetoin conversion obtained with Cd supports further studies with this material to determine whether under other experimental conditions MEK selectivity can be significantly enhanced or not.
Accordingly, porous LHO cathodes based on Pt and PtOx were used for studying the 2,3-BD electrosynthesis while HHO cathodes based on Pb and Cd were employed for studying the MEK electrosynthesis.
Electrosynthesis of 2,3-BD
It is obvious that during electrolysis PtOx is reduced to Pt(0) by nascent hydrogen as shown by the results obtained by EDX (see Table S1 in the ESI‡) in which the oxygen content decreased from 23.02% in the PtOx-GDL-24BC as deposited to 0% after electrohydrogenation. Therefore, the process is that of the activation of Adams's catalyst, PtO2, which is reported to lead to Pt(0) nanoparticles of about 3 nm.26,27 This small particle size explains the good performance of the PtOx/GDL-24BC relative to the other herein reported decorated porous cathodes because it leads to an increase of the actual electrode surface area and therefore to a decrease in the actual current density which, in turn, causes a decrease in the cathode potential favoring the acetoin electrohydrogenation to 2,3-BD. This conclusion is also supported by the fact that PtOx deposited by PVD on GDL-24BC shows a dendritic structure (see Fig. S2 in the ESI‡) which is held after electrohydrogenation to Pt as shown by SEM (see Fig. S3 in the ESI‡). This dendritic structure leading to a high surface area has been previously reported by Zhensheng et al.28 and Yamada et al.29 for Adam's catalyst. These last authors have shown that a Pt catalyst film with a dendritic microcrystalline structure prepared by reducing PtO2 deposited by reactive sputtering onto a gas diffusion layer shows a superior performance as a cathode catalyst of a polymer electrolyte fuel cell compared to a conventional sputtered Pt film, with the activity based on the unit of the electrochemical surface of the dendritic Pt being higher than that of conventionally sputtered Pt in which the agglomeration of large sphere-like Pt particles is observed.
On the other hand, it has been reported that platinum minimizes the hydrogenolysis of functional groups such as alcohols,30 which can also explain the high 90–92% selectivities obtained with both PtOx and Pt at low loads.
Electrosynthesis of MEK
| Entry# | pH | C (%) = εacetb (%) | ε MEK (%) | S MEK (%) | S 2,3-BD (%) | S 2-BuOH (%) |
|---|---|---|---|---|---|---|
| a Experimental conditions: A divided cell fitted with a DSA-O2 anode, a Nafion 324 cation exchange membrane and a Pb cathode; anolyte: aqueous 5 wt% H2SO4; catholyte: aqueous 5 wt% KH2PO4/100 g L−1 acetoin solution adjusted to the corresponding pH with diluted H3PO4 or KOH; 100 Qt%; 1500 A m−2; room temperature. b Acetoin conversion matches the acetoin current efficiency because the electric charge used was the theoretical one: 2 F mol−1 of acetoin. | ||||||
| 15 | 3.10 | 78.4 | 50.6 | 70.4 | 7.8 | 2.5 |
| 16 | 4.10 | 71.0 | 53.1 | 74.9 | 10.3 | 0.0 |
| 13 | 5.50 | 74.3 | 57.3 | 77.2 | 9.7 | 3.2 |
| 17 | 7.00 | 77.1 | 54.3 | 70.4 | 12.0 | 4.5 |
| Entry# | QAS | C (%) = εacetb (%) | ε MEK (%) | S MEK (%) | S 2,3-BD (%) | S 2-BuOH (%) |
|---|---|---|---|---|---|---|
| a Experimental conditions: A divided cell fitted with a DSA-O2 anode, a Nafion 324 cation exchange membrane and a Pb cathode; anolyte: aqueous 5 wt% H2SO4; catholyte: aqueous 0.5 wt% QAS/5 wt% KH2PO4/100 g L−1 acetoin; average reaction pH: 4.10–4.27; 100 Qt%; 1500 A m−2; room temperature. b Acetoin conversion matches the acetoin current efficiency because the electric charge used was the theoretical one: 2 F mol−1 of acetoin. | ||||||
| 16 | None | 71.0 | 53.1 | 74.9 | 10.3 | 0.0 |
| 18 | TEABr | 84.2 | 54.3 | 64.5 | 12.9 | 4.6 |
| 19 | TBABr | 87.8 | 49.7 | 56.6 | 24.4 | 6.8 |
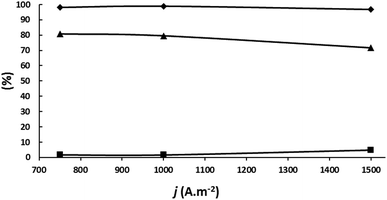
The results can be explained based on the much higher hydrogen overpotential of Cd compared to Pb. This allows one to obtain a high 92% constant current efficiency for acetoin conversion in the current density range studied but since the cathode potential increases with current density, and hence the cathode reduction power, the MEK selectivity decreases continuously at the expense of the increase in 2,3-BD and 2-BuOH selectivities. For Pb, however, with a much lower hydrogen overvoltage than Cd, above 1000 A m−2 the electricity is increasingly used in hydrogen generation as shown by the strong decrease in acetoin conversion above that current density. The reduction power of Pb does not increase above 1000 A m−2 because at this current density the cathode potential matches or it is close to the lead hydrogen overpotential. In other words, the hydrogen electrogeneration “protects” acetoin and MEK from being converted into 2,3-BD and 2-BuOH, respectively, leading to a constant MEK selectivity in the current density interval studied. Therefore, Pb is the more suitable cathode for this electrosynthesis for working at current densities required at the industrial level.
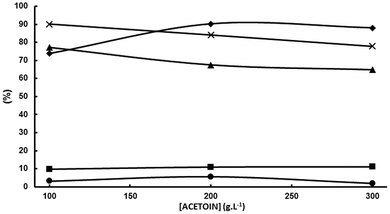
This means that chemicals other than MEK, 2,3-BD and 2-BuOH are being formed in increasing yields as the initial acetoin concentration increases which is confirmed by means of the sum of MEK, 2,3-BD and 2-BuOH selectivities which decreases from 90.1% at 100 g L−1 to 84.1% at 200 g L−1, and to 77.9% at 300 g L−1. As previously mentioned one of these chemicals was 3,4-dimethyl-2,5-hexanedione (see Scheme 2). When the initial acetoin concentration increases the average concentrations of species such as 2 and 3 in Scheme 2b also increase during the electrolysis, as well as that of MEK. This fact would favor coupling reactions such as coupling of two radicals 2 to yield 3,4-dimethyl-2,5-hexanedione, and coupling of the carbanion 3 with the ketone moieties of acetoin and MEK leading to the pinacol 4 and the beta-hydroxyketone 5, respectively, as shown in Scheme 3. Another possibility is that the enhanced acetoin concentration favors the formation of 6 through the well-known electroreduction mechanism of ketones leading to pinacols, also shown in Scheme 3. The formation of pinacols in an acidic medium by electrochemical reductive coupling of ketones and aldehydes is a long time known reaction.37–41 GC-MS analysis was only carried out in one reaction with a low sum of acetoin, MEK and 2-BuOH selectivities and the only byproduct detected with a significant area was 2. However, the GC-MS was carried out after the extraction of the aqueous catholyte with dichloromethane so that the highly hydrophilic alcoholic species 4, 5 and 6 could very likely not be extracted.
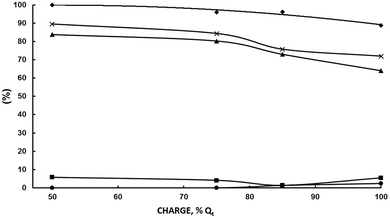
Working at the highest possible concentration is industrially highly desirable. MEK selectivity decreases from 77% at 100 g L−1 of acetoin to 67.5% at 200 g L−1. The decrease is significant, but not dramatic, mainly because the decrease in selectivity is caused by the increase in acetoin conversion with its initial concentration and not by a decrease in MEK current efficiency. In fact, εMEK increases slightly from 57.3% at 100 g L−1 of acetoin to 60.9% at 200 g L−1. If the above hypothesis is correct, a way of increasing both MEK selectivity and MEK current efficiency by minimizing some of the above cited side reactions would be to keep the MEK concentration in the catholyte below a threshold value. At first, this can be done by stopping the electrolysis when an electrical charge below the theoretical one for full acetoin conversion has been circulated. Variations of acetoin current efficiency, selectivities and the sum of selectivities as a function of the circulated electric charge for an initial acetoin concentration of 200 g L−1 in a divided cell fitted with a Pb cathode are plotted in Fig. 6 under the experimental conditions given in the legend.
The only difference relative to the experimental conditions for the results depicted in Fig. 5 is that the KH2PO4 concentration was doubled to decrease the cell voltage and hence power consumption. Some herein not reported comparative experiments at both concentrations showed that this increase in the supporting electrolyte concentration had no influence on the results.
As can be seen, εMEK is above 96% up to 85 Qt% and then decreases to 88.7% at 100 Qt%. Likewise, SMEK and the sum of MEK, 2,3-BD and 2-BuOH selectivities remain high up to 75 Qt% (80.3% and 84.3%, respectively) and then decrease quickly up to values of 64.1% and 72%, confirming the above hypothesis. εMEK at 75 Qt% was 77% and 56.8% at 100 Qt%. That is, the negative effect of increasing the initial acetoin concentration from 100 to 200 g L−1 can be overcome by decreasing the circulated charge from 100% to 75 Qt% leading to better results. A comparison between the results under these concentration-charge conditions is given in Table 4. It can be seen how by decreasing the circulated charge to 75 Qt% at 200 g L−1 of acetoin, the MEK current efficiency, MEK selectivity and MEK productivity are higher than those obtained at 200 and 100 g L−1 for a 100 Qt%. Even, results are improved by decreasing the charge to 50 Qt% but the MEK final concentration, although higher than that at 100 g L−1 and 100 Qt%, is lower than that obtained at 200 g L−1 and 75 Qt%. A MEK concentration of 95–100 g L−1 appears as the maximum one to achieve a good selectivity and current efficiency. Above it, side reactions become increasingly important. The absence of 2-BuOH, the product of MEK electroreduction, below 75 Qt% confirms this statement.
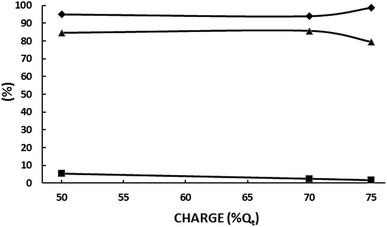
A new set of experiments were carried out to determine if the results could be improved at 1000 A m−2 by decreasing slightly the circulated charge under the other experimental conditions given in the legend of Fig. 7. The results are plotted in Fig. 8. 2-BuOH was not detected. As can be seen, SMEK increases up to 85.7% at 70 Qt% confirming the above conclusion that a careful adjustment of the circulated charge can decrease side reactions significantly.
A comparison of the best results in both types of cells is given in Table 5. Although a higher MEK productivity is obtained in a divided cell at 1500 A m−2, the higher MEK current efficiency and MEK selectivity together with 41.4% lower power consumption at 1000 A m−2 and the simplicity of an undivided cell compared to a divided one makes the undivided cell configuration a better choice for industrial upscaling.
| Divided | Undivided | |
|---|---|---|
| a Difference in the experimental conditions between divided and undivided cells was because the former was fitted with a Nafion 324 cation exchange membrane to separate the anolyte from the catholyte, and the anolyte was a 5 wt% sulfuric acid aqueous solution. The rest of the conditions were the same for both cells: anode: DSA-O2; cathode: Pb; electrolyte (catholyte for a divided cell): aqueous 10 wt% KH2PO4 adjusted at pH 5.5 with aqueous 20 wt% KOH; room temperature; interelectrode gap: 8 mm for an undivided cell and 17 mm for a divided one. b Calculated for a typical industrial interelectrode gap of 4.25 mm and 2 mm for divided and undivided cells, respectively. | ||
| j (A m−2) | 1500 | 1000 |
| Electrical charge (Qt%) | 75 | 70 |
| C (%) | 72 | 65.8 |
| ε MEK (%) | 77.0 | 80.4 |
| S MEK (%) | 80.3 | 85.7 |
| Average voltageb (V) | 6.0 | 4.5 |
| MEK productivity (kg h−1 m−2) | 1.55 | 1.08 |
| Power consumptionb (kWh kg−1) | 5.8 | 4.1 |
| Entry# | Anode | EDTA,a wt% | Borax,a wt% | Corrosion rate, mm per year | ε MEK, % | S MEK, % | ∑Sb, % |
|---|---|---|---|---|---|---|---|
| a Relative to the total amount of electrolyte. b Sum of MEK, 2,3-BD and 2-BuOH selectivities. c Carbon steel. | |||||||
| 24 | DSA-O2 | 0 | 0 | 0 | 80.4 | 85.7 | 88.0 |
| 25 | CSc | 0 | 0 | 61.0 | 73.8 | 72.3 | 77.4 |
| 26 | CS | 1.5 | 0 | 64.0 | 76.1 | 75.8 | 80.5 |
| 27 | CS | 0 | 0.5 | 64.2 | 78.9 | 73.5 | 74.1 |
| 28 | CS | 0 | 1.0 | 69.3 | 82.9 | 83.6 | 90.3 |
| 29 | CS | 1.0 | 1.0 | 2.9 | 75.1 | 75.8 | 82.9 |
| 30 | CS | 1.5 | 1.0 | 6.4 | 74.2 | 72.6 | 79.5 |
| 31 | CS | 2.0 | 1.0 | 3.9 | 71.1 | 71.0 | 77.6 |
| 32 | CS | 2.5 | 1.0 | 3.3 | 71.3 | 71.2 | 76.7 |
| 33 | CS | 1.0 | 1.5 | 2.9 | 72.5 | 66.0 | 73.2 |
| 34 | CS | 1.0 | 2.0 | 2.1 | 72.9 | 67.5 | 74.5 |
| 35 | CS | 1.0 | 2.5 | 2.2 | 73.5 | 67.9 | 75.9 |
Conclusions
It has been shown that acetoin can be successfully electrochemically reduced in an aqueous medium to 2,3-BD and MEK at room temperature in both divided and undivided cells using KH2PO4 as the supporting electrolyte and a DSA-O2 anode based on IrO2 supported on titanium. The key parameter to drive the electroreduction towards one or another chemical is the cathode material. 2,3-BD is the major chemical produced when low hydrogen overvoltage cathodes, such as Pt and Ni, are used, while MEK is the principal product produced when high overvoltage cathodes, such as graphite, Pb and Cd, are employed. The cause of such an effect is related to the different electroreduction mechanisms leading to both chemicals. 2,3-BD is obtained by electrohydrogenation and consequently those metals typically used as hydrogenation catalysts are most suitable to be used as cathodes. However, MEK is synthesized by electrohydrogenolysis and therefore those materials avoiding or minimizing the hydrogen production by electrolysis, with a broad potential window before the onset of hydrogen evolution, are more suitable as cathodes.The current efficiency for acetoin conversion and 2,3-BD selectivity increase significantly when catalytic metals are deposited by PVD on a porous high specific surface matrix such as a carbon-based gas diffusion layer due to the decrease in the electrode potential, with the metal type and metal load having also a significant influence. The best results are obtained with an 80 μg cm−2 PtOx deposit which during electrolysis is reduced to Pt(0). It is thought that this is because PtOx deposited by PVD on a gas diffusion layer shows a dendritic structure of a high surface area which is held after electroreduction to Pt(0).
The best results for MEK electrosynthesis are obtained when Pb is used as a cathode. The use of Cd increases the current efficiency for acetoin conversion but its higher potential window before the onset for hydrogen evolution (higher reduction power) leads to a decrease in MEK selectivity.
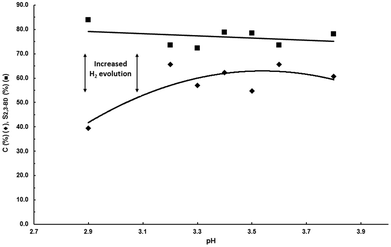
pH must be adjusted between 3 and 4 for 2,3-BD electrosynthesis, and 3–5.5 for MEK electrosynthesis. Below a pH of 3 hydrogen evolution by electroreduction of protons is the major reaction. The fact that both electrosyntheses can be done in overlapping pH ranges and with the same electrolyte is an important finding because it means that both processes can be operated using the same feeding aqueous solution making the process highly flexible.
By carefully selecting the circulated electrical charge and the current density both reactions can be advantageously carried out in undivided cells. The best results and related experimental conditions for both processes are summarized in Table 7.
| 2,3-BDa | MEKb | |
|---|---|---|
| a Experimental conditions: Undivided cell, anode: DSA-O2, cathode: PtOx-80/Sigracet® GDL-24BC, electrolyte: aqueous 2.5 wt% KH2PO4 + 4 wt% Na2SO4, pH 3.6, 1000 A m−2, 100 g L−1 acetoin, charge: 100 Qt%, room temperature, interelectrode gap: 8 mm. b Experimental conditions: Undivided cell, anode: DSA-O2, cathode: Pb, electrolyte: aqueous 10 wt% KH2PO4 adjusted at pH 5.5 with KOH, 1000 A m−2, 200 g L−1 acetoin, charge: 70 Qt%, room temperature, interelectrode gap: 8 mm. c Calculated for an industrial interelectrode gap of 2 mm. | ||
| C (%) | 77.6 | 65.8 |
| S (%) | 92.8 | 85.7 |
| ε (%) | 71.7% | 80.4 |
| Average voltagec (V) | 3.5 | 4.5 |
| Productivity (kg h−1 m−2) | 1.21 | 1.08 |
| Power consumptionc (kWh kg−1) | 2.94c | 4.1c |
Flexible production of 2,3-BD or MEK by a simple change of the cathode using the same undivided cell type and electrolyte, mild experimental conditions, good productivities and low power consumptions make these processes suitable for industrial upscaling, mainly considering that there is room for further improvement as further discussed in the ESI.‡
Experimental
Materials
All chemicals used were from Sigma-Aldrich, synthetic grade with a purity higher than 98%, except for acetoin whose purity was higher than 96%. DSA®-O2 anodes based on iridium oxide supported on titanium were supplied by Ercros (Spain). The Pt/Ti anode and Nafion 324 membranes were supplied by ElectroCell A/S (Denmark). 99.9% pure, 1 mm thick, Ni, Zn, Pb and Cd sheets used as cathodes were purchased from Goodfellow GmbH (Germany). The gas diffusion layer used as the support of decorated cathodes obtained by physical vapor deposition was Sigracet® GDL-24-BC from the SGL Group (Germany). 2 mm thick graphite JP 900 plates were supplied by Mersen Ibérica.Methods
PtOx cathodes were prepared using the mid-frequency alternating current (AC) dual technology based magnetron sputtering system under reactive sputtering conditions by employing a mixture of oxygen/argon (9![[thin space (1/6-em)]](https://www.rsc.org/images/entities/char_2009.gif) :
:![[thin space (1/6-em)]](https://www.rsc.org/images/entities/char_2009.gif) 1 v/v) sputtering gas in a PVD chamber comprising a planar magnetron with a Pt cathode. The sample holder was rotated during the deposition process.
1 v/v) sputtering gas in a PVD chamber comprising a planar magnetron with a Pt cathode. The sample holder was rotated during the deposition process.
Metals deposited on Sigracet® GDL-24BC supports were used as electrodes in the electrosynthesis of 2,3-butanediol while those deposited on silicon wafers were used to determine the catalyst mass loading by measuring the weight difference before and after the deposition, and for Raman, SEM and EDX analyses.
The composition of the mixed electrodes PtCo and PtNi was determined by EDX. Scanning electron microscopy (SEM) images and the energy dispersive X-ray spectroscopy (EDX) spectrum for PtxO/Sigracet® GDL-24BC were acquired using an SEM Inspect™ F50 with an EDX system INCA PentaFETx3 (FEI Company, Eindhoven, The Netherlands) in an energy range between 0 and 30 keV. The O/Pt ratio as determined by EDX was 2.8 (see Table S1 in the ESI‡) indicating that it consisted of a mixture of Pt oxides (PtOx). Nevertheless, Raman spectra obtained with a inViaTM Raman microscope equipped with an optical microscope LEICA DMLM confirmed the existence of α-PtO2 bands (see Fig. S4 in the ESI‡).
Finally, before being fitted in the filter press electrochemical cell, decorated GDL-24BC with a geometric area of 20 cm2 were attached to stainless steel plates acting as current collectors by gluing with an electrically carbon conductive cement (CCC Carbon Adhesive ref. 12664, Aname Instrumentación Científica, Spain).
Electrosynthesis experimental set up
The electrolysis were carried out at a constant current using a parallel-plate filter press assembly as a flow cell and a Promax FAC-376, 5A, 30 V as a DC power supply. Experiments were done in both undivided and divided cells fitted with a DSA®-O2 anode and a cathode, both of 20 cm2 of the effective geometric area. In divided cells anodic and cathodic compartments were separated by a Nafion 324 cation exchange membrane and the anolyte was always a 5 wt% aqueous solution of H2SO4. Interelectrode gaps were 8 mm and 17 mm for undivided and divided cells, respectively. The electrolyte compartments were defined by polypropylene frames and sealing was carried out with Viton gaskets. No turbulence promoter was used. Aqueous solutions consisting of acetoin and a supporting electrolyte were contained in 0.25 L jacketed closed glass reservoirs fitted with a condenser to avoid evaporation of volatile chemicals such as methyl ethyl ketone. In operation, these aqueous solutions were pumped through their respective compartments (cathodic one in the divided cell and the interelectrode one in the undivided cell) in the electrochemical cell by means of magnetic pumps (lwaki MD-10-R) to provide flow rates of 2 L min−1. Temperature was controlled by recirculating water through the jackets of the reservoirs from a bath a room temperature.Analytical procedures
Acetoin, 2,3-butanediol, methyl ethyl ketone and 2-butanol were analyzed by HPLC with a Varian equipment model 920-LC fitted with a refractive index detector and a 300 × 7.8 mm Bio-Rad Aminex HPX-87H column under the following conditions: mobile phase, 0.01 N H2SO4; mobile phase flow rate, 0.7 mL min−1; column temperature, 65 °C; detector temperature, 50 °C; injection volume, 10 μL. Samples for analysis were prepared by diluting aliquots of the electrolyte into the mobile phase. The dilution factor was 1![[thin space (1/6-em)]](https://www.rsc.org/images/entities/char_2009.gif) :
:![[thin space (1/6-em)]](https://www.rsc.org/images/entities/char_2009.gif) 50. Before analysis, the samples were filtered through 0.45 μm nylon syringe filters. Quantification was carried using calibration lines obtained with 50–1000 mg L−1 aqueous solutions of the corresponding standards in the mobile phase.
50. Before analysis, the samples were filtered through 0.45 μm nylon syringe filters. Quantification was carried using calibration lines obtained with 50–1000 mg L−1 aqueous solutions of the corresponding standards in the mobile phase.
10 mL of a few aqueous electrolytes were extracted with 3 × 3.5 mL of dichloromethane. The combined organic phases were dried over anhydrous sodium sulfate, filtered, concentrated by air stripping and analyzed by GC-MS for the identification of byproducts using an Agilent GC (7890B)-MS detector (5977A) apparatus with a 30 m × 0.25 mm × 0.25 mm HP-5 ms capillary GC column under the following experimental conditions: injector temperature: 300 °C; detector temperature: 230 °C; injection volume: 1 μL; split ratio: 1![[thin space (1/6-em)]](https://www.rsc.org/images/entities/char_2009.gif) :
:![[thin space (1/6-em)]](https://www.rsc.org/images/entities/char_2009.gif) 20; oven temperature ramp: 40 °C for 5 min, 10 °C min−1 up to 300 °C, then 5 min at 300 °C, total time for analysis: 36 min; acquisition mode: SCAN, with masses from 26 to 250 being scanned for the first 2 minutes and masses from 30 to 500 for the remaining analysis time.
20; oven temperature ramp: 40 °C for 5 min, 10 °C min−1 up to 300 °C, then 5 min at 300 °C, total time for analysis: 36 min; acquisition mode: SCAN, with masses from 26 to 250 being scanned for the first 2 minutes and masses from 30 to 500 for the remaining analysis time.
Abbreviations
| C (%) | Acetoin conversion |
| S i (%) | Selectivity for i = 2,3-BD (2,3-butanediol), MEK (methyl ethyl ketone), 2-BuOH (2-butanol) |
| ε i (%) | Current efficiency for i = act (acetoin conversion), 2,3-BD (2,3-butanediol), MEK (methyl ethyl ketone), 2-BuOH (2-butanol) |
| j (A m−2) | Current density relative to the electrode geometric area. |
| Q t | Theoretical charge for full acetoin conversion assuming 100% acetoin current efficiency, 2 F mol−1 |
Conflicts of interest
There are no conflicts to declare.Acknowledgements
The authors thank Mr Jesús Torrecilla, Biokemik's CEO, for giving permission to publish this work. The important contribution of Cristina Diñeiro-García and Leire Lorenzo-Ibarreta to the experimental work is also gratefully acknowledged. GC-MS analyses were carried out by Belén Maestro-Madurga.Notes and references
- T. Werpy and G. Petersen, Top Value Added Chemicals from Biomass: Volume I, Results of Screening for Potential Candidates from Sugars and Synthesis Gas, National Renewable Energy Lab, United States, 2004, DOI:10.2172/15008859.
- Z. Xiao and J. R. Lu, Biotechnol. Adv., 2014, 32, 492–503 CrossRef CAS PubMed.
- J. Sun, B. Rao, L. Zhang, Y. Shen and D. Wei, Chem. Eng. Commun., 2012, 199, 1492–1503 CrossRef CAS.
- T. Roncal, S. Caballero, M. M. Díaz de Guereñu, I. Rincón, S. Prieto and J. R. Ochoa-Gómez, Process Biochem., 2017, 58C, 35–41 CrossRef.
- J. Ding and W. Hua, Chem. Eng. Technol., 2013, 36, 83–90 CrossRef CAS.
- E. V. Makshina, M. Dusselier, W. Janssens, J. Degrève, P. A. Jacobs and B. F. Sels, Chem. Soc. Rev., 2014, 43, 7917–7953 RSC.
- D. Tsukamoto, S. Sakami, M. Ito, K. Yamada and T. Yonehara, Chem. Lett., 2016, 45, 831–833 CrossRef CAS.
- J.-Y. Dai, P. Zhao, X.-L. Cheng and Z.-L. Xiu, Appl. Biochem. Biotechnol., 2015, 175(6), 3014–3024 CrossRef CAS PubMed.
- J. Xiao-Jun, H. He and O. Ping-Kai, Biotechnol. Adv., 2011, 29, 351–364 CrossRef PubMed.
- T. Roncal, S. Caballero, M. M. Díaz de Guereñu, I. Rincón, S. Prieto and J. R. Ochoa-Gómez, WO2018019656A1, 2018 Search PubMed.
- A. A. Koutinas, B. Yepez, N. Kopsahelis, D. M. G. Freire, A. M. de Castro, S. Papanikolaou and I. K. Kookos, Bioresour. Technol., 2016, 204, 55–64 CrossRef CAS PubMed.
- G. R. Harvianto, J. Haider, J. Hong, N. Van Duc Long, J. J. Shim, M. H. Cho, W. K. Kim and M. Lee, Biotechnol. Biofuels, 2018, 11, 18 CrossRef PubMed.
- J. R. Ochoa-Gómez, S. Gil-Río, F. Río-Pérez, L. Lorenzo-Ibarreta, C. Diñeiro-García and T. Roncal Martínez, US Pat, 9975827B2, 2018 Search PubMed.
- J. R. Ochoa-Gómez, S. Pérez-Gil, M. M. Díaz De Guereñu and I. Rincón, Eur. Pat. Appl, EP17382756, 2017 Search PubMed.
- B. A. Frontana-Uribe, R. D. Little, J. G. Ibañez, A. Palmad and R. Vasquez-Medrano, Green Chem., 2010, 12, 2099–2119 RSC.
- M. Fedoroňko, J. Königstein and K. Linek, Collect. Czech. Chem. Commun., 1967, 32, 3998–4003 CrossRef.
- M. M. Baizer, T. Nonaka, K. Park, Y. Saito and K. Nobe, J. Appl. Electrochem., 1987, 14, 197–208 CrossRef.
- F. D. Popp and H. P. Schultz, Chem. Rev., 1962, 62, 19–40 CrossRef CAS.
- A. K. Cheong, V. Bolduc and J. Lessard, Can. J. Chem., 1993, 71, 1850–1856 CrossRef CAS.
- T. Mandal, S. Jana and J. Dash, Eur. J. Org. Chem., 2017, 4972–4983 CrossRef CAS.
- H. Ilikti, T. Benabdallah, K. Bentayeb, A. A. Othman, Z. Derriche and S. Afr, J, Chem., 2008, 61, 31–36 CAS.
- K. A. Kumar and D. CH. Gowda, E-J. Chem., 2011, 8, 49–52 CrossRef.
- M. A. Brown, A. Goel and Z. Abbas, Angew. Chem., Int. Ed., 2016, 55, 3790–3794 CrossRef CAS PubMed.
- J. Dai, W. Guan, L. Ma and Z. Xiu, Sep. Purif. Technol., 2017, 184, 275–279 CrossRef CAS.
- S. Xie, Y. Zhang, Y. Zhou, Z. Wang, C. Yi and X. Qiu, Chem. Technol. Biotechnol., 2017, 92, 122–132 CrossRef CAS.
- F. Bernardi, M. C. M. Alves and J. Morais, J. Phys. Chem. C, 2010, 114, 21434–21438 CrossRef CAS.
- C. W. Scheeren, J. B. Domingos, G. Machado and J. Dupont, J. Phys. Chem. C, 2008, 112, 16463–16469 CrossRef CAS.
- J. Zhensheng, X. Chanjuan, Z. Qingmei, Y. Feng, Z. Jiazhen and Z. Jinzhen, J. Mol. Catal. A: Chem., 2003, 191, 61–66 CrossRef.
- K. Yamada, K. Miyazaki, S. Koji, Y. Okumura and M. Shibata, J. Power Sources, 2008, 180, 181–184 CrossRef CAS.
- A. O. King and I. Shinkai, Encyclopedia of Reagents for Organic Synthesis, 2001, https://onlinelibrary.wiley.com/doi/pdf/10.1002/047084289X.rp181 Search PubMed.
- Ch. Zhu, T. Shen, D. Liu, J. Wu, Y. Chen, L. Wang, K. Guo, H. Ying and P. Ouyang, Green Chem., 2016, 18, 2165–2174 RSC.
- M. M. Baizer, J. Electrochem. Soc., 1964, 111, 215–222 CrossRef CAS.
- D. E. Danley, J. Electrochem. Soc., 1984, 135, 435C–442C CrossRef.
- Y. Kunugi, F. Fuchigami, H.-J. Tien and T. Nonaka, Chem. Lett., 1989, 18, 757–760 CrossRef.
- Y. Kunugi, T. Nonaka and H.-J. Tien, Electrochim. Acta, 1990, 35, 1167–1171 CrossRef CAS.
- C. Lagrost, Ph. Hapiota and M. Vaultiera, Green Chem., 2005, 7, 468–474 RSC.
- Y.-J. Biang and D.-S. Bai, Indian J. Chem., 2007, 46B, 1890–1892 Search PubMed.
- Ph. J. Elving and J. T. Leone, J. Am. Chem. Soc., 1958, 80, 1021–1029 CrossRef CAS.
- J. H. Stocker and R. M. Jenevein, J. Org. Chem., 1968, 33, 294–297 CrossRef CAS.
- J. M. Stocker, D. H. Kern and R. M. Jenevein, J. Org. Chem., 1969, 34, 2810–2813 CrossRef CAS.
- H. Nohe, F. Beck, D. Werner and E.-J. Schier, US Pat, 3984294, 1976 Search PubMed.
Footnotes |
| † Part of this article was presented as an oral communication in the 3rd Green & Sustainable Chemistry Conference, Berlin (Germany), 2018, May 14–16th. Oral presentation O3.2 (May 15th). Session 3 – Recent Developments in Green Synthesis. |
| ‡ Electronic supplementary information (ESI) available. See DOI: 10.1039/c8gc03028f |
| This journal is © The Royal Society of Chemistry 2019 |

