
Effect of the food form and structure on lipid digestion and postprandial lipaemic response†
Cintia B.
Dias‡
 abc,
Xiangqian
Zhu
a,
Abby K.
Thompson
a,
Harjinder
Singh
a and
Manohar L.
Garg
*abc
abc,
Xiangqian
Zhu
a,
Abby K.
Thompson
a,
Harjinder
Singh
a and
Manohar L.
Garg
*abc
aRiddet Institute, Massey University, Palmerston North, New Zealand
bSchool of Biomedical Sciences & Pharmacy, University of Newcastle, Callaghan, NSW, Australia. E-mail: manohar.garg@newcastle.edu.au
cPriority Research Centre in Physical Activity and Nutrition, University of Newcastle, Callaghan, NSW, Australia
First published on 29th November 2018
Abstract
As the food matrix is a determinant of the rate of fat digestion and absorption, it is important for the modulation of postprandial triglyceridaemia. High postprandial triglyceride levels are associated with an increase in inflammation, oxidative stress, an imbalance in the lipoprotein profile and an increase in the risk of developing chronic diseases. This study was designed to assess the in vitro digestion patterns and the postprandial lipaemic responses to test foods with the same nutrient composition but differing in the form and structure. A liquid, a semi-solid and a solid test food with the same nutrient and energy composition were designed. The digestion profiles of the three foods were assessed using a dynamic in vitro model. The foods were also consumed by healthy young adults who donated blood samples after an overnight fast and again 0.5, 1, 2, 3, 4 and 6 h after consuming each of the test foods and who were also assessed for appetite sensations. The solid food showed phase separation during gastric digestion and a lower release of fatty acids during intestinal digestion than the liquid and semi-solid foods. During the postprandial feeding experiments, the solid food caused a lower increase in serum triglycerides than the liquid food and produced higher fullness and satisfaction. In conclusion, the food form and structure modulated fat release, postprandial triglyceridaemia and appetite sensations independent of the nutrient and energy content. Thus, manipulation of the food structure and form may be used in designing strategies for improving metabolic markers and satiety.
Introduction
From the moment food is ingested, its properties start to change because of physiological, biochemical and physicochemical processes. During oral processing, the food is subjected to mastication and is mixed with saliva. The bolus formed is then swallowed, passes through the oesophagus and arrives into the stomach. In the stomach, the bolus suffers mechanical agitation and addition of digestive enzymes, residing from a few minutes to hours. The mixture, now called chyme, is then transferred to the small intestine, where the digestion is completed, with the aid of pancreatic enzymes, bile salts and phospholipids, and the nutrients are finally released and absorbed. The characteristics of the bolus during oral and gastrointestinal (GI) processing and the rate of absorption of nutrients in the small intestine depend on the food's matrix, form and structure.1The food form and structure have been demonstrated to modulate oral processing2–5 and digestion,6,7 consequently modulating the postprandial metabolism of micronutrients and macronutrients8–11 and satiety.12In vitro and in vivo studies comparing dairy-based liquid, solid and semi-solid foods have demonstrated a matrix-dependent digestive behaviour, including proteolysis and lipolysis.13,14 Factors such as the acid stability of the emulsion, the emulsion particle size and the macronutrient composition are determinants of the food structure and digestive behaviour. For example, acid-stable emulsions promote a slow and gradual gastric emptying compared with acid-unstable emulsions.15 Whey protein is more soluble in the gastric system and is hydrolysed more easily than casein.16 Emulsions containing smaller fat globules suffer faster lipolysis than emulsions containing larger fat globules within the same volume of oil. This happens because smaller globules have a larger surface area which provides greater contact with enzymes compared to larger globules.17
The rate of digestion, including the hydrolysis of proteins and lipids, will consequently modulate nutrient absorption. In feeding studies, nuts consumed in different forms, from whole to ground, homogenized or reconstituted, have been assessed. Whole nuts caused lower postprandial lipaemia than a reconstituted meal (oil and defatted flour) or nut oil,8,9 demonstrating that the food structure and the encapsulation of the lipid droplet are important in determining the acute lipaemic response to a food. However, results from postprandial studies are often inconsistent because of the many differences in the study design and test food composition and the lack of standardization of acute feeding studies.18
Postprandial plasma/serum triglyceride levels have been identified as a risk factor for the development of metabolic diseases, including cardiovascular disease and type 2 diabetes.19–21 As soon as 1 h after the consumption of a meal,22,23 excess triglyceride levels in circulation trigger inflammatory pathways and oxidative stress. Although these pathways are adaptive responses, excess nutrient intake and inefficient clearance may cause a surplus in circulating triglycerides and lead to adverse outcomes. It has been demonstrated that sustained high triglyceride levels can lead to vascular events, insulin resistance, impaired endothelial function, recruitment of pro-inflammatory cells and imbalance in lipoprotein profiles.24–28 Considering that, on average, humans spend about 18 h of their day in the postprandial state (non-fasting),21 postprandial triglyceridaemia is an important target in the prevention of chronic diseases.
The effect of different food structures on the in vitro digestive behaviour of lipids has been well studied, but there is limited information available on the subsequent effects of the food structure on postprandial triglyceridaemia in humans in energy and nutrient matched foods. Therefore, the aims of this study were to: (a) design foods with the same nutrient and energy composition but differing in the form and structure; (b) characterize in vitro their behaviour during digestion; and (c) determine their postprandial lipaemic response in a randomized cross-over trial. A secondary aim of the study was to determine the effect of different food structures on appetite sensations.
Experimental
Materials
Whey protein concentrates (WPCs) 392 and 515 were donated by Fonterra Co-operative Group Limited (New Zealand). Maltodextrin (Clintose CR10), soy lecithin (Yelkin TS) and carboxymethyl cellulose (Novagel cellulose gel, GP2180) were purchased from Archer Daniels Midland (USA). Dextrose monohydrate, cocoa powder, icing sugar and high oleic sunflower oil were purchased from Davis Trading Company (New Zealand). Vanilla flavour was purchased from Formula Foods (New Zealand). α-Amylase from Aspergillus oryzae (10![[thin space (1/6-em)]](https://www.rsc.org/images/entities/char_2009.gif) 065, ≈30 U mg−1), pepsin (P7000; ≥250 units per mg solids), Amano Lipase A (534781, ≥120000 U g−1) and pancreatin (P7545, 8USP) were purchased from Sigma-Aldrich (New Zealand). Bile was purchased from Bio-Strategy (New Zealand). Milli-Q water was produced using a Millipore system (Merck Millipore, Australia) and this water was used in the preparation of all solutions. All other reagents were of analytical grade. Simulated salivary fluid (SSF) was prepared to obtain final concentrations of 0.5 M KCl, 0.5 M KH2PO4, 2 M NaCl, 0.15 M MgCl2·6H2O, 0.5 M (NH4)2CO3, 1 M NaHCO3, 0.3 M CaCl2·2H2O and 75 U mL−1 of α-amylase. Simulated gastric fluid (SGF) was prepared to obtain final concentrations of 0.5 M KCl, 0.5 M KH2PO4, 2 M NaCl, 0.15 M MgCl2·6H2O, 0.5 M (NH4)2CO3, 1 M NaHCO3, 0.3 M CaCl2·2H2O, 3 g L−1 of pepsin and 50 U mL−1 of lipase; the pH was adjusted to 1.5 with 3 M HCl. Simulated intestinal fluid (SIF) was prepared to obtain final concentrations of 0.5 M KCl, 0.5 M KH2PO4, 2 M NaCl, 0.15 M MgCl2·6H2O, 0.5 M (NH4)2CO3, 1 M NaHCO3, 0.3 M CaCl2·2H2O and 0.8 mg mL−1 of pancreatin. The enzymes and the CaCl2·2H2O were added according to section in vitro digestion.
065, ≈30 U mg−1), pepsin (P7000; ≥250 units per mg solids), Amano Lipase A (534781, ≥120000 U g−1) and pancreatin (P7545, 8USP) were purchased from Sigma-Aldrich (New Zealand). Bile was purchased from Bio-Strategy (New Zealand). Milli-Q water was produced using a Millipore system (Merck Millipore, Australia) and this water was used in the preparation of all solutions. All other reagents were of analytical grade. Simulated salivary fluid (SSF) was prepared to obtain final concentrations of 0.5 M KCl, 0.5 M KH2PO4, 2 M NaCl, 0.15 M MgCl2·6H2O, 0.5 M (NH4)2CO3, 1 M NaHCO3, 0.3 M CaCl2·2H2O and 75 U mL−1 of α-amylase. Simulated gastric fluid (SGF) was prepared to obtain final concentrations of 0.5 M KCl, 0.5 M KH2PO4, 2 M NaCl, 0.15 M MgCl2·6H2O, 0.5 M (NH4)2CO3, 1 M NaHCO3, 0.3 M CaCl2·2H2O, 3 g L−1 of pepsin and 50 U mL−1 of lipase; the pH was adjusted to 1.5 with 3 M HCl. Simulated intestinal fluid (SIF) was prepared to obtain final concentrations of 0.5 M KCl, 0.5 M KH2PO4, 2 M NaCl, 0.15 M MgCl2·6H2O, 0.5 M (NH4)2CO3, 1 M NaHCO3, 0.3 M CaCl2·2H2O and 0.8 mg mL−1 of pancreatin. The enzymes and the CaCl2·2H2O were added according to section in vitro digestion.
Preparation of test foods
The liquid and semi-solid foods were prepared the day before the in vitro digestion and the postprandial intervention. All powdered ingredients were weighed (13% WPC515 for the liquid food, 13% WPC392 for the semi-solid food, 9.36% dextrose monohydrate, 4.62% sucrose, 0.78% maltodextrin DE10, 0.32% carboxymethyl cellulose, 1% cocoa powder and 0.03% natural vanilla flavour, based on the final food product) in a single batch, combined and portioned in individual packets. Oil (10%), soy lecithin (0.18%) and water (60.71%) were weighed just before preparation. Water was heated to 60 °C. A portion of the water was mixed into the pre-portioned powder to produce a roux, the mixture was then transferred to a blender (Breville Kinetix control, Australia) and the remaining water was added. The blender was set to the highest shear setting for 2 min. The oil was mixed with the soy lecithin and then added to the blender mixture. The blender was again set to the highest shear setting for 2 min. For the liquid food, 400 g was weighed and stored at 4 °C until use (within 24 h). For the semi-solid food, the mixture was placed in a water bath inside an oven at 180 °C for 30 min; after cooling, 396 g (to account for 1% water loss) was weighed and stored at 4 °C until use (within 24 h).The solid food was prepared in bulk to obtain concentrations of 33.9% WPC515, 6.72% dextrose monohydrate, 11.81% sucrose, 19.09% maltodextrin DE10, 0.81% carboxymethyl cellulose, 2.55% cocoa powder, 0.03% natural vanilla flavour, 25.45% oil and 0.46% soy lecithin. All ingredients were mixed using a mixer (Breville scraper beater, Australia) with a scraper beater until the ingredients were combined; further hand kneading was carried out to ensure homogeneity. The final dough was portioned (157.5 g), cooked at 120 °C for 18 min, packaged and kept in a dark, cool, dry place until use.
In vitro digestion
The in vitro digestion was performed according to studies by Guo et al.29,30 and Minekus et al.31 In summary, the process was performed in three sequential phases: oral, gastric and intestinal.Characterization of the test foods and the digesta collected
Postprandial intervention study
| Liquid | Semi-solid | Solid | |
|---|---|---|---|
| Values were calculated based on the ingredients used in the formulation of the test foods and their specification sheets. | |||
| Energy (kJ per test meal) | 3353.0 | 3361.3 | 3358.0 |
| Total mass (g per test meal) | 400 | 400 | 400 |
| Protein (g per test meal) | 42.1 | 42.7 | 42.1 |
| Carbohydrates (g per test meal) | 60.7 | 60.6 | 61.0 |
| Total fat (g per test meal) | 43.4 | 43.4 | 43.4 |
| Saturated fat (g per test meal) | 5.7 | 5.8 | 5.7 |
| Monounsaturated (g per test meal) | 33.6 | 33.6 | 33.6 |
| Polyunsaturated (g per test meal) | 3.0 | 3.0 | 3.0 |
| Trans fat (g per test meal) | 0.36 | 0.36 | 0.36 |
| Cholesterol (mg per test meal) | 109.2 | 109.2 | 109.2 |
| Fibre (g per test meal) | 1.3 | 1.3 | 1.3 |
| Sodium (mg per test meal) | 146.9 | 178.1 | 146.9 |
| Calcium (mg per test meal) | 197.6 | 208.0 | 197.6 |
| Potassium (mg per test meal) | 1.9 | 267.1 | 0.5 |
Study subjects gave written informed consent before participation. This study was approved by the University of Newcastle Human Research Ethics Committee (protocol H-2016-0315) and by the Massey University Human Ethics Committee: Human Ethics Southern A Committee (SOA 16/54), and the study was registered with the Australia New Zealand Trial Registry as ACTRN12616001633471.
Statistical analysis
Plasma lipids and glucose were measured at baseline and 0.5, 1, 2, 3, 4 and 6 h after consumption of the meal and appetite sensations were measured at baseline, immediately after meal consumption and 2, 4 and 6 h after meal consumption. The net area under the postprandial curve (net AUC) for all measures was calculated using the trapezoid rule. All data are presented as mean and standard deviation. Net AUC measurements were compared using paired t-tests and Wilcoxon signed-rank tests, for parametric and non-parametric data, respectively. Two-way analysis of variance with repeated measures was applied to analyse the meal effect over time (interaction: meal × time) and one-way analysis of variance with repeated measures was applied to analyse the existence of differences between the baseline and subsequent time points within the meal for the parametric data. The change from the baseline to each time point within the meal was assessed using paired t-tests and Wilcoxon signed-rank tests, for parametric and non-parametric data, respectively. p-Values lower than 0.05 were considered to be significant for all statistical tests and Stata IC 11.2 (StataCorp LLC, USA) was used to perform the statistical analysis.Results
Test foods
To obtain the same nutrient and energy composition in the three test foods, the same ingredients were used in the three formulations. To achieve a liquid and a semi-solid (gelled consistency), two different WPC powders were used (WPC515 and WPC392). WPC515 is a heat-stable protein ingredient that does not form a gel upon heat treatment, whereas WPC392 forms a gel when heated. The two WPC powders have the same protein content but differ in their mineral content; WPC392 contains more sodium, calcium and potassium (340, 400 and 510 mg per 100 g respectively) than WPC515 (280, 380 and 0 mg per 100 g respectively).For the preparation of the solid food, no water was added to obtain a solid consistency. To improve palatability, 28.2% of the glucose in the solid food was replaced with maltodextrin, compared with the liquid and semi-solid foods.
Sucrose, cocoa powder and natural vanilla flavour were used to improve the flavour and palatability of all formulations. The presence of whey protein, soy lecithin and carboxymethyl cellulose facilitated emulsification.
The physical appearance, microstructure and particle size distributions of the test foods are shown in Fig. 1. Particle size distributions measured after dispersion of these foods in sodium dodecyl sulphate solution showed relatively uniform and narrow distributions of oil droplets. The average oil droplet sizes of the liquid food (D3,2 = 0.92 ± 0.10 μm) and the semi-solid food (D3,2 = 1.41 ± 0.03 μm) were significantly smaller than the average particle size of the solid food (D3,2 = 4.69 ± 0.21 μm, p < 0.05). The confocal microscopy images confirmed the particle size analysis.
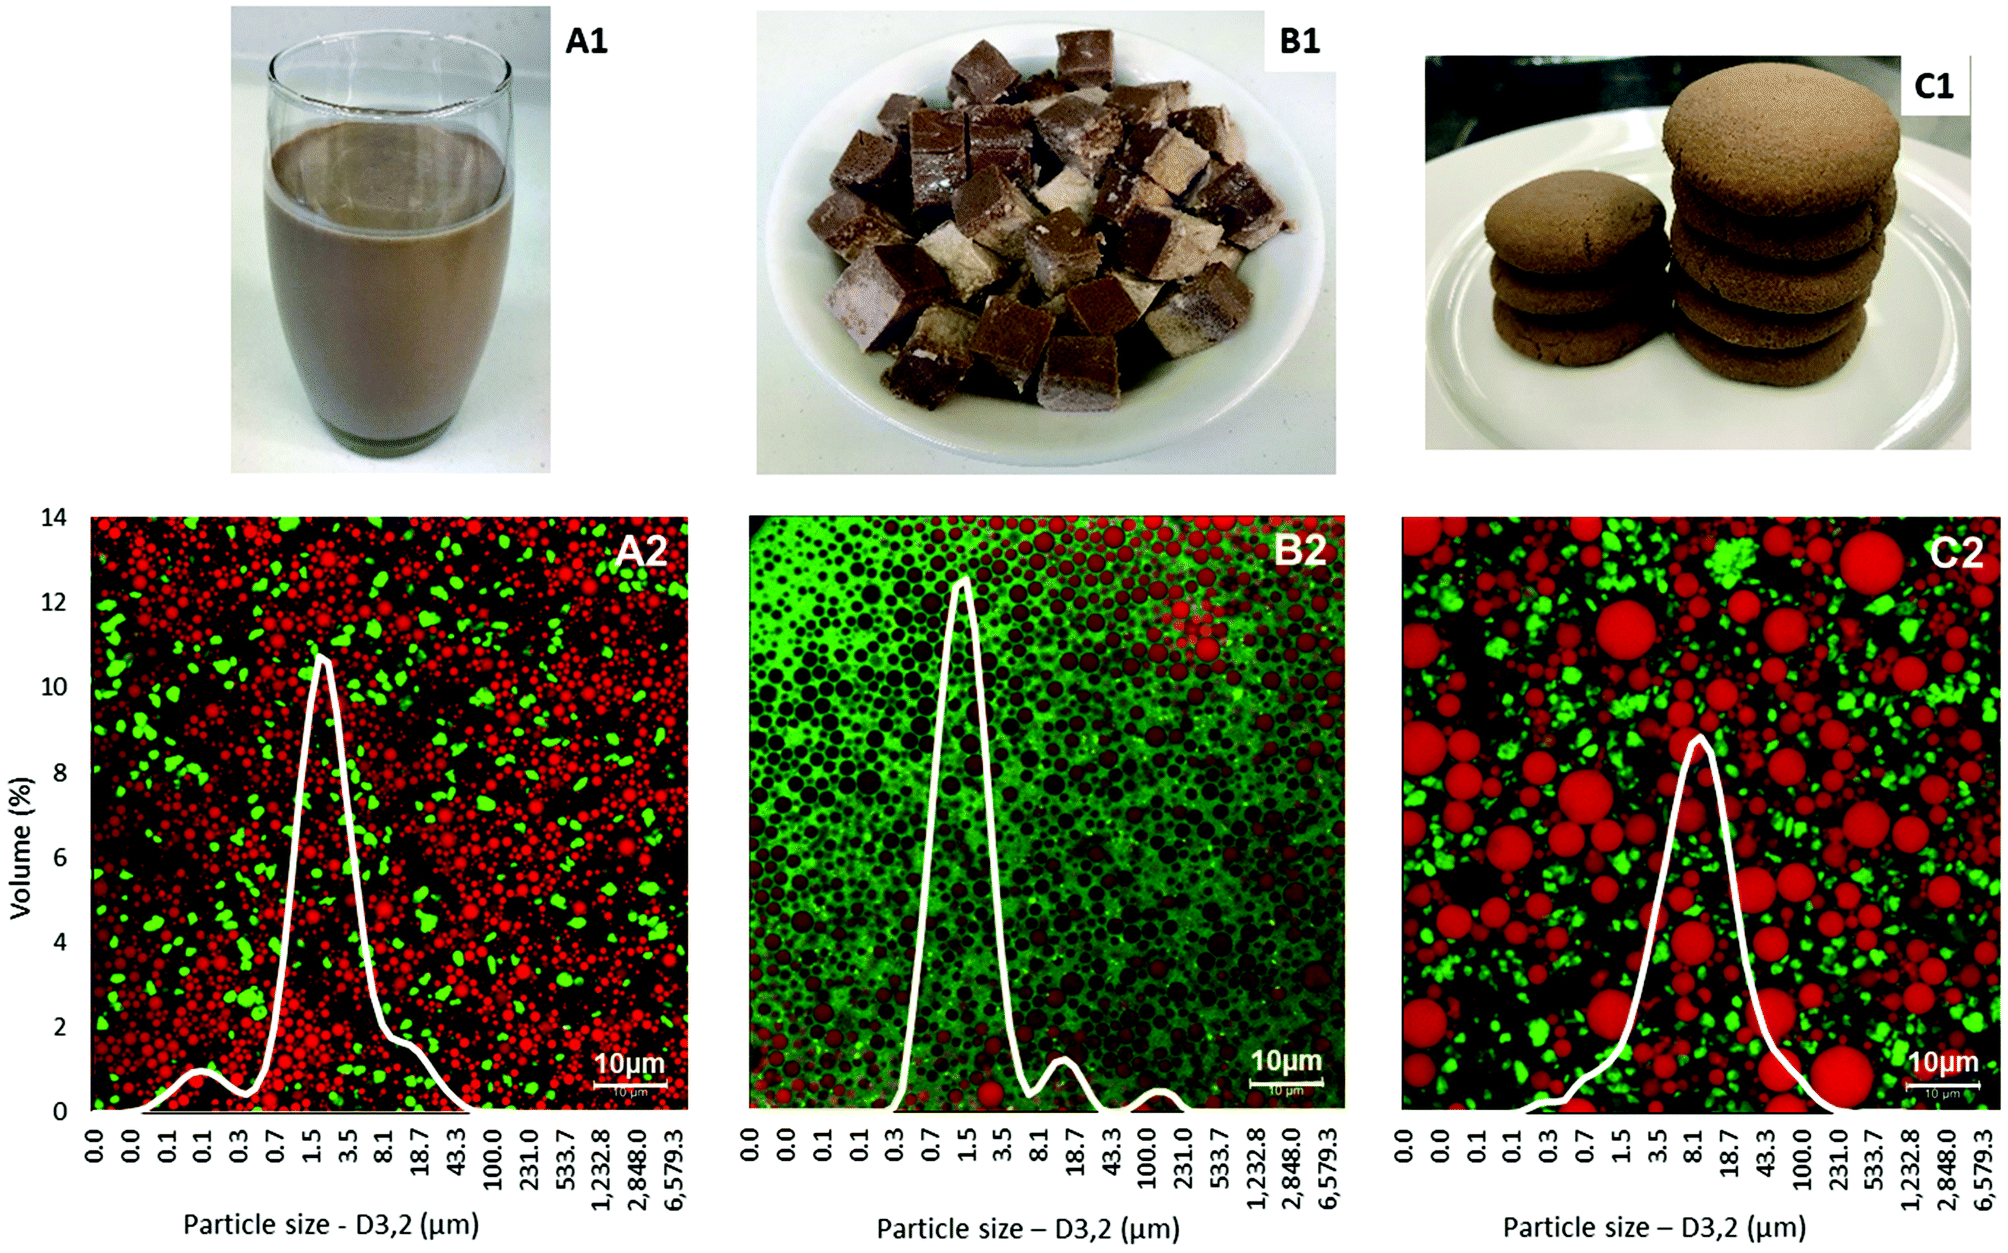 | ||
| Fig. 1 Form (1), microstructure and particle size distribution (2) of the liquid (A), semi-solid (B) and solid (C) foods. | ||
In vitro digestion
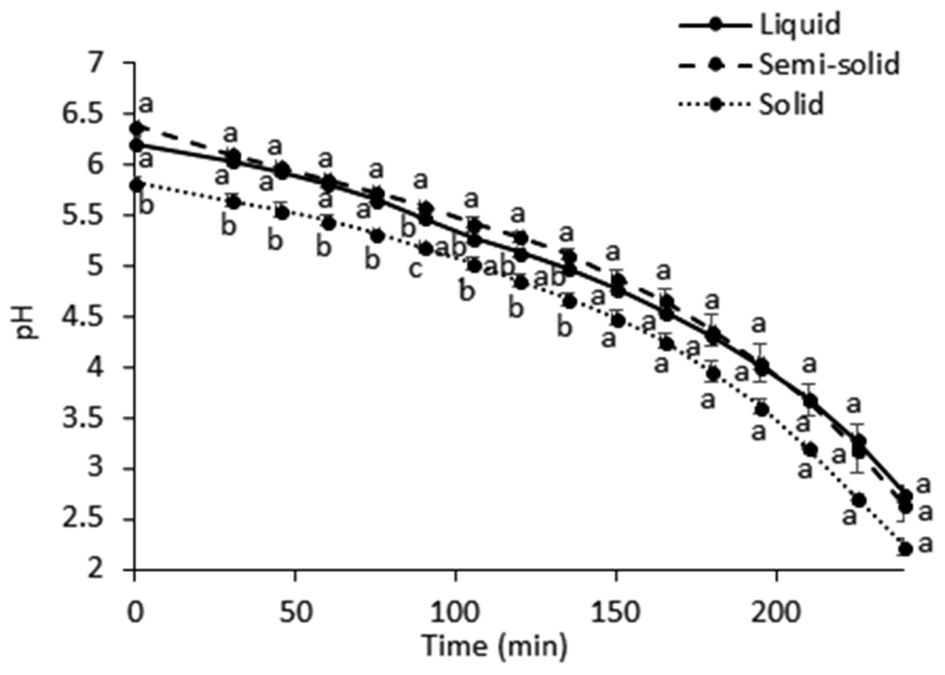 | ||
| Fig. 2 pH changes (mean ± standard deviation, n = 2) during the in vitro gastric digestion. Different lowercase letters represent differences between the test foods (p < 0.05). | ||
Confocal microscopy examination of the digesta revealed that the concentration of oil droplets in the digesta decreased over time because of the gradual dilution with SGF (Fig. 3). The droplet size distribution of the digesta did not vary much over the digestion period for the liquid food, but a shift in droplet size distribution was seen at 240 min for the semi-solid and solid foods (Fig. 3, ESI 2†).
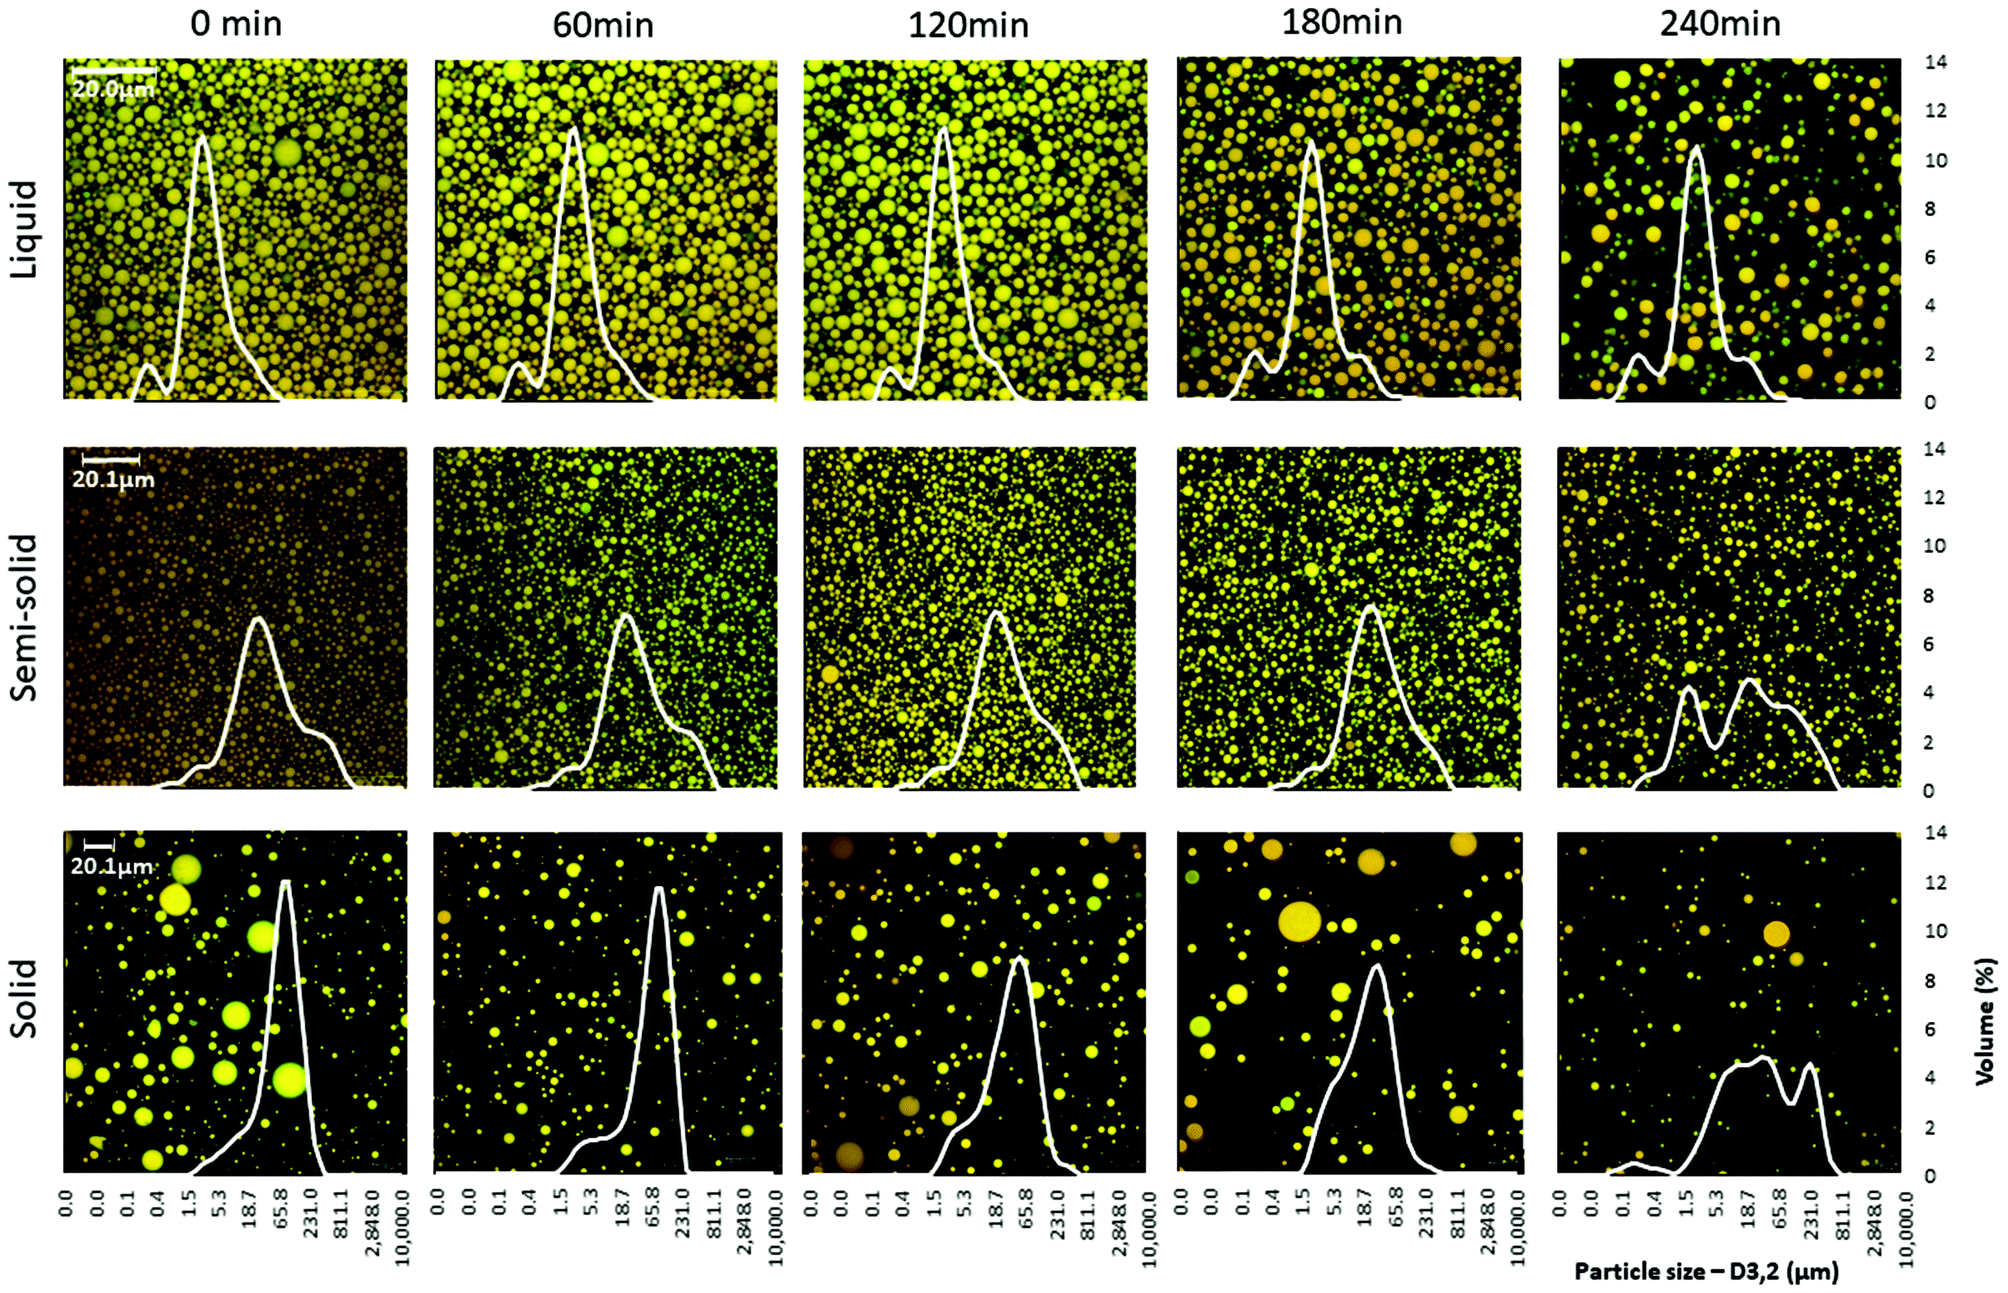 | ||
| Fig. 3 Microstructure (confocal imaging) and particle size distribution of the digesta over the 4 h of the in vitro gastric digestion period. | ||
The concentration of fat in the aliquots of digesta collected from the HGS varied with each different food (Fig. 4). Large proportions of fat in the digesta collected demonstrated that the amount of fat discharged from the HGS was greater and that the amount of fat left inside the HGS was smaller, and vice versa. A significantly smaller proportion of fat was discharged with the digesta collected from the HGS during the gastric digestion of the solid food compared with the liquid food (79% less, p < 0.001) and the semi-solid food (75% less, p < 0.001). For the solid food, most of the fat (76.8% of the total fat added to the system) was visibly remaining in the HGS after 4 h of gastric digestion. For the liquid food, 0.5% of the total fat in the system was still in the HGS and for the semi-solid food, 16.4% of the total fat remained in the HGS under the same conditions.
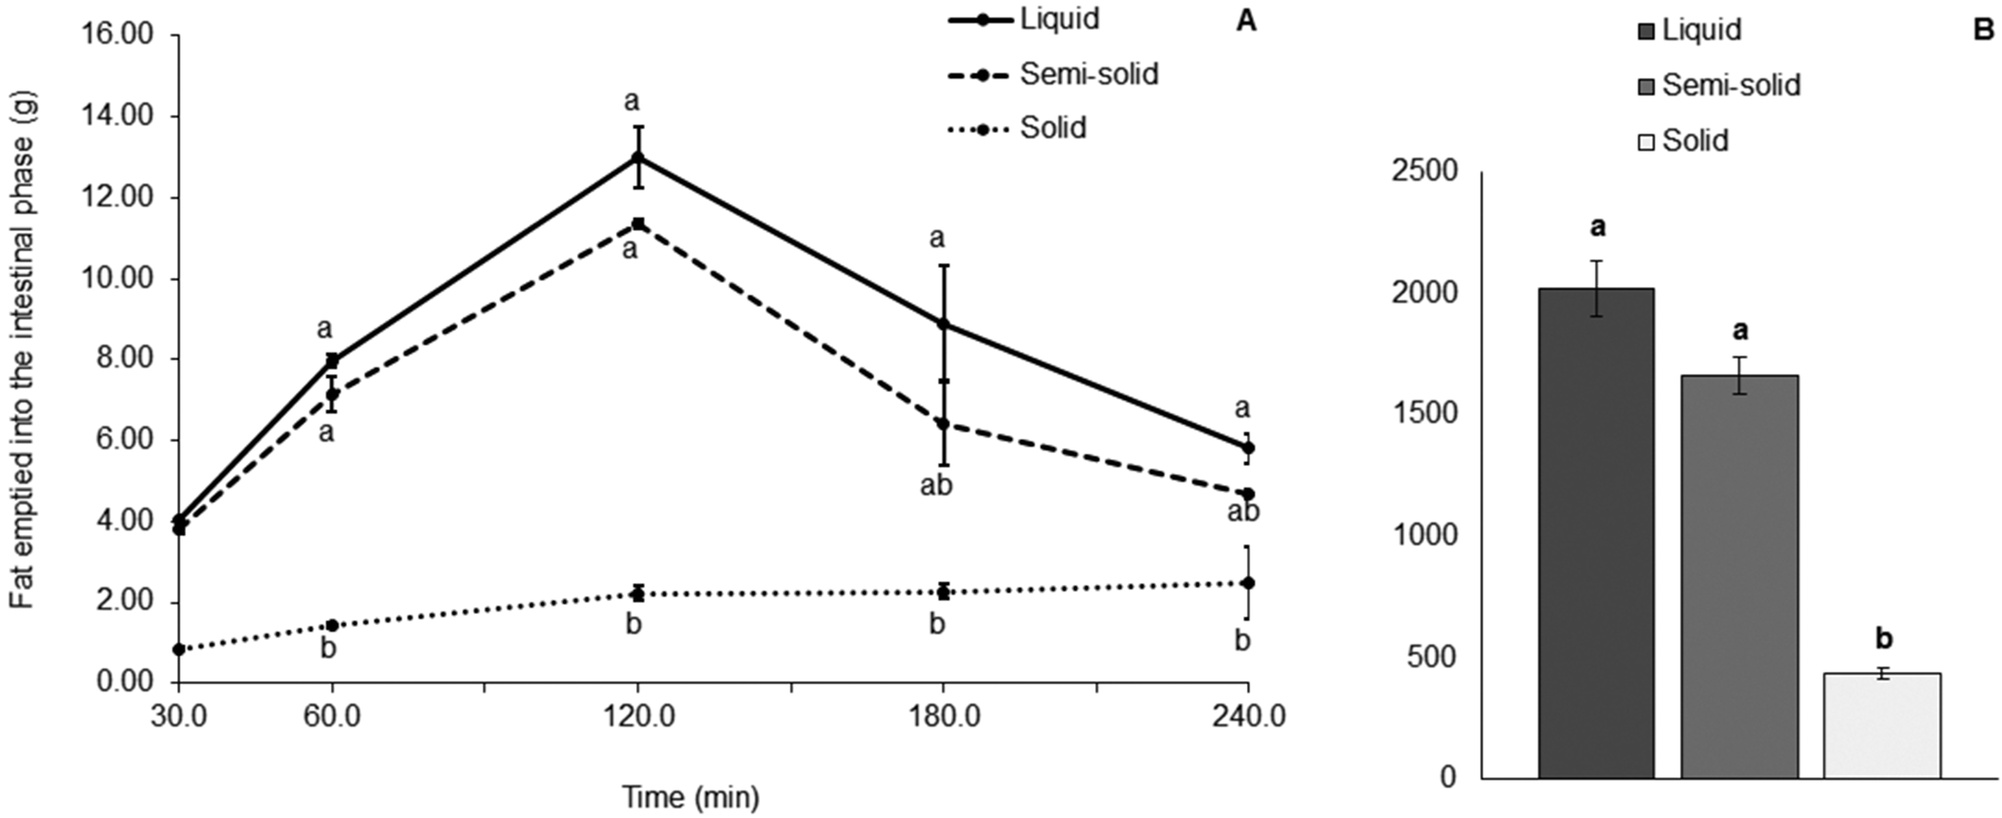 | ||
| Fig. 4 (A) Fat (g) emptied into the intestinal phase (mean ± standard deviation, n = 2) in the aliquots of gastric digesta collected at 30 min, from 45 to 60 min, from 75 to 120 min, from 135 to 180 min and from 195 to 240 min. (B) Fat AUC (mean ± standard deviation, n = 2). Different lowercase letters represent differences between the test foods. | ||
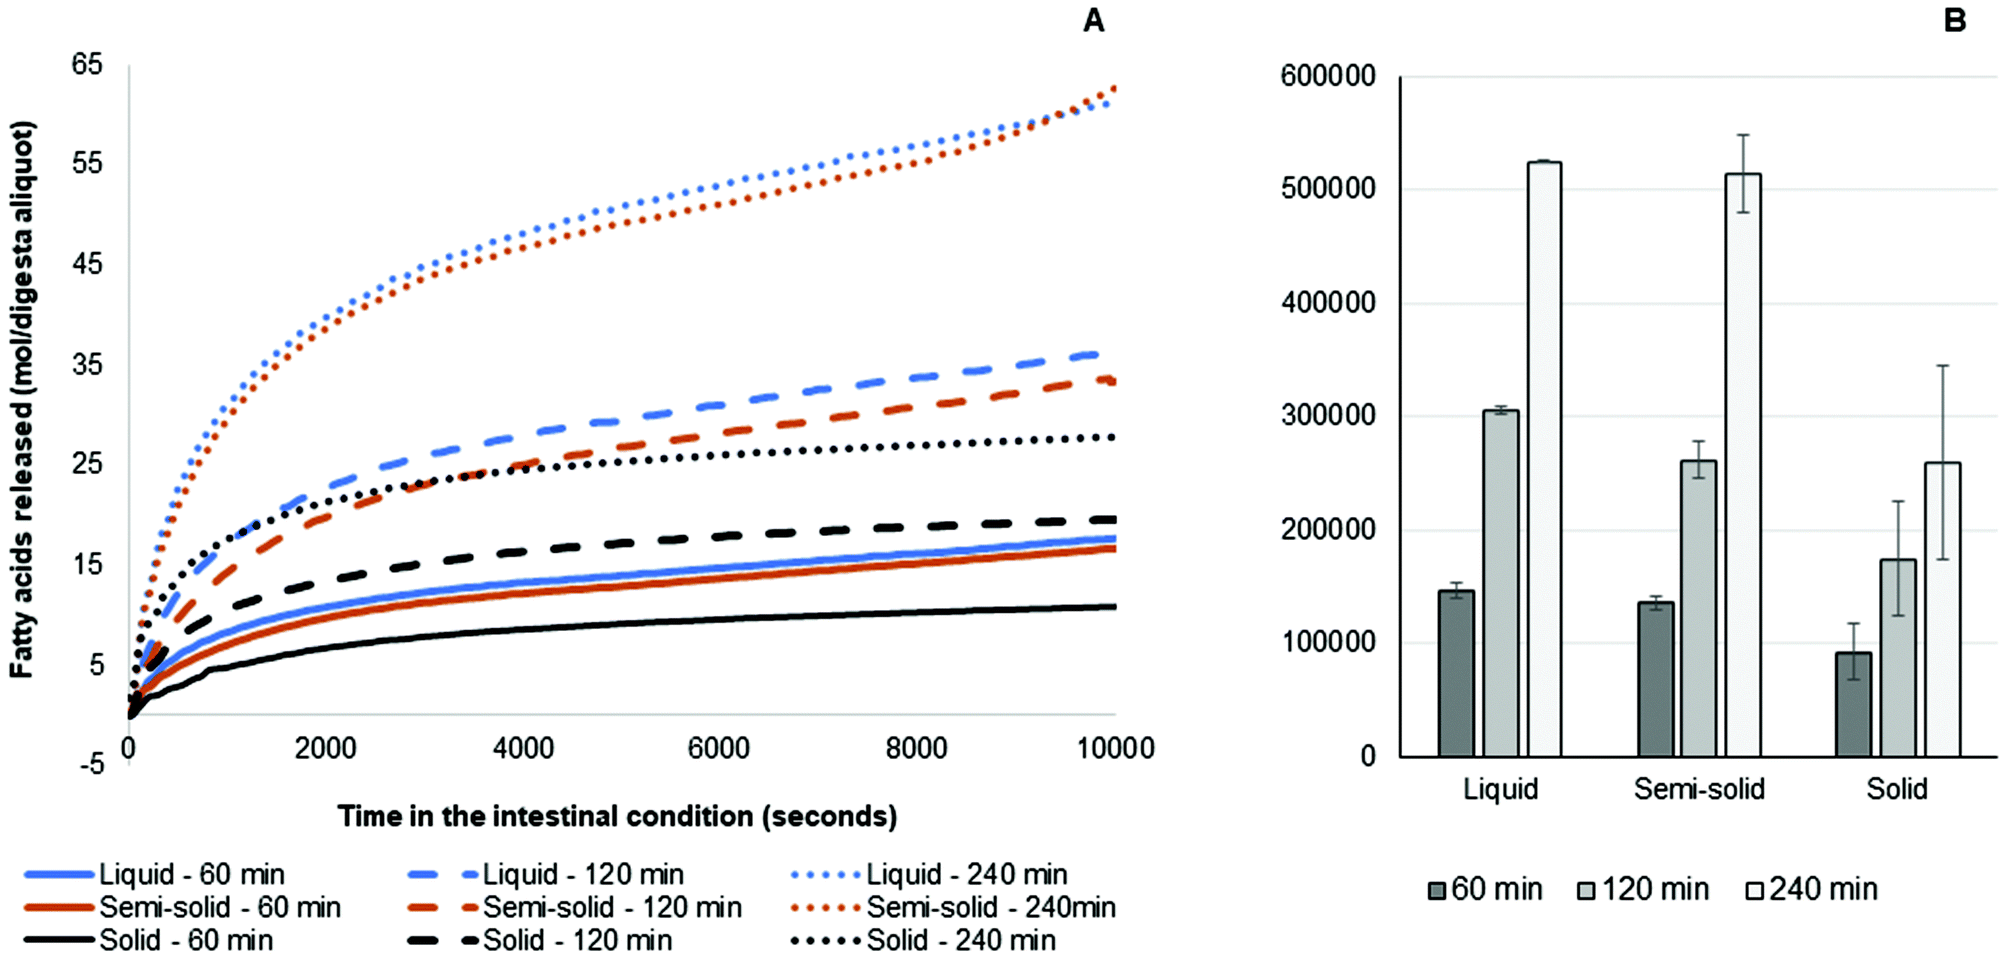 | ||
| Fig. 5 (A) Moles of fatty acid (mean, n = 2) in aliquots of total digesta collected during gastric digestion from 30 to 60 min, 30 to 120 min and 30 to 240 min. (B) Fatty acid AUC (mean ± standard deviation, n = 2). | ||
The fatty acid release results from the simulated intestinal digestion showed a similar trend for all samples. Briefly, the rate of release of fatty acids for all samples was greater in the first 15 min than in the later stages. For the three different pools of gastric digesta aliquots collected, the amounts of fatty acids released were: 240 min >120 min >60 min. This occurred because more fat was discharged from the HGS with the progression of the gastric digestion and more triglycerides were made available for intestinal digestion. The amounts of fatty acids released from the liquid and semi-solid foods were similar, whereas the amount of fatty acids released from the solid food was much lower at the corresponding time points. This was due to the smaller amount of fat in the aliquots of digesta collected during the simulated gastric digestion of the solid food (Fig. 5).
Postprandial intervention
The participants were generally healthy (Table 2). Nutrient intake was not significantly different prior to the three intervention visits for all nutrients except cholesterol [liquid food (304.5 ± 259.2 mg) >solid food (168.7 ± 113.7 mg), p < 0.05] (ESI 3†). Participants consumed the liquid food (13.3 ± 5.1 min) faster than they consumed the solid (21.4 ± 7.9 min, p < 0.001) and semi-solid (24.5 ± 8.4 min, p < 0.001) foods and they consumed the solid food faster than they consumed the semi-solid food (p = 0.009). The average chewing time was not statistically different (p = 0.904) between the solid food (20.0 ± 10.2 s) and the semi-solid food (18.0 ± 8.7 s).| All participants (n = 26) | Males (n = 11) | Females (n = 15) | ||
|---|---|---|---|---|
| Data are presented as mean ± standard deviation. BMI, body mass index; HDL, high density lipoprotein; LDL, low density lipoprotein. | ||||
| Age (years) | 28 ± 5 | 29 ± 4 | 27 ± 5 | |
| BMI (kg m−2) | 23.1 ± 2.6 | 24.3 ± 2.5 | 22.2 ± 2.5 | |
| Percentage body fat | 26.6 ± 7.4 | 25.2 ± 7.6 | 27.6 ± 7.6 | |
| Plasma levels (mmol L−1) of: | ||||
| Glucose | 5.1 ± 0.5 | 5.3 ± 0.5 | 5.0 ± 0.3 | |
| Triglycerides | 1.0 ± 0.6 | 1.3 ± 0.7 | 0.8 ± 0.2 | |
| Total cholesterol | 4.2 ± 0.7 | 4.1 ± 0.8 | 4.3 ± 0.7 | |
| HDL cholesterol | 1.3 ± 0.4 | 1.0 ± 0.2 | 1.5 ± 0.4 | |
| LDL cholesterol | 2.4 ± 0.6 | 2.5 ± 0.6 | 2.4 ± 0.6 | |
| Ethnicity | Asian | 11 (42.3%) | 4 (36.4%) | 7 (46.7%) |
| Middle Easterner | 1 (3.8%) | 1 (9.1%) | 0 (0.0%) | |
| Caucasian | 9 (34.6%) | 3 (27.3%) | 6 (40.0%) | |
| African | 4 (15.4%) | 3 (27.3%) | 1 (6.7%) | |
| Hispanic | 1 (3.8%) | 0 (0.0%) | 1 (6.7%) | |
| Physical activity | Low | 3 (11.5%) | 3 (27.3%) | 0 (0.0%) |
| Moderate | 13 (50.0%) | 6 (54.5%) | 7 (46.7%) | |
| High | 10 (38.5%) | 2 (18.2%) | 8 (53.3%) | |
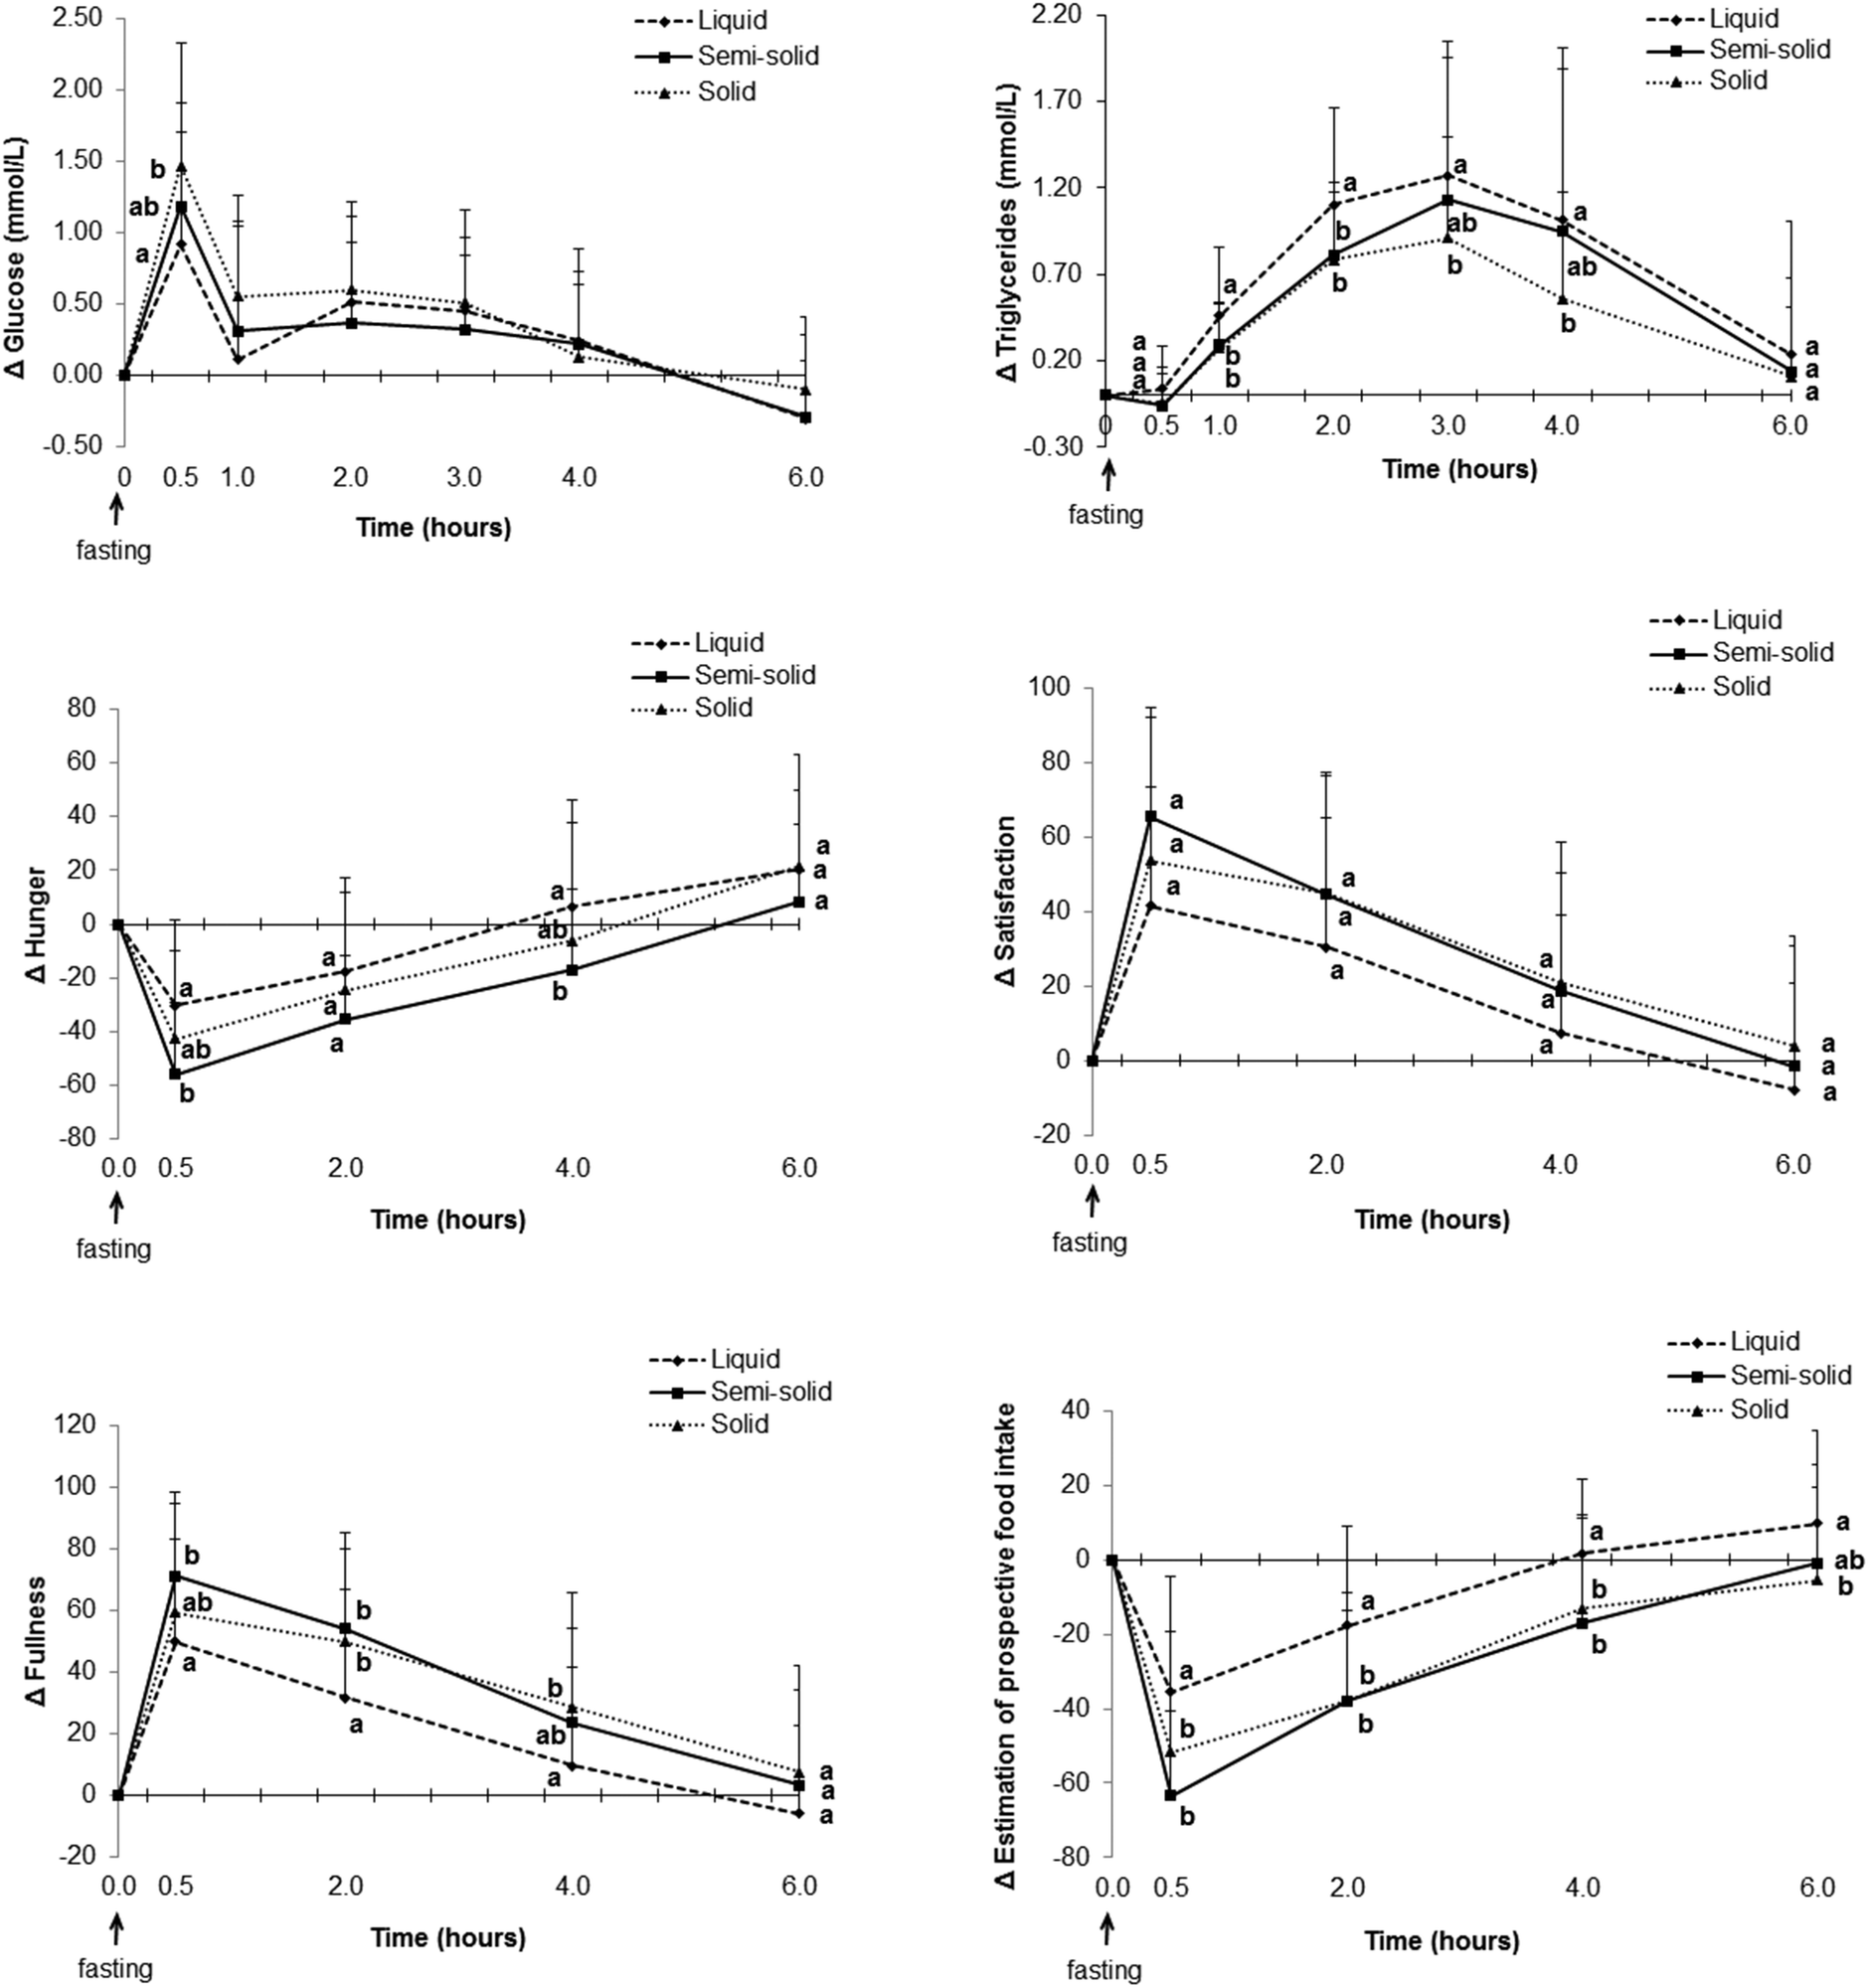 | ||
| Fig. 6 Change in glucose, plasma triglycerides and appetite sensations over 6 h (n = 26). Different lowercase letters represent differences between observations within the same time points (p < 0.05). | ||
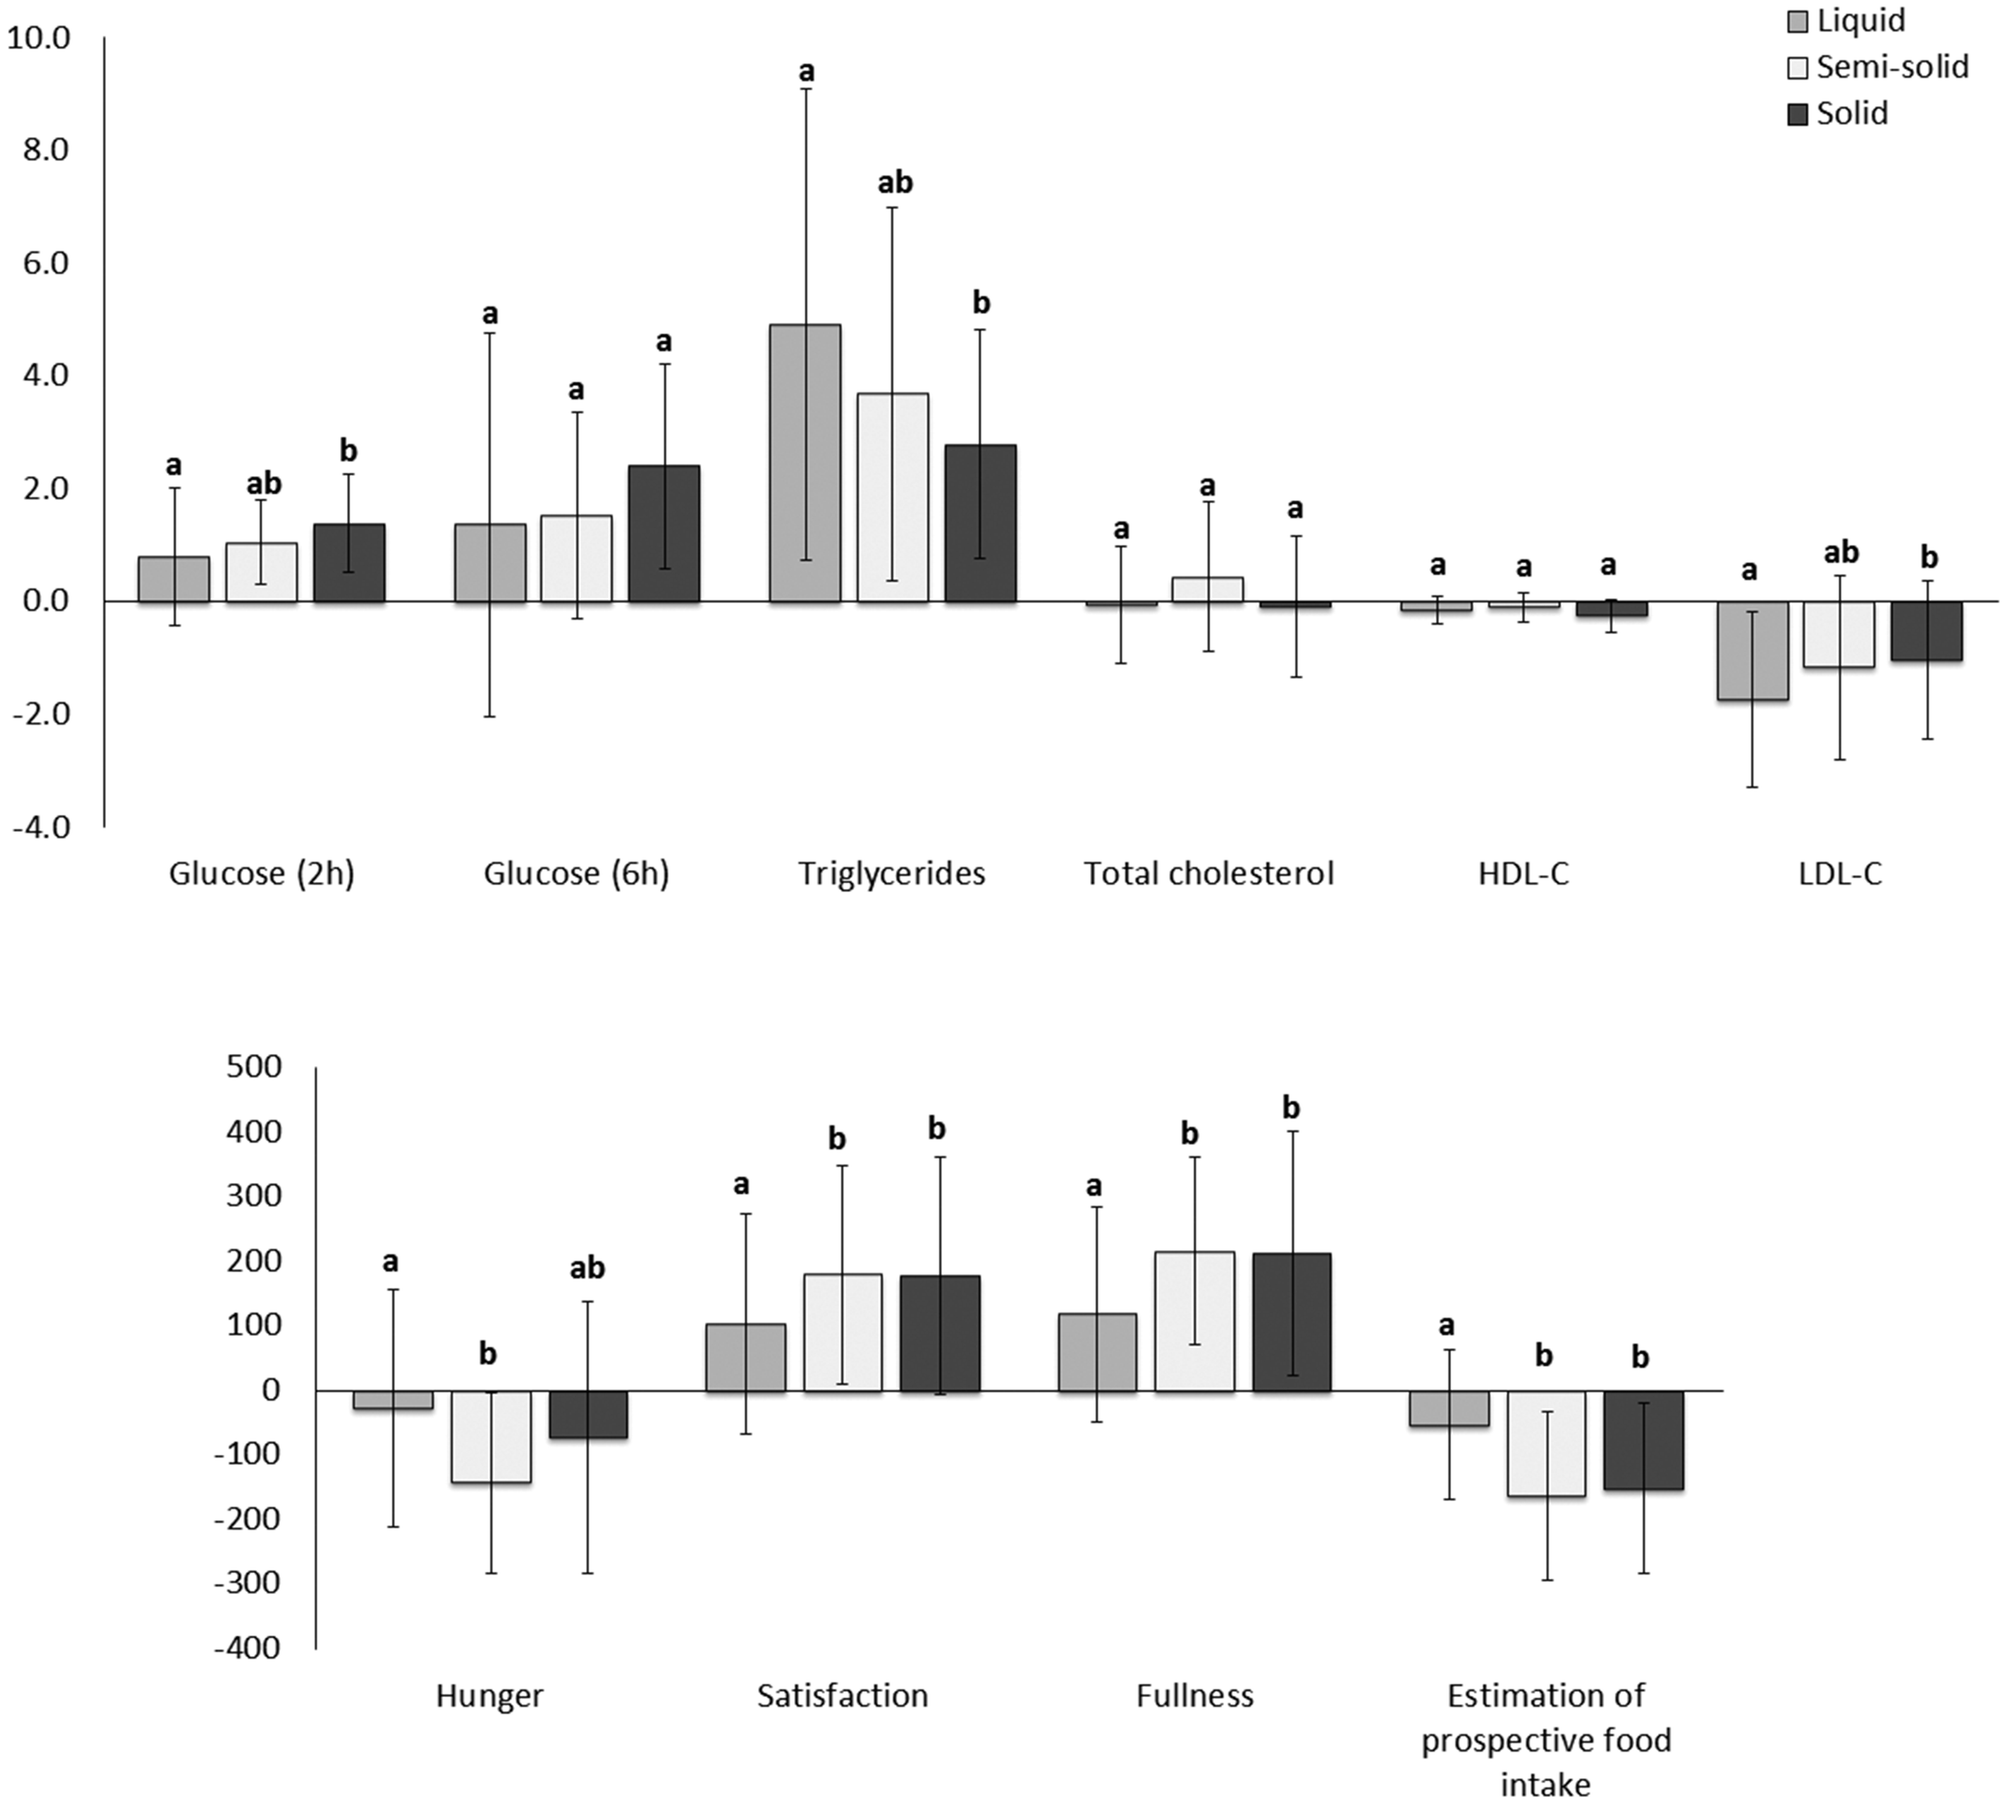 | ||
| Fig. 7 Net area under the postprandial curve for glucose (2 and 6 h post meal consumption), plasma lipids (triglycerides, total cholesterol, LDL cholesterol and HDL cholesterol) and appetite sensations (n = 26). Different lowercase letters represent differences between observations (p < 0.05). | ||
There were no differences between the foods in total cholesterol and HDL cholesterol postprandially. However, the net AUC for change in LDL cholesterol was lower for the liquid food than for the solid food (Fig. 7).
Consumption of the solid food caused higher glucose levels postprandially than consumption of the liquid food (Fig. 6, ESI 4†), especially at the peak time (ESI 5†). The net AUC for changes up until 2 h was significantly greater for the solid food than for the liquid food, although no difference was observed when the full net AUC (up to 6 h) was assessed (Fig. 7).
Higher scores attributed to satisfaction and fullness indicated higher satisfaction and fullness. The fullness and satisfaction net AUCs were lower for the liquid food than for the solid and semi-solid foods (Fig. 7, ESI 6†). The scores attributed to fullness were lower for the liquid food than for the semi-solid food until 2 h postprandially and for the liquid food than for the solid food until 4 h postprandially (Fig. 6, ESI 6†).
Higher scores attributed to estimated prospective intake indicated higher estimation of the desire to eat. Participants estimated a higher prospective intake after consumption of the liquid food than after consumption of the solid and semi-solid foods (Fig. 6 and 7, ESI 6†).
Discussion
This study was designed to determine the effects of iso-caloric foods with a similar nutrient composition but differing in the form and structure on the in vitro lipid digestion profiles and postprandial lipaemic responses. Foods with different forms and structures produced different digestion profiles (in vitro) and postprandial responses (in vivo), for triglycerides, glucose and appetite, indicating that the digestion rate, postprandial triglyceridaemia and glycaemia and appetite could be modulated by manipulating food structures.One of the unique features of this study was the designing of three different foods with distinct structural characteristics, while achieving a similar nutrient composition. The test foods were designed to make up to one-third of a subject's daily macronutrient intake. The ideal amount and kind of whey protein used were crucial to achieve the desirable structure, palatability and mouthfeel. For instance, the use of a large amount of WPC made the liquid and semi-solid foods unpalatable, although producing a desirable structure. The use of WPC392 in the solid food created a chewy product with an undesirable gluey-like mouthfeel, although structurally it would have been acceptable. Additionally, the fact that the oil used was liquid at room temperature was shown to be a challenge in the development of a formulation that would both hold a solid form and be palatable, despite not being a problem in the liquid and semi-solid foods. The choice of the correct ingredient to complement the WPC in the formulation was crucial in achieving the correct texture and palatability in the solid food. For instance, starch did not provide the same texture and structure as the maltodextrin–glucose mixture used. Additionally, due to the similar effect of glucose and maltodextrin on digestion and metabolic responses33 no differences were expected resulting from the different glucose/maltodextrin ratio in the solid food compared to the other foods.
The gastric bolus of the liquid and semi-solid foods remained homogeneous during the 4 h in vitro gastric digestion, with no apparent lipid droplet separation or aggregation, and the lipids were discharged from the HGS homogeneously during the digestion period. In contrast, during the digestion of the solid food, there was phase separation, with the lipid layer clearly separated as the upper layer, resulting in the discharge of most of the lipid volume after the gastric digestion period. This demonstrates that the emulsion was maintained during the digestion of the liquid and semi-solid foods, whereas a heterogeneous system was formed during the digestion of the solid food; as a result, a larger proportion of the fat remained in the HGS after the 4 h of gastric digestion. In accordance with these patterns, postprandial triglyceride responses were greater for the liquid food than for the solid food over 6 h. This can be explained by the rate of discharge of lipids from the stomach. In addition, the solid food presented lipid droplets that were up to four times larger than those in the liquid food, a factor that may also have delayed the hydrolysis of the triglycerides and the release of fatty acids in the small intestine. Feeding studies with dairy products have demonstrated a delay in the plasma triglyceride peak after the consumption of products containing larger fat droplets (butter or cream) compared with those containing smaller fat droplets (milk). These studies have also demonstrated different gastric emptying rates in animals34 and humans.10,14 The size and the interfacial composition of the fat in milk6,7 and other emulsions11 have also been shown to modulate fat hydrolysis in in vitro studies, highlighting the important role of the structure and the oil–water interface in the physiological responses to a food or meal.
The larger triglyceride net AUC measured in vivo after the consumption of the liquid food compared with the solid food indicates that more fat was absorbed over the 6 h experimental period following consumption of the liquid food. The contact of lipids with the ileum and the absorption of lipids trigger a brake mechanism that controls the flux of digesta from the stomach to the small intestine.35,36 Thus, the large amount of fat in the final portion of the gastric digesta resulting from the solid food could have triggered the slow down of the flux of digesta to the small intestine, resulting in a slow and steady absorption of fats in the small intestine. As a consequence, the solid food produced lower postprandial triglyceridaemia, suggesting a lower impact on cardiovascular risk factors (e.g. inflammation markers) compared to the liquid food.
The larger increase in postprandial glucose during the first 2 h post-meal consumption in response to the solid food is in accordance with the in vitro digestion patterns observed. During the digestion of the solid food, with the separation of the oil phase, the concentration of sugars in the aqueous phase would have increased and favoured the absorption of sugars early in the postprandial stages, causing a higher blood glucose peak at 30 min for the solid food than for the liquid food. The higher glucose peak may also be explained by the significantly longer oral processing experienced by the solid food compared to the liquid food and the chewing processes involved in the consumption of the solid food. The solid food was masticated to produce a bolus before swallowing, stimulating the production and secretion of salivary amylase37 and allowing for contact of the food with α-amylase and other salivary juices, initiating the digestion in the mouth.38 Salivary α-amylase is deactivated only at pH lower than 3.839 and, as observed in the in vitro digestion, the pH of the bolus decreased at a slow rate, allowing the action of salivary enzymes. Because of the almost no oral processing of the liquid food and its little contact with saliva, the digestion of its carbohydrate fraction probably started in the small intestine when it came into contact with pancreatic amylase and other enzymes produced in the small intestine.40 The pancreatic response has also been demonstrated to be greater for foods that are masticated than for liquids.38 The different digestion processes experienced by the two foods meant that relatively shorter processing was still necessary before the carbohydrates in the solid food were absorbed, explaining the faster and more marked incorporation of glucose into capillary blood. It has previously been demonstrated that the greater is the number of chews, the higher is the blood glucose level postprandially.5 Nevertheless, the total glucose incorporated into capillary blood 6 h after the consumption of both meals was not statistically different according to the analysis of the net AUC, indicating that the overall absorption of carbohydrates was similar or that a similar postprandial response in circulating blood glucose was triggered over 6 h.
The LDL cholesterol net AUC was lower after the participants consumed the liquid food than the solid food, although no differences were observed in total and HDL cholesterol. An acute consumption of fat triggers the synthesis of chylomicrons and very low density lipoproteins at the expense of LDL particles, thus decreasing the concentration of LDL particles in circulation. According to Nakajima et al.41 and Nakano et al.,42 during a fat load, there is an increase in apolipoprotein B (ApoB48 and ApoB100) from remnant lipoproteins without an increase in total circulating ApoB, because of a concomitant decrease in ApoB100 from LDL particles. This suggests that the concentration of LDL particles may have been reduced during the postprandial experiment, possibly reducing circulating LDL cholesterol.
The appetite sensation assessments indicated that participants were less full and less satisfied after consuming the liquid food than after consuming the solid and semi-solid foods. Participants were also hungrier after consuming the liquid food than the semi-solid food. As oral processing of foods elicits physiological responses because of sensory stimulation of the area,38 differences in time and process during oral processing may modulate satiety responses. The semi-solid and solid foods went through a longer oral processing than the liquid food, suggesting that those foods would have triggered GI responses more efficiently than the liquid food, consequently activating satiety responses more efficiently. Studies suggest that this effect is also consistent with a slower eating behaviour, independent of the fluid viscosity or the food form.2 Additionally, animal and human studies suggest that the consumption of softer foods, reduced chewing cycles and faster eating are associated with body weight gain.3,4,43
As distention of the stomach and the intestine is also involved in satiety mechanisms through stretch receptors,44,45 the volume of the food consumed may determine appetite sensations postprandially. In the present study, air was incorporated into the structure of the semi-solid food during the process of gel formation, whereas all air in the liquid food was dissipated between the time of production and consumption. Thus, the semi-solid food occupied a larger volume, potentially causing a larger distention or stretch of the stomach, inducing more fullness and less hunger immediately after its consumption. Foods with different forms and microstructures may also modulate the digestion rate by either increasing or decreasing the residence time of the bolus in the GI tract.46,47 The longer-lasting fullness observed in this study after consumption of the solid and semi-solid foods suggests that the bolus resided in the GI tract for longer after consumption of the semi-solid and solid foods than after consumption of the liquid food. However, an in vivo study of the gastric emptying rate of the test foods is still necessary to confirm these assumptions.
Participants also estimated a greater prospective food intake after consuming the liquid food than after consuming the solid and semi-solid foods. A similar pattern of estimated prospective food intake was observed in older adults (65 years or older) consuming either a meal-replacement shake or a meal-replacement nutrition bar with equal macronutrient and energy content,12 despite no matching of the total meal mass or volume.
Among the strengths of this study, we should highlight the controlled environment provided to participants as well as the compliance of participants with the study protocol. However, some limitations may have affected the results observed in the present study and should be considered. Mastication and oral processing behaviour were not controlled, as participants were advised to consume the test foods at their normal eating rate as long as consumption was terminated within 30 min, thus increasing the variation between participants. However, total consumption time and chewing cycles were registered.
Liking and palatability of a meal may also affect the rate of consumption of foods and behaviour during oral processing, as people tend to keep foods longer in the mouth if they enjoy the taste. Unfortunately, the palatability of the test foods was not assessed. Additionally, three participants were not able to consume the semi-solid meal because of palatability issues, despite all other participants being able to consume the whole portion. There was an imbalance in the number of men (n = 11) and women (n = 15) in the study, which, because of differences in metabolism in men and women,48 could be a limitation.
Conclusions
The manipulation of food forms and structures did modulate digestion behaviour, postprandial lipaemia and appetite sensations. Independent of the nutrient content, different food structures caused different postprandial lipaemia and glycaemia. The liquid food in this experiment caused low postprandial glycaemia and high postprandial lipaemia, highlighting that foods with a low glycaemic response (or low glycaemic index) may also cause a high lipaemic response and therefore may not be as healthy as thought. Therefore, our results support the importance of the creation of a more comprehensive index or marker of a food or meal healthiness that considers multiple biomarkers instead of a single nutrient or marker.In the future, the design of strategies for weight loss and the prevention of chronic diseases should take into consideration not only the effect of individual nutrients and energy consumption but also the means of delivering of these nutrients, as simple changes in food form and structures may improve both satiety and risk factors for the development of chronic diseases such as cardiovascular disease and type 2 diabetes.
Abbreviations
| ApoB | Apolipoprotein B |
| AUC | Area under the curve |
| D 3,2 | Average surface area |
| GI | Gastrointestinal |
| HDL | High density lipoprotein |
| HGS | Human gastric simulator |
| LDL | Low density lipoprotein |
| SGF | Simulated gastric fluid |
| SIF | Simulated intestinal fluid |
| SSF | Simulated salivary fluid |
| WPC | Whey protein concentrate |
Conflicts of interest
There are no conflicts to declare.Acknowledgements
This research was supported by the Centres of Research Excellence (CoRE) fund from the New Zealand Tertiary Education Commission. The authors are grateful to all volunteers and for the collaboration of Kirsty Blair in the development of the test foods. The authors are grateful to Nisha Panth and Sara Lambert for their contribution in preparing the test foods. The authors are also grateful to Fonterra for kindly donating the whey protein concentrates used in the test foods.References
- D. J. McClements, E. A. Decker, Y. Park and J. Weiss, Designing Food Structure to Control Stability, Digestion, Release and Absorption of Lipophilic Food Components, Food Biophys., 2008, 3, 219–228 CrossRef.
- D. Ferriday, M. L. Bosworth, N. Godinot, N. Martin, C. G. Forde, E. Van Den Heuvel, S. L. Appleton, F. J. Mercer Moss, P. J. Rogers and J. M. Brunstrom, Variation in the Oral Processing of Everyday Meals Is Associated with Fullness and Meal Size; A Potential Nudge to Reduce Energy Intake?, Nutrients, 2016, 8, 315 CrossRef.
- J. Li, N. Zhang, L. Hu, Z. Li, R. Li, C. Li and S. Wang, Improvement in chewing activity reduces energy intake in one meal and modulates plasma gut hormone concentrations in obese and lean young Chinese men, Am. J. Clin. Nutr., 2011, 94, 709–716 CrossRef CAS PubMed.
- Y. Zhu and J. H. Hollis, Relationship between chewing behavior and body weight status in fully dentate healthy adults, Int. J. Food Sci. Nutr., 2015, 66, 135–139 CrossRef PubMed.
- Y. Zhu, W. H. Hsu and J. H. Hollis, Increasing the number of masticatory cycles is associated with reduced appetite and altered postprandial plasma concentrations of gut hormones, insulin and glucose, Br. J. Nutr., 2013, 110, 384–390 CrossRef CAS PubMed.
- A. Berton, S. Rouvellac, B. Robert, F. Rousseau, C. Lopez and I. Crenon, Effect of the size and interface composition of milk fat globules on their in vitro digestion by the human pancreatic lipase: Native versus homogenized milk fat globules, Food Hydrocolloids, 2012, 29, 123–134 CrossRef CAS.
- H. Singh and S. Gallier, Nature's complex emulsion: The fat globules of milk, Food Hydrocolloids, 2017, 68, 81–89 CrossRef CAS.
- S. E. E. Berry, E. A. Tydeman, H. B. Lewis, R. Phalora, J. Rosborough, D. R. Picout and P. R. Ellis, Manipulation of lipid bioaccessibility of almond seeds influences postprandial lipemia in healthy human subjects, Am. J. Clin. Nutr., 2008, 88, 922–929 CrossRef CAS.
- C. E. Berryman, J. A. Grieger, S. G. West, C.-Y. O. Chen, J. B. Blumberg, G. H. Rothblat, S. Sankaranarayanan and P. M. Kris-Etherton, Acute Consumption of Walnuts and Walnut Components Differentially Affect Postprandial Lipemia, Endothelial Function, Oxidative Stress, and Cholesterol Efflux in Humans with Mild Hypercholesterolemia, J. Nutr., 2013, 143, 788–794 CrossRef CAS PubMed.
- C. Vors, G. Pineau, L. Gabert, J. Drai, C. Louche-Pélissier, C. Defoort, D. Lairon, M. Désage, S. Danthine, S. Lambert-Porcheron, H. Vidal, M. Laville and M.-C. Michalski, Modulating absorption and postprandial handling of dietary fatty acids by structuring fat in the meal: a randomized crossover clinical trial, Am. J. Clin. Nutr., 2013, 97, 23–36 CrossRef CAS.
- K. W. J. Tan, L. J. Sun, K. K. T. Goh and C. J. Henry, Lipid droplet size and emulsification on postprandial glycemia, insulinemia and lipidemia, Food Funct., 2016, 7, 4278–4284 RSC.
- H. J. Leidy, J. W. Apolzan, R. D. Mattes and W. W. Campbell, Food form and portion size affect postprandial appetite sensations and hormonal responses in healthy, nonobese, older adults, Obesity, 2010, 18, 293–299 CrossRef CAS PubMed.
- A.-I. Mulet-Cabero, N. M. Rigby, A. Brodkorb and A. R. Mackie, Dairy food structures influence the rates of nutrient digestion through different in vitro gastric behaviour, Food Hydrocolloids, 2017, 67, 63–73 CrossRef CAS.
- G. Clemente, M. Mancini, F. Nazzaro, G. Lasorella, A. Rivieccio, A. M. Palumbo, A. A. Rivellese, L. Ferrara and R. Giacco, Effects of different dairy products on postprandial lipemia, Nutr., Metab. Cardiovasc. Dis., 2003, 13, 377–383 CrossRef CAS.
- L. Marciani, R. Faulks, M. S. J. Wickham, D. Bush, B. Pick, J. Wright, E. F. Cox, A. Fillery-Travis, P. A. Gowland and R. C. Spiller, Effect of intragastric acid stability of fat emulsions on gastric emptying, plasma lipid profile and postprandial satiety, Br. J. Nutr., 2009, 101, 919–928 CrossRef CAS.
- Y. Boirie, M. Dangin, P. Gachon, M.-P. Vasson, J.-L. Maubois and B. Beaufrere, Slow and fast dietary proteins differently modulate postprandial protein accretion, Proc. Natl. Acad. Sci. U. S. A., 1997, 94, 14930–14935 CrossRef CAS.
- M. C. Michalski, C. Genot, C. Gayet, C. Lopez, F. Fine, F. Joffre, J. L. Vendeuvre, J. Bouvier, J. M. Chardigny and K. Raynal-Ljutovac, Multiscale structures of lipids in foods as parameters affecting fatty acid bioavailability and lipid metabolism, Prog. Lipid Res., 2013, 52, 354–373 CrossRef CAS PubMed.
- C. B. Dias, P. J. Moughan, L. G. Wood, H. Singh and M. L. Garg, Postprandial lipemia: factoring in lipemic response for ranking foods for their healthiness, Lipids Health Dis., 2017, 16, 178 CrossRef.
- M. Carstensen, C. Thomsen, O. Gotzsche, J. J. Holst, J. Schrezenmeir and K. Hermansen, Differential Postprandial Lipoprotein Responses in Type 2 Diabetic Men with and without Clinical Evidence of a Former Myocardial Infarction, Rev. Diabet. Stud., 2004, 1, 175–184 CrossRef PubMed.
- A. Pirillo, G. D. Norata and A. L. Catapano, Postprandial lipemia as a cardiometabolic risk factor, Curr. Med. Res. Opin., 2014, 30, 1489–1503 CrossRef CAS.
- K. G. Jackson, S. D. Poppitt and A. M. Minihane, Postprandial lipemia and cardiovascular disease risk: Interrelationships between dietary, physiological and genetic determinants, Atherosclerosis, 2012, 220, 22–33 CrossRef CAS.
- A. Aljada, P. Mohanty, H. Ghanim, T. Abdo, D. Tripathy, A. Chaudhuri and P. Dandona, Increase in intranuclear nuclear factor κB and decrease in inhibitor κB in mononuclear cells after a mixed meal: evidence for a proinflammatory effect, Am. J. Clin. Nutr., 2004, 79, 682–690 CrossRef CAS.
- C. Patel, H. Ghanim, S. Ravishankar, C. L. Sia, P. Viswanathan, P. Mohanty and P. Dandona, Prolonged reactive oxygen species generation and nuclear factor-kappaB activation after a high-fat, high-carbohydrate meal in the obese, J. Clin. Endocrinol. Metab., 2007, 92, 4476–4479 CrossRef CAS.
- F. Kim, M. Pham, I. Luttrell, D. D. Bannerman, J. Tupper, J. Thaler, T. R. Hawn, E. W. Raines and M. W. Schwartz, Toll-Like Receptor-4 Mediates Vascular Inflammation and Insulin Resistance in Diet-Induced Obesity, Circ. Res., 2007, 100, 1589–1596 CrossRef CAS PubMed.
- M. Nikkilä, T. Solakivi, T. Lehtimaki, T. Koivula, P. Laippala and B. Aström, Postprandial plasma lipoprotein changes in relation to apolipoprotein E phenotypes and low density lipoprotein size in men with and without coronary artery disease, Atherosclerosis, 1994, 106, 149–157 CrossRef.
- A. J. H. H. M. van Oostrom, T. P. Sijmonsma, C. Verseyden, E. H. J. M. Jansen, E. J. P. de Koning, T. J. Rabelink and M. Castro Cabezas, Postprandial recruitment of neutrophils may contribute to endothelial dysfunction, J. Lipid Res., 2003, 44, 576–583 CrossRef CAS PubMed.
- S. Marchesi, G. Lupattelli, G. Schillaci, M. Pirro, D. Siepi, A. R. Roscini, L. Pasqualini and E. Mannarino, Impaired flow-mediated vasoactivity during post-prandial phase in young healthy men, Atherosclerosis, 2000, 153, 397–402 CrossRef CAS.
- R. A. Vogel, M. C. Corretti and G. D. Plotnick, Effect of a Single High-Fat Meal on Endothelial Function in Healthy Subjects, Am. J. Cardiol., 1997, 79, 350–354 CrossRef CAS.
- Q. Guo, A. Ye, M. Lad, D. Dalgleish and H. Singh, Effect of gel structure on the gastric digestion of whey protein emulsion gels, Soft Matter, 2014, 10, 1214–1223 RSC.
- Q. Guo, N. Bellissimo and D. Rousseau, The Physical State of Emulsified Edible Oil Modulates Its in Vitro Digestion, J. Agric. Food Chem., 2017, 65, 9120–9127 CrossRef CAS.
- M. Minekus, M. Alminger, P. Alvito, S. Ballance, T. Bohn, C. Bourlieu, F. Carriere, R. Boutrou, M. Corredig, D. Dupont, C. Dufour, L. Egger, M. Golding, S. Karakaya, B. Kirkhus, S. Le Feunteun, U. Lesmes, A. Macierzanka, A. Mackie, S. Marze, D. J. McClements, O. Menard, I. Recio, C. N. Santos, R. P. Singh, G. E. Vegarud, M. S. Wickham, W. Weitschies and A. Brodkorb, A standardised static in vitro digestion method suitable for food - an international consensus, Food Funct., 2014, 5, 1113–1124 RSC.
- A. Flint, A. Raben, J. E. Blundell and A. Astrup, Reproducibility, power and validity of visual analogue scales in assessment of appetite sensations in single test meal studies, Int. J. Obes., 2000, 24, 38–48 CrossRef CAS.
- L. D. Hofman, V. J. van Buul and F. J. P. H. Brouns, Nutrition, Health, and Regulatory Aspects of Digestible Maltodextrins, Crit. Rev. Food Sci. Nutr., 2016, 56, 2091–2100 CrossRef.
- M.-C. Michalski, Specific molecular and colloidal structures of milk fat affecting lipolysis, absorption and postprandial lipemia, Eur. J. Lipid Sci. Technol., 2009, 111, 413–431 CrossRef CAS.
- P. W. Maljaars, H. P. Peters, D. J. Mela and A. A. Masclee, Ileal brake: a sensible food target for appetite control. A review, Physiol. Behav., 2008, 95, 271–281 CrossRef CAS.
- R. C. Spiller, I. F. Trotman, T. E. Adrian, S. R. Bloom, J. J. Misiewicz and D. B. Silk, Further characterisation of the ‘ileal brake’ reflex in man–effect of ileal infusion of partial digests of fat, protein, and starch on jejunal motility and release of neurotensin, enteroglucagon, and peptide YY, Gut, 1988, 29, 1042–1051 CrossRef CAS.
- N. Rohleder and U. M. Nater, Determinants of salivary alpha-amylase in humans and methodological considerations, Psychoneuroendocrinology, 2009, 34, 469–485 CrossRef CAS.
- R. D. Mattes, Dietary Compensation by Humans for Supplemental Energy Provided as Ethanol or Carbohydrate in Fluids, Physiol. Behav., 1996, 59, 179–187 CrossRef CAS.
- M. Fried, S. Abramson and J. H. Meyer, Passage of Salivary Amylase Through the Stomach in Humans, Dig. Dis. Sci., 1987, 32, 1097–1103 CrossRef CAS.
- R. Holmes, Carbohydrate digestion and absorption, J. Clin. Pathol., Suppl. (R. Coll. Pathol.), 1971, 5, 10–13 CrossRef.
- K. Nakajima, T. Nakano, Y. Tokita, T. Nagamine, A. Inazu, J. Kobayashi, H. Mabuchi, K. L. Stanhope, P. J. Havel, M. Okazaki, M. Ai and A. Tanaka, Postprandial lipoprotein metabolism: VLDL vs chylomicrons, Clin. Chim. Acta, 2011, 412, 1306–1318 CrossRef CAS PubMed.
- T. Nakano, A. Tanaka, M. Okazaki, Y. Tokita, T. Nagamine and K. Nakajima, Particle size of apoB-48 carrying lipoproteins in remnant lipoproteins isolated from postprandial plasma, Ann. Clin. Biochem., 2011, 48, 57–64 CrossRef CAS PubMed.
- A. Sakuarae, T. Fujise, H. Yoshimatsu, T. Sakata and M. Nakata, Food texture differences affect energy metabolism in rats, J. Dent. Res., 2003, 82, 491–494 CrossRef.
- E. Almiron-Roig, Y. Chen and A. Drewnowski, Liquid calories and the failure of satiety: how good is the evidence?, Obes. Rev., 2003, 4, 201–212 CrossRef CAS.
- E. K. Williams, R. B. Chang, D. E. Strochlic, B. D. Umans, B. B. Lowell and S. D. Liberles, Sensory Neurons that Detect Stretch and Nutrients in the Digestive System, Cell, 2016, 166, 209–221 CrossRef CAS PubMed.
- G. M. Bornhorst and R. Paul Singh, Gastric digestion in vivo and in vitro: how the structural aspects of food influence the digestion process, Annu. Rev. Food Sci. Technol., 2014, 5, 111–132 CrossRef CAS PubMed.
- Q. Guo, A. Ye, M. Lad, D. Dalgleish and H. Singh, Behaviour of whey protein emulsion gel during oral and gastric digestion: effect of droplet size, Soft Matter, 2014, 10, 4173–4183 RSC.
- C. Koutsari, A. Zagana, I. Tzoras, L. S. Sidossis and A. L. Matalas, Gender influence on plasma triacylglycerol response to meals with different monounsaturated and saturated fatty acid content, Eur. J. Clin. Nutr., 2004, 58, 295–502 CrossRef PubMed.
Footnotes |
| † Electronic supplementary information (ESI) available. See DOI: 10.1039/c8fo01698d |
| ‡ C. B. Dias is now at the Department of Biomedical Sciences, Macquarie University, Sydney, NSW, Australia. |
| This journal is © The Royal Society of Chemistry 2019 |