 Open Access Article
The electrostatic potential as a descriptor for the protonation propensity in automated exploration of reaction mechanisms†
Stephanie A.
Grimmel
 and
Markus
Reiher
 *
*
Laboratory of Physical Chemistry, ETH Zürich, Vladimir-Prelog-Weg 2, 8093 Zürich, Switzerland. E-mail: markus.reiher@phys.chem.ethz.ch; Tel: +41 446334308
First published on 12th June 2019
Abstract
We discuss the possibility of exploiting local minima of the molecular electrostatic potential for locating protonation sites in molecules in a fully automated manner. We implement and apply this concept to exploring the mechanism of proton reduction catalyzed by a hydrogenase model complex [Orthaber et al., Dalton Trans., 2014, 43, 4537]. A large number of distinct structures arising already in the early stages of the hydrogen evolution mechanism demonstrates the need for reliable, automated algorithms for the thorough analysis of catalytic processes.
Introduction
Catalysis, such as organometallic catalytic processes,1 often involves complex reaction mechanisms comprising many elementary steps for the catalytic cycle, side reactions, decomposition reactions and so forth. They must be explored on many different potential energy surfaces, rendering their manual exploration unfeasible. The manual investigation of reaction networks with quantum chemical methods is not only tedious, error prone, and cumbersome, it is usually also limited to reactions expected to be relevant based on existing experimental knowledge. As a consequence, unexpected or unknown, yet possibly important, reaction steps are likely to remain undiscovered. It is for this reason that automated exploration algorithms are indispensable. Over the last decade, significant progress in their development has been achieved (for recent reviews see ref. 2–4).In this study, we focus on the problem of automatically identifying protonation sites, which also implies the assessment of protonation propensities.5 We explore the suitability of the molecular electrostatic potential (MESP) evaluated for equilibrium and distorted species for this purpose. Following our ‘first-principles heuristics’ strategy2,6–8 to fight the combinatorial explosion of potential reaction pathways, the MESP is evaluated from the electronic wave function. In previous work, we considered a related idea for the Schrock dinitrogen-fixation catalyst to rationalize the mechanism of catalytic ammonia production.6 In this earlier work, protonation sites were assumed to be located on open coordination sites of selected atoms as determined from geometric data as well as validated by a descriptor evaluated from the electron localization function and the MESP. In contrast to this earlier work, the algorithm to be presented in this work exploits the topology of the MESP pointing to specific protonation positions in real space. As such, it is, in principle, applicable to arbitrary chemical systems.
With this descriptor we then explore parts of a reaction network arising from sequential protonation and reduction steps for an organometallic hydrogenase model complex 1 synthesized by Ott et al.9 (see Fig. 1), which catalyzes the electrocatalytic reduction of protons to molecular hydrogen.9
 | ||
| Fig. 1 A conformational isomer of the hydrogenase model complex 1 synthesized by Ott et al.9 | ||
The production of molecular hydrogen in an efficient and sustainable manner is one of the key challenges in establishing a “Hydrogen Economy”.10 Hydrogenases are enzymes that catalyze the reversible conversion of protons to molecular hydrogen. Their active sites are based on abundant metals.11 That is why numerous model complexes mimicking these active sites have been synthesized as an attempt to generate alternatives for noble metal based catalysts.12–14 Because of the fact that [FeFe]-hydrogenases show the highest catalytic activity in hydrogen production, model complexes of their active center have been of particular interest,15 and the enzymatic mechanism was studied in detail from a theoretical point of view.16–21 The activity of structural model complexes has, however, been limited by the formation of highly stable hydrides bridging the two iron centers,9,22,23 which is avoided in the enzyme due to kinetic factors.24 As a consequence, mononuclear compounds, such as the one studied in this work, that do not suffer from this problem, appear to be promising candidates for efficient hydrogen production catalysts.25,26
The necessity to apply an automated exploration algorithm in order to thoroughly study the mechanism of proton reduction catalyzed by complex 1 arises from the presence of multiple protonation sites: next to the amine nitrogen atoms and the thiolate sulfur atoms, protonations of the iron center, the carbonyl ligand and the aromatic rings appear likely. Considering all of these possibilities, and especially, their combinations in a manual investigation is obviously unfeasible. Another layer of complexity, which is also handled automatically in our set-up, arises from the fact, that complex 1 can exist in different conformations:9 the six-membered FePCNCP rings can each occur in either a boat or a chair conformation and various orientations of the phenyl substituents on the nitrogen atoms have to be considered.
In this work, we first consider the identification of local minima of the MESP as the starting point for an automated protonation algorithm. We study prototypical molecules with well-defined protonation sites and finally turn our attention to the hydrogenase model catalyst.
The molecular electrostatic potential
The MESP is the Coulomb potential at position r in space evaluated from the source charges of the nuclear framework and from the electronic charge distribution. For the former, the corresponding Poisson integral reduces to a sum of potential terms from the nuclear point charges. In atomic units, the electrostatic potential V of a molecule then reads | (1) |
Since the MESP can be calculated directly from the electronic density and structural information, it can be easily obtained from the results of standard quantum chemical calculations. In contrast to many other quantities that are used for reactivity predictions, such as atomic charges or electronegativity, it has a rigorous physical definition and can also be obtained experimentally. This is why, starting from the work of Scrocco and Tomasi,27,28 the MESP has often been analyzed to gain information about the reactivity of chemical systems.29,30
Approximating a proton as a point charge, the magnitude and sign of the electrostatic potential V(r) equal the Coulomb interaction energy of a proton at position r with the field under consideration. Hence, considering points with a low MESP as potential protonation sites is a natural choice for a first-principles descriptor.
Topological analyses have shown that local minima of the MESP correspond to lone pairs, π-systems or other valleys of high electron concentration and therefore to preferred sites for electrophilic attacks.31–33 In investigations of the nucleobases Pullman and coworkers demonstrated that the preferred sites of protonation coincide with the lowest MESP valleys.34,35
All of these results serve as a motivation to determine local minima of the MESP as a starting point for locating likely protonation sites.
It was shown previously33,36 that local minima of the MESP tend to be located in the proximity of the van der Waals surface. While those corresponding to lone pairs are typically found within or very close to the van der Waals spheres, those arising from π-systems are expected to be further away from the nuclei.
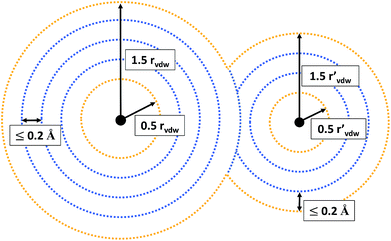
Since we want to capture both of these types, we evaluate the MESP on a grid composed of multiple, non-overlapping spheres centered around every atom of the molecule under consideration. The smallest sphere radius was set to half and the largest one to one and a half times the corresponding atom’s van der Waals radius,37rvdW. Equidistant intermediate grid spheres were added in such a way that the difference in radii between adjacent spheres was no larger than 0.2 Å. On each individual sphere the grid point density was set to 25 points per Å2.
For all grid points located in the inner part of the grid (see Fig. 2 for an illustration), it is evaluated whether their MESP is minimal in comparison to all other grid points within a distance of 0.5 Å. Grid points on the outer part of the grid are not considered to be potential minima, but included as reference points. Otherwise there would be the risk of falsely identifying minima on the outermost grid spheres due to the lack of MESP values available for comparison around them. E.g., for a neutral atom, for which the ESP decreases radially monotonically with increasing distance from the nucleus,38 small numerical inaccuracies could result in the detection of fictitious minima on the outer part of the grid.
Computational methodology
The implementation of our MESP-based protonation algorithm was designed to be part of our general software framework SCINE,39 of which the module CHEMOTON8 orchestrates automated reaction exploration. In particular, functionalities of CHEMOTON that submit Cartesian coordinates to quantum chemistry programs (here, ORCA, see below) for electronic energy calculation and structure optimization were extended and heavily exploited by our implementation.Our implementation also makes extensive use of the SCINE module MOLASSEMBLER.40 MOLASSEMBLER is a C++ library that provides the functionality for generating guess structures of conformers of a given molecule based on distance geometry.41–43 Furthermore, MOLASSEMBLER was applied when analyzing structures in terms of their connectivity, i.e. the ensemble of bonds (evaluated from Mayer bond orders44,45 calculated from the electronic wave function) connecting atoms characterized by their elemental types. It also allows for determining the idealized symmetry corresponding to the ligand configuration around central atoms.
The raw-data structure optimizations were carried out with the PBE exchange correlation functional46,47 as implemented in the program ORCA, version 4.0.1.48,49 The electronic density required for the MESP was obtained with the PBE0 functional.50 We chose the def2-SVP basis set51 with the density-fitting resolution of the identity (RI) and RIJCOSX approximations through the def2/J auxiliary basis set.52,53
In all quantum chemical calculations carried out on the hydrogenase model complexes, we employed Grimme’s D3BJ dispersion correction54 (so that dispersion effects are taken into account in structure optimizations) and the conductor-like polarizable continuum model with an dielectric constant of 36.6 and a refractive index of 1.344 mimicking acetonitrile.55–58
For all structures the smallest possible multiplicity, i.e. singlet states for molecules with an even number of electrons and doublet states otherwise, was assumed. For the former, a closed-shell (restricted) Kohn–Sham framework was chosen, the latter were considered in a spin-unrestricted framework.
Throughout this study electronic energies without zero-point corrections are reported.
Results and discussion
Automated localization of protonation sites
We first investigate our concept at a set of small prototypical systems for which we determined local minima of the MESP as described above (see Fig. 3). By positioning protons according to these positions, we obtain guess structures for the relevant protonated species. These guess structures were then optimized to arrive at local minimum structures on the corresponding Born–Oppenheimer potential energy surfaces. From the electronic energies of the resulting protonated species we approximate protonation energies (lacking vibrational and temperature corrections). These results are reported in Table 1. We report the MESP in units of energy as it interacts with a single positive elementary charge in our case. The direct comparison with the protonation energies highlights the decisive effect of electronic and structural reorganisation after protonation.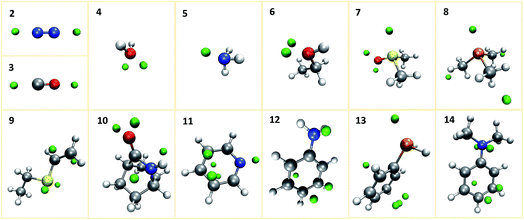 | ||
| Fig. 3 Prototypical systems with green spheres positioned at MESP minima. (H: white, C: gray, N: blue, O: red, P: orange, S: yellow). | ||
| System | Type | MESP (kJ mol−1) | d MESP (Å) | d MESP/rvdW | d H (Å) | d H/rvdW | E prot (kJ mol−1) | |
|---|---|---|---|---|---|---|---|---|
| 2 | N2 | N | −51 | 1.6 | 1.0 | 1.1 | 0.7 | −528 |
| 2 | N2 | N | −51 | 1.6 | 1.0 | 1.1 | 0.7 | −528 |
| 3 | CO | C | −81 | 1.6 | 0.9 | 1.1 | 0.7 | −626 |
| 3 | CO | O | −32 | 1.5 | 1.0 | 1.0 | 0.7 | −457 |
| 4 | H2O | O | −248 | 1.1 | 0.8 | 1.0 | 0.7 | −750 |
| 4 | H2O | O | −248 | 1.1 | 0.8 | 1.0 | 0.7 | −750 |
| 5 | NH3 | N | −344 | 1.2 | 0.8 | 1.0 | 0.7 | −909 |
| 6 | Ethanol | O | −223 | 1.2 | 0.8 | 1.0 | 0.7 | −815 |
| 6 | Ethanol | O | −223 | 1.2 | 0.8 | 1.0 | 0.7 | −815 |
| 7 | DMSO | S | −40 | 2.0 | 1.1 | 1.4 | 0.8 | −791 |
| 7 | DMSO | O; towards S | −276 | 1.2 | 0.8 | 1.0 | 0.6 | −937 |
| 7 | DMSO | O | −264 | 1.2 | 0.8 | 1.0 | 0.6 | −923 |
| 8 | Trimethylphosphine | P | −168 | 1.8 | 1.0 | 1.4 | 0.8 | −972 |
| 8 | Trimethylphosphine | H | −6 | 1.9 | 1.7 | 1.1 | 0.7 | −735 |
| 8 | Trimethylphosphine | H | −6 | 1.9 | 1.7 | 1.1 | 0.7 | −734 |
| 8 | Trimethylphosphine | H | −6 | 1.9 | 1.7 | 1.1 | 0.7 | −743 |
| 9 | Ethylvinyl sulfide | C | −93 | 1.6 | 0.9 | 1.1 | 0.7 | −912 |
| 9 | Ethylvinyl sulfide | C | −88 | 1.8 | 1.1 | 1.1 | 0.7 | −912 |
| 9 | Ethylvinyl sulfide | S | −111 | 1.8 | 1.0 | 1.4 | 0.8 | −846 |
| 9 | Ethylvinyl sulfide | S; aligned with vinyl π-system | −112 | 1.8 | 1.0 | 1.4 | 0.8 | −853 |
| 10 | Isonortropinone | N | −33 | 1.6 | 1.0 | 1.0 | 0.7 | −890 |
| 10 | Isonortropinone | N | −33 | 1.6 | 1.0 | 1.0 | 0.7 | −890 |
| 10 | Isonortropinone | O; towards N | −253 | 1.1 | 0.8 | 1.0 | 0.6 | −941 |
| 10 | Isonortropinone | O | −263 | 1.1 | 0.7 | 1.0 | 0.6 | −951 |
| 11 | Pyridine | N | −267 | 1.2 | 0.8 | 1.0 | 0.7 | −970 |
| 11 | Pyridine | Cmeta | −36 | 2.0 | 1.2 | 1.1 | 0.7 | −745 |
| 11 | Pyridine | Cmeta | −36 | 2.1 | 1.2 | 1.1 | 0.7 | −745 |
| 11 | Pyridine | Cmeta | −36 | 2.1 | 1.2 | 1.1 | 0.7 | −745 |
| 11 | Pyridine | Cmeta | −36 | 2.1 | 1.2 | 1.1 | 0.7 | −745 |
| 12 | Aniline | Cortho | −102 | 1.9 | 1.1 | 1.1 | 0.7 | −901 |
| 12 | Aniline | Cpara; N ring side | −105 | 1.9 | 1.1 | 1.1 | 0.7 | −918 |
| 12 | Aniline | Cpara; H ring side | −100 | 1.8 | 1.1 | 1.1 | 0.7 | −918 |
| 12 | Aniline | N | −180 | 1.4 | 0.9 | 1.0 | 0.7 | −912 |
| 13 | Phenylphosphine | Cortho; P ring side | −66 | 2.0 | 1.2 | 1.1 | 0.7 | −812 |
| 13 | Phenylphosphine | Cpara | −62 | 2.0 | 1.2 | 1.1 | 0.7 | −826 |
| 13 | Phenylphosphine | Cpara | −62 | 2.0 | 1.2 | 1.1 | 0.7 | −826 |
| 13 | Phenylphosphine | Cortho; H ring side | −62 | 2.0 | 1.2 | 1.1 | 0.7 | −815 |
| 13 | Phenylphosphine | P | −110 | 1.8 | 1.0 | 1.4 | 0.8 | −887 |
| 14 | N,N-Dimethylaniline | Cpara | −109 | 1.9 | 1.1 | 1.1 | 0.7 | −938 |
| 14 | N,N-Dimethylaniline | Cpara | −109 | 1.9 | 1.1 | 1.1 | 0.7 | −938 |
| 14 | N,N-Dimethylaniline | Cortho | −106 | 1.9 | 1.1 | 1.1 | 0.7 | −930 |
| 14 | N,N-Dimethylaniline | N | −53 | 1.5 | 1.0 | 1.0 | 0.7 | −953 |
| 14 | N,N-Dimethylaniline | N | −55 | 1.6 | 1.0 | 1.0 | 0.7 | −953 |
Our algorithm succeeded in localizing all protonation sites arising from lone pairs. Further, local minima were detected on both sides of the double bond of ethylvinyl sulfide and on aromatic rings. It is worth pointing out that for aniline, N,N-dimethylaniline, and pyridine the preferred sites for electrophilic aromatic substitutions are detected, i.e. the para-position for the aniline derivates and the meta-positions for pyridine. For aniline derivates and phenylphosphine additional minima are detected in proximity to the ortho-positions of the aromatic rings. The ortho-positions are expected to be the second best sites for electrophilic attacks on these structures. However, it is striking that not all of these sites are detected. E.g., for N,N-dimethylaniline only one ortho-protonation site on one side of the ring was detected, while we expected both ortho-positions on both sides of the ring to be equivalent. The MESP isosurfaces depicted in Fig. 4 suggest that there are differences with regard to the ring sides within the MESP itself, arising from small deviations of the fully optimized molecular structure from C2v symmetry. Possible remedies for this issue include the application of a more extensive and/or finer grid on which MESP minima are located and a less conservative requirement for a point to be considered a local minimum.
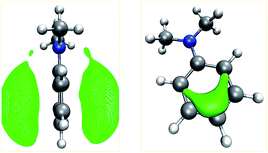 | ||
| Fig. 4 Isosurfaces (green) of the MESP of N,N-dimethylaniline at values of −53 kJ mol−1 (left) and −105 kJ mol−1 (right). | ||
Unanticipated are also the three local minima detected on the methyl groups of trimethylphosphine. They are located far away from the nuclear coordinates (as can be seen in Table 1). The reason why their distance to the closest atom is larger than one and a half times their van der Waals radius is due to the fact that the grid points on which they are located belong to the spheres generated around other atoms. The corresponding MESP values are very close to zero. Our framework allows for the exclusion of MESP minima with values above a certain threshold. However, we refrain from applying this exclusion rule here: for our objective of automated exploration of a reaction network, it is more important not to miss any possibly relevant protonation reactions, rather than limiting the number of calculations to the absolute minimum necessary. For more extensive studies it may, however, become unavoidable to reduce the number of protonation sites that are examined, e.g., by means of the aforementioned MESP threshold. Alternatively, one can first consider all detected protonation sites, but exclude the resulting protonated species from further considerations if they turn out to be energetically unfavorable.
From the data presented in Table 1 it is evident that the distance between hydrogen atoms and the remainder of the molecule in the optimized protonated structures is smaller than the distance between the MESP minimum that indicated the protonation site under consideration and the atom closest to it.
As can be seen from Fig. 5, for many systems the value of the MESP at a potential protonation site and the resulting protonation energy are positively correlated. However, this statement cannot be generalized: for N,N-dimethylaniline the calculated MESP minima in the vicinity of the nitrogen are considerably less deep than those found on the π-system. Still, protonating the structure on the nitrogen sites leads to a larger decrease in energy than attacking the ring system does. Similarly, for the case of ethylvinyl sulfide, the minima around the sulfur center are more pronounced than those positioned in the vicinity of the double bond, while the protonation energies show the opposite trend.
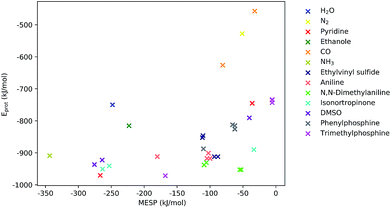 | ||
| Fig. 5 MESP at detected local minima and corresponding protonation energies, Eprot. Different colors encode data obtained for different systems. | ||
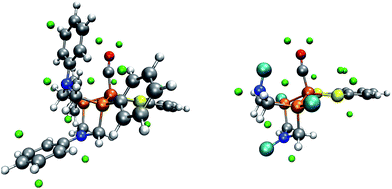
We now inspect our algorithm with the example of a model of the Yandulov–Schrock complex59 whose protonation propensities we had already studied in our previous work.6 As can be seen from Fig. 6, our algorithm successfully identifies possible protonation sites on the equatorial nitrogen atoms of the complex and on the free nitrogen atom of the coordinating N2. However, there are no MESP minima positioned around the metal center, which we observed before and solved by conservatively distributing additional protons at geometrically uncrowded positions around the metal atom.
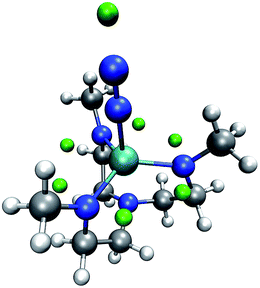 | ||
| Fig. 6 Yandulov–Schrock model complex with N2 coordinating to the metal center and with green spheres depicted at the MESP minimum positions. (H: white, C: gray, N: blue, Mo: cyan). | ||
Possible protonation sites in hydrogenase model complexes
Ott and coworkers reported that two different coordination isomers of complex 1 exist:9 in addition to the square-pyramidal coordination as depicted in Fig. 1, a distorted trigonal-bipyramidal symmetry on the iron center is possible. Before applying our automatic exploration algorithm to the hydrogen evolution reaction catalyzed by complex 1,9 we examine the outcome of our protocol for locating protonation sites in one example conformer of each of these coordination isomers.For the square-pyramidal form, depicted in Fig. 7, minima of the MESP are, as expected owing to the presence of directed lone pairs, detected in the vicinity of the sulfur, nitrogen and oxygen atoms. Further protonation sites are predicted to be localized on the aromatic ring systems. The fact that for the trigonal-bipyramidal isomer, as can be seen from Fig. 8, no protonation site is detected on the nitrogen atom in the vicinity of the CO-ligand is, however, unexpected. To study the reasons for this observation, we calculated the gain in electronic energy, resulting from protonating the complex at this site. A protonation energy of −1115 kJ mol−1 indicates that the possibility to protonate the structure on this nitrogen atom must not be overlooked at all. Note, however, that the huge protonation energies arise from the lack of an explicit acid molecule and of proper solvation shell modelling in our approach. Protonation energies given in this work are therefore only meaningful in direct comparison to such quantities evaluated for the same system (i.e., only relative protonation energies can be used to rank different protonation sites in one system).
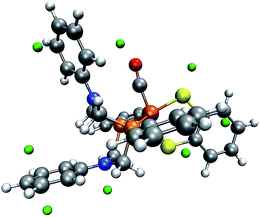 | ||
| Fig. 8 One conformer of the trigonal-bipyramidal form of complex 1 with green spheres depicted at the detected local minima of the MESP. (H: white, C: gray, O: red, N: blue, P: orange, Fe: brown). | ||
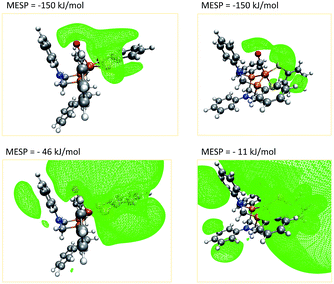
A closer investigation of the MESP and its isosurfaces leads us to the conclusion that the MESP valley expected to be found in the proximity of the nitrogen atom is immersed by the regions of low MESP present around the π-system of the adjacent phenyl ring and the one arising around the CO ligand. Exemplary plots of MESP isosurfaces of complex 1 are shown in Fig. 10. The surface drawn at a MESP of −11 kJ mol−1 for the trigonal-bipyramidal isomer has a protuberance towards the nitrogen atom of interest. However, a distinct valley, such as the one visible for the corresponding nitrogen atom in the square-pyramidal complex when plotting an isosurface at a MESP value of −46 kJ mol−1, cannot be localized.
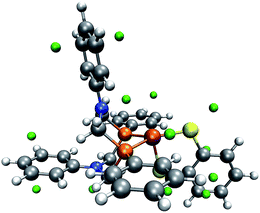 | ||
| Fig. 9 Trigonal-bipyramidal complex without the carbonyl ligand and with green spheres depicted at the location of detected MESP minima. (H: white, C: gray, O: red, N: blue, P: orange, Fe: brown). | ||
We have seen above that our algorithm is capable of recognizing a similar protonation site close to the nitrogen atom of aniline derivates. Even when we constrained N,N-dimethylaniline to resemble the analogous structure in the trigonal-bipyramidal complex, we found our algorithm to work reliably, which indicates the role of the molecular environment on the MESP pointing to difficulties that may arise for crowded molecules. This is highlighted when we analyze the frozen complex structure without the carbonyl ligand (see Fig. 9), which then allows us to detect the missing protonation site. Hence, the interaction with the adjacent carbonyl ligand has a crucial impact on our protonation index. This conclusion fits with the observation that, although in both complexes the FePCNCP heterocycle of interest is in a boat conformation, the distance between the nitrogen atom and the carbon atom of the carbonyl ligand is 3.4 Å for the square-pyramidal complex, for which local minima are successfully detected around the nitrogen atom of interest, but only 2.7 Å in the trigonal-bipyramidal form.
In our case, protonation of a reactant leads to structural distortion of the original equilibrium structure. In comparison to the original complex, when protonating the trigonal-pyramidal isomer of complex 1, the phenyl substituent is rotated, as can be seen in Fig. 11. Furthermore, the local bonding situation at the nitrogen atom under consideration differs. Where in the unprotonated structure the angle between the CP–N–CP plane and the N–CPh,N bond is 163°, it is only 132° in the protonated structure. Repeating our analysis on the trigonal-bipyramidal complex after adjusting the described angle to the value in the protonated structure while leaving the rest of its structure unchanged results in the correct detection of the protonation site of interest. To further rationalize the effect arising from distorting the reactant structure, we applied our algorithm on structures arising from adjusting the described angle to values between 100° and 160° in steps of five degrees while leaving the remainder of its structure unchanged. For all structures with an angle below 135° the protonation site was detected. We further expect rotation of the phenyl substituent towards its orientation in the protonated structure to have a similar effect. While in the unprotonated, optimized complex the π-system of the ring is oriented such that the lone pair of the N atom can easily interact with it, in the protonated complex the phenyl ring is aligned with the newly formed N–H bond.
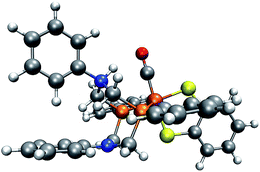 | ||
| Fig. 11 Trigonal-bipyramidal complex protonated on the N atom. (H: white, C: gray, O: red, N: blue, P: orange, Fe: brown). | ||
It is crucial to be aware of the fact that the MESP that we intend to analyze in automated procedures will in general be calculated from the electronic wave function of structurally optimized reactant molecules in their equilibrium structures. Neglecting the polarizing effect of an approaching electrophile, here a proton, on the electronic density may lead to reaction channels not uncovered by a reactivity descriptor.29 This is a general problem of chemical reactivity theory that sets out from equilibrium-structure reactants to predict potential reaction pathways. Obviously, the problem becomes more severe the later the transition state is found along a reaction coordinate. Clearly, a possible solution is to define structural distortions as discussed above to move reactants in the direction of specific reaction channels. For automated procedures, this must be possible through standard recipes. A straightforward way would be to slightly distort the equilibrium structure along its low-frequency normal modes.
Automatic exploration algorithm
We applied our MESP-based localization of protonation sites within the setting of fully automated mechanistic exploration in order to obtain deep structural insights into the reaction thermodynamics of the first steps that eventually lead to hydrogen evolution catalysis by complex 1. Since the open coordination site of the square-pyramidal form is necessary for substrate binding,9 we focused on this coordination isomer.Each cycle of the automated exploration summarized in Fig. 12 consists of the following steps:
(1) Conformers of the optimized starting structure are produced: an ensemble of guess structures is generated with the MOLASSEMBLER-library and then subjected to structure optimizations. The resulting structures are compared to the starting structure in terms of their connectivity and the idealized symmetry of the central metal atom. Only if both of these are alike the result is considered a conformer and retained for further analysis.
(2) These conformers are then used as starting points to generate guess structures of possible products of subsequent reaction steps:
• The structures can be reduced: in redox chemistry, and especially in hydrogen production chemistry based on acids, one-electron reduction (often in concert with proton transfer) is an important step to produce monoanions ready for protonation or to reduce protonated species in order to keep a potential charge on a reactant as low as possible. Naturally, a detailed kinetic analysis would then require to study paths that allow for simultaneous transfer of an electron and a proton. However, from the perspective of a thermodynamic cycle, the individual products of reduction and protonation steps can be essential and this is what we are aiming for. Hence, for each conformer a guess structure is created by reducing its charge by one and adapting its multiplicity accordingly.
• The structures can be protonated: the local minima of the MESP are determined as explained above. Then, for each of the MESP minima a protonated guess structure is generated by placing a proton on the vector between the MESP minimum and the non-hydrogen atom that is closest to the minimum under consideration. In accordance with our findings so far, the distance between protons and the closest non-hydrogen atom is set to 0.7 times the van der Waals radius of the corresponding atom. In order to be conservative (producing rather more than less potentially interesting protonated guess structures), we allow for protonation of the metal center by locating the centroids of the faces of the polyhedron spanned by the atoms coordinating to the metal center and then placing a proton on the vector between the iron center and the centroid. Note that only one protonation site is occupied by a single proton in each step making doubly protonated species accessible in iterations starting from reduced and unreduced singly protonated products.
(3) The reaction-product guess structures are optimized. The resulting final structures can then be analyzed and used as starting structures for the following cycle. During the analysis of the reaction products we determine whether parts of the complex dissociated and whether the number of atoms coordinating to the central atom is less than 4. In such cases we would not consider the structure as a starting point for future steps for the present example.
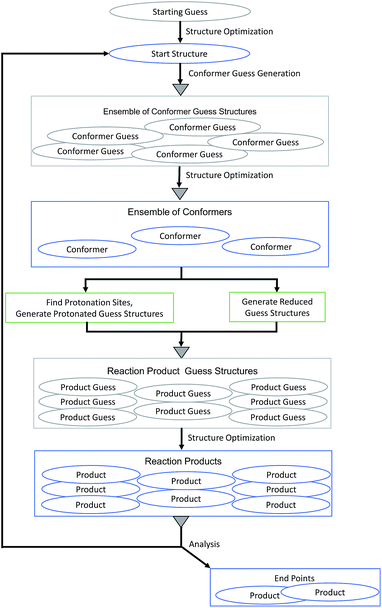 | ||
| Fig. 12 Flow chart of the MESP-based protonation algorithm for exploring the reaction network arising from protonation and reduction sequences. Gray triangles symbolize deduplication steps. | ||
One crucial requirement for efficient exploration of vast reaction networks is the detection and removal of duplicates for theoretical and for practical reasons. Duplicates would eventually render kinetic modeling meaningless and computational resources would be wasted by investigating essentially the same structures several times. The first time this problem arises in the algorithm outlined above is during conformer generation. The unoptimized guess structures are aligned using a quaternion fit and the root mean square deviation (RMSD) between the position matrices is computed.60,61 For an RMSD less than 0.5 Å, two structures are considered to be alike. We emphasize, however, that the choice of this threshold, although carefully made, is to a certain degree arbitrary. Even minor changes of the threshold can potentially result in the inclusion or discarding of structures in the network.
It is not trivial to decide which atom of one structure shall be compared to which atom of the other during RMSD calculations, since their ordering in the Cartesian coordinate files is not guaranteed to match throughout the procedure. Therefore, the aligned position matrices are reordered such that atoms of one structure are mapped to the atom of the second structure that, within the set of atoms that have the same type and the same number and type of adjacent atoms bound to them, is spatially closest to it within the aligned coordinate systems, before the RMSD is calculated and compared to the cut-off threshold of 0.5 Å.
This reordering based procedure is applied for the optimized conformer structures. To determine whether an optimized reaction product is already present in the reaction network, our implementation probes whether other structures of the same charge, multiplicity, connectivity, and idealized symmetry on all atoms and with the same atom stereocenters exist. If that is the case, the structures will be classified as different or alike from the reordering based RMSD criterion. Guess structures for protonated and reduced species are compared to all previously generated reaction product guess structures in the same manner. For this step, the necessary bonding information is adopted from the underlying reactant structure. In the case of protonated structures one additional bond is assumed to be present between the added hydrogen and the nearest non-hydrogen atom, or, for protonation sites around the metal center, between the added hydrogen and the metal atom.
Out of 61 conformer guess structures generated by the MOLASSEMBLER library, 12 were considered to be unique by our algorithm and therefore were subjected to structure optimization. Subsequently, 8 distinct structurally optimized conformers emerged. Out of 153 reaction product guess structures 145 were considered to be distinct. Among the consequent optimized reaction product structures, 23 were found to be duplicates.
Finally, we note that the final result of the exploration will always depend on the convergence of the automatically launched quantum chemical calculations because some of the guess structures might be chemically unreasonable (i.e., high up on the Born–Oppenheimer potential energy surface creating problems for orbital convergence). Out of the 167 distinct ORCA calculations that are the basis for the results presented in the following, only 1 failed.
Automated exploration of protonation and reduction reactions of complex 1
Applying the reordering based deduplication criterion on the ensemble of optimized conformers yields 8 distinct conformer structures shown in Fig. 13. Complexes 1f and 1g are very similar with the main difference being the orientation of the P-phenyl rings and their RMSD is slightly larger than the chosen cut-off threshold of 0.5 Å.
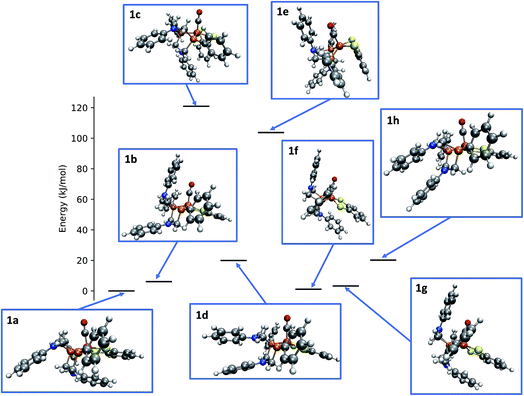 | ||
| Fig. 13 Relative energies and structures of unique, automatically generated conformers of the hydrogenase model complex 1. | ||
The conformational freedom arising from different orientations of the PR2NPh2 ligand was sampled successfully, with all combinations of boat and chair conformations of the two six-membered rings being represented. In the following, we refer to the conformers by first listing the conformation of the ring adjacent to the carbonyl ligand followed by that of the one located in the neighboring open coordination site. For example, according to this notation structure 1b has a boat/chair conformation.
In the conformational search carried out manually by Ott and coworkers, boat/chair, boat/boat, and chair/chair conformations were found,9 which correspond to structures 1b, 1f/1g, and 1b/1h, respectively. They did not report structures 1a, 1c, and 1e. Conformers 1c and 1e are much higher in energy than the others and are therefore unpopulated at ambient temperatures. Although not exploited here, our set-up allows for excluding these conformers from the network based on an energy cut-off.
The fact that structure 1a, i.e., the chair/boat conformation that was not reported in ref. 9, is not only located in the relevant energy regime but even the most populated one and therefore must not be overlooked, is a clear indication of the necessity to employ automated exploration algorithms—although also these algorithms cannot guarantee to have identified all relevant species for a mechanism, the depth in terms of the number of structures and elementary steps that they provide at less human effort will make them the standard computational approach to reaction thermodynamics and kinetics in future computational chemistry studies.2
Reaction products of the first reactive cycle
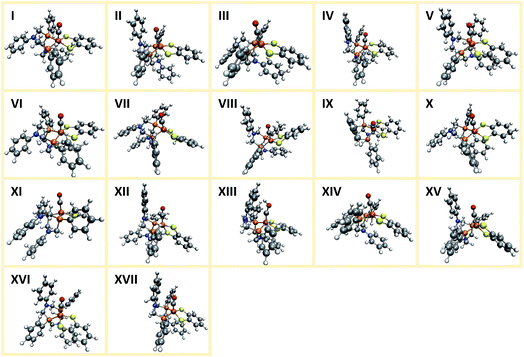
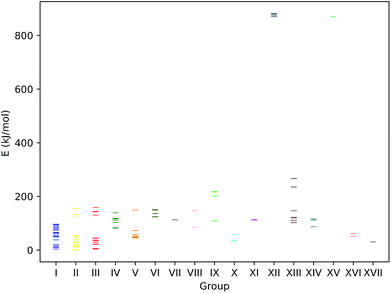
In the following, we present the results obtained from the first application cycle of our automated exploration algorithm to the square-pyramidal hydrogenase model complex 1, i.e., the cationic or anionic species arising from a single protonation or reduction step, respectively. The fact that only one reactive cycle results in a set of 122 distinct reaction products clearly underlines again the need for automated exploration algorithms. We arranged the resulting products into groups within which the idealized symmetry at the iron center and the overall connectivity is alike. For each of these groups the lowest energy structure is presented in Fig. 14.The energy spectrum of the reaction products is depicted in Fig. 15. The lowest energy structure is a representative of group II, i.e., a structure where protonation occurred at a nitrogen atom. Low protonation energies can also arise from protonation on the para-position of the N-phenyl rings (group III) and the sulfur atoms (group I). Ott et al. observed that upon adding acid to a solution of complex 1 in acetonitrile, the resulting IR spectrum is strongly simplified.9 They suggested that this might be due to the prevalence of a protonated structure in which both FePCNCP rings are in a chair conformation and coordinate to a proton found in between them. In view of our results, we cannot support this claim as we do not find a single protonated structure to be dominating in terms of particularly low energy. However, investigation of all the obtained reaction product structures also revealed that we did not encounter any structure of the described type: while for the chair–chair conformers, structures 1d and 1h, protonation sites were correctly predicted to be located on the nitrogen atoms, and also on the side of the nitrogen atom facing the second FePCNCP ring. In the resulting protonated structure, the H atom was still clearly assigned to one of the N atoms and not positioned exactly in between. While being low in energy, there are still more favorable protonation products present. Starting from a chair/chair conformation but deliberately positioning the proton in the reaction product guess exactly in between the two nitrogen atoms yielded a similar result.
Conclusions
In this work, we elaborated on the possibility to exploit topological features, in particular local minima, of the molecular electrostatic potential to serve as indicators for protonation sites. Apart from the intrinsic chemical insights that can be gained from such an indicator, it can serve in automated reaction exploration algorithms as a guide to tame the combinatorial explosion of possible protonation channels. In this respect, the MESP can support first-principles heuristics6 to narrow down reactivity options to those that are viable.We studied the capabilities and limitations of local minima of the MESP for the determination of potential protonation sites in a fully automated manner. Our algorithm works reliably for localizing protonation sites in prototypical systems that are characterized by the presence of (protonatable) lone pairs. For more complex delocalized situations, i.e., for those that in principle do not feature a clear-cut specific atom-like site, such as π-systems, difficulties arise. From the data presented in this work, we understand that these challenges can be overcome in principle, but further investigations will be required.
Turning to the structurally more complex hydrogenase model complexes, we found that our algorithm is generally applicable. However, for one of its coordination isomers it failed to predict one expected protonation site. For this case, we demonstrated that distorting the structure locally can cure this problem, which points to the necessity for structural distortions of equilibrium structures (for instance, along normal modes) in order to create structures that are prepared for reaction by pushing them in the direction of a possible reaction channel. We note that this is a general issue with all chemical reactivity indices evaluated at equilibrium structures of the reactants as such structures will, in general, be different from those encountered in a transition-state structure, i.e., requiring structural distortion.
Our application of the MESP-based protonation criterion to automatically explore a part of the reaction network arising from reduction and protonation of a hydrogenase model complex clearly demonstrated the need for automation when a complete picture of complex organometallic reaction mechanisms is required. In particular, the conformational freedom and the presence of multiple protonation sites result in rapidly increasing numbers of different structures that have to be considered in a thorough analysis of the resulting reaction network.
Conflicts of interest
There are no conflicts of interest to declare.Acknowledgements
This work has been financially supported by the Swiss National Science Foundation (Project No. 200021_182400). We are very grateful for the immediate help of the Cluster Support Team at ETH Zürich for short-term extensive use of the ETH high-performance computing cluster. We would like to thank Jan-Grimo Sobez and Dr Jan Patrick Unsleber for discussions that in parts led to work that will be published elsewhere.References
- C. Masters, Homogeneous Transition-Metal Catalysis, Springer Netherlands, Dordrecht, 1981 Search PubMed.
- G. N. Simm, A. C. Vaucher and M. Reiher, J. Phys. Chem. A, 2019, 123, 385–399 CrossRef CAS PubMed.
- A. L. Dewyer, A. J. Argüelles and P. M. Zimmerman, Wiley Interdiscip. Rev.: Comput. Mol. Sci., 2018, 8, e1354 Search PubMed.
- W. M. C. Sameera, S. Maeda and K. Morokuma, Acc. Chem. Res., 2016, 49, 763–773 CrossRef CAS PubMed.
- A. C. Vaucher and M. Reiher, J. Chem. Inf. Model., 2016, 56, 1470–1478 CrossRef CAS PubMed.
- M. Bergeler, G. N. Simm, J. Proppe and M. Reiher, J. Chem. Theory Comput., 2015, 11, 5712–5722 CrossRef CAS PubMed.
- J. Proppe, T. Husch, G. N. Simm and M. Reiher, Faraday Discuss., 2017, 195, 497–520 RSC.
- G. N. Simm and M. Reiher, J. Chem. Theory Comput., 2017, 13, 6108–6119 CrossRef CAS PubMed.
- A. Orthaber, M. Karnahl, S. Tschierlei, D. Streich, M. Stein and S. Ott, Dalton Trans., 2014, 43, 4537–4549 RSC.
- N. Armaroli and V. Balzani, Angew. Chem., Int. Ed., 2007, 46, 52–66 CrossRef CAS.
- P. M. Vignais and B. Billoud, Chem. Rev., 2007, 107, 4206–4272 CrossRef CAS PubMed.
- C. Tard, X. Liu, S. K. Ibrahim, M. Bruschi, L. D. Gioia, S. C. Davies, X. Yang, L.-S. Wang, G. Sawers and C. J. Pickett, Nature, 2005, 433, 610–613 CrossRef CAS PubMed.
- M. Y. Darensbourg, Nature, 2005, 433, 589–591 CrossRef CAS PubMed.
- S. Styring, Faraday Discuss., 2012, 155, 357–376 RSC.
- K. A. Vincent, A. Parkin and F. A. Armstrong, Chem. Rev., 2007, 107, 4366–4413 CrossRef CAS PubMed.
- Z. Cao and M. B. Hall, J. Am. Chem. Soc., 2001, 123, 3734–3742 CrossRef CAS PubMed.
- H.-J. Fan and M. B. Hall, J. Am. Chem. Soc., 2001, 123, 3828–3829 CrossRef CAS PubMed.
- G. Zampella, C. Greco, P. Fantucci and L. De Gioia, Inorg. Chem., 2006, 45, 4109–4118 CrossRef CAS PubMed.
- A. R. Finkelmann, M. T. Stiebritz and M. Reiher, J. Phys. Chem. B, 2013, 117, 4806–4817 CrossRef CAS PubMed.
- A. R. Finkelmann, M. T. Stiebritz and M. Reiher, Chem. Commun., 2013, 49, 8099–8101 RSC.
- A. R. Finkelmann, M. T. Stiebritz and M. Reiher, Inorg. Chem., 2014, 53, 11890–11902 CrossRef CAS PubMed.
- A. Jablonskytė, J. A. Wright and C. J. Pickett, Dalton Trans., 2010, 39, 3026–3034 RSC.
- X. Zhao, I. P. Georgakaki, M. L. Miller, J. C. Yarbrough and M. Y. Darensbourg, J. Am. Chem. Soc., 2001, 123, 9710–9711 CrossRef CAS PubMed.
- A. R. Finkelmann, M. T. Stiebritz and M. Reiher, Chem. Sci., 2013, 5, 215–221 RSC.
- S. Kaur-Ghumaan, L. Schwartz, R. Lomoth, M. Stein and S. Ott, Angew. Chem., Int. Ed., 2010, 49, 8033–8036 CrossRef CAS PubMed.
- T. Liu, D. L. DuBois and R. M. Bullock, Nat. Chem., 2013, 5, 228–233 CrossRef CAS PubMed.
- E. Scrocco and J. Tomasi, New Concepts II, 1973, pp. 95–170 Search PubMed.
- E. Scrocco and J. Tomasi, Adv. Quantum Chem., Academic Press, 1978, vol. 11, pp. 115–193 Search PubMed.
- P. Politzer and J. S. Murray, Theor. Chem. Acc., 2002, 108, 134–142 Search PubMed.
- J. S. Murray and P. Politzer, Wiley Interdiscip. Rev.: Comput. Mol. Sci., 2011, 1, 153–163 Search PubMed.
- S. R. Gadre and I. H. Shrivastava, J. Chem. Phys., 1991, 94, 4384–4390 CrossRef CAS.
- S. A. Kulkarni and S. R. Gadre, J. Mol. Struct., 1996, 361, 83–91 CrossRef CAS.
- A. Kumar, S. R. Gadre, N. Mohan and C. H. Suresh, J. Phys. Chem. A, 2014, 118, 526–532 CrossRef CAS PubMed.
- R. Bonaccorsi, A. Pullman, E. Scrocco and J. Tomasi, Theor. Chim. Acta, 1972, 24, 51–60 CrossRef CAS.
- B. Pullman, Int. J. Quantum Chem., 1990, 38, 81–92 CrossRef.
- S. R. Gadre and P. K. Bhadane, J. Chem. Phys., 1997, 107, 5625–5626 CrossRef CAS.
- CRC Handbook of Chemistry and Physics, ed. J. R. Rumble, CRC Press/Taylor & Francis, Boca Raton, FL, 99th edn, 2018 Search PubMed.
- H. Weinstein, P. Politzer and S. Srebrenik, Theor. Chim. Acta, 1975, 38, 159–163 CrossRef CAS.
- M. Reiher, SCINE, https://scine.ethz.ch/ Search PubMed.
- J.-G. Sobez and M. Reiher, unpublished.
- T. Havel and K. Wüthrich, Bull. Math. Biol., 1984, 46, 673–698 CAS.
- B. V. Cherkassky, A. V. Goldberg and T. Radzik, Math. Program., 1996, 73, 129–174 Search PubMed.
- J. M. Blaney and J. S. Dixon, Rev. Comput. Chem., John Wiley & Sons, Ltd, 2007, pp. 299–335 Search PubMed.
- I. Mayer, Chem. Phys. Lett., 1983, 97, 270–274 CrossRef CAS.
- I. Mayer, Int. J. Quantum Chem., 1984, 26, 151–154 CrossRef CAS.
- J. P. Perdew, K. Burke and M. Ernzerhof, Phys. Rev. Lett., 1996, 77, 3865–3868 CrossRef CAS PubMed.
- J. P. Perdew, K. Burke and M. Ernzerhof, Phys. Rev. Lett., 1997, 78, 1396 CrossRef CAS.
- F. Neese, Wiley Interdiscip. Rev.: Comput. Mol. Sci., 2012, 2, 73–78 CAS.
- F. Neese, Wiley Interdiscip. Rev.: Comput. Mol. Sci., 2018, 8, 1327–1342 Search PubMed.
- C. Adamo and V. Barone, J. Chem. Phys., 1999, 110, 6158–6170 CrossRef CAS.
- F. Weigend and R. Ahlrichs, Phys. Chem. Chem. Phys., 2005, 7, 3297–3305 RSC.
- F. Weigend, Phys. Chem. Chem. Phys., 2006, 8, 1057–1065 RSC.
- F. Neese, F. Wennmohs, A. Hansen and U. Becker, Chem. Phys., 2009, 356, 98–109 CrossRef CAS.
- S. Grimme, S. Ehrlich and L. Goerigk, J. Comput. Chem., 2011, 32, 1456–1465 CrossRef CAS.
- A. Klamt and G. Schüürmann, J. Chem. Soc., Perkin Trans. 2, 1993, 799–805 RSC.
- J. Andzelm, C. Kölmel and A. Klamt, J. Chem. Phys., 1995, 103, 9312–9320 CrossRef CAS.
- V. Barone and M. Cossi, J. Phys. Chem. A, 1998, 102, 1995–2001 CrossRef CAS.
- M. Cossi, N. Rega, G. Scalmani and V. Barone, J. Comput. Chem., 2003, 24, 669–681 CrossRef CAS PubMed.
- D. V. Yandulov and R. R. Schrock, Science, 2003, 301, 76–78 CrossRef CAS PubMed.
- M. W. Walker, L. Shao and R. A. Volz, CVGIP: Image Understanding, 1991, 54, 358–367 CrossRef.
- J. C. Kromann, Calculate Root-Mean-Square Deviation (RMSD) of Two Molecules, Using Rotation, in Xyz or Pdb Format: Charnley/Rmsd, 2019 Search PubMed.
Footnote |
| † Electronic supplementary information (ESI) available. See DOI: 10.1039/c9fd00061e |
| This journal is © The Royal Society of Chemistry 2019 |

