 Open Access Article
Creative Commons Attribution 3.0 Unported Licence
Assessing the potential of fluorescence spectroscopy to monitor contaminants in source waters and water reuse systems†
Joseph
Wasswa‡
 *a,
Natalie
Mladenov
 a and
William
Pearce
b
aDepartment of Civil, Construction, and Environmental Engineering, San Diego State University, 5500 Campanile Drive, San Diego, CA 92182, USA. E-mail: jhwasswa@gmail.com; Fax: +1 619 594 6005; Tel: +1 619 598 3859
bCity of San Diego, Pure Water Program, USA
First published on 9th January 2019
Abstract
It is of ongoing interest to evaluate real-time instruments for monitoring water contaminants for source water control and water reuse system performance applications. Portable fluorescence sensors have the potential to provide instantaneous measurements of fluorescent organic compounds present in chemical and biological pollutants. Comparisons between one-dimensional fluorescence data from portable sensors and data obtained from higher sensitivity benchtop fluorometers, capable of three dimensional spectral acquisition, are needed to evaluate the performance of portable instruments. We tracked fluorescence intensities in titration experiments with diverse pollutants, including two volatile organic compounds (diesel, gasoline), three pharmaceuticals (ibuprofen, caffeine, lopinavir), and a pesticide (isoxathion), added to creek water, tertiary treated wastewater, and water from different treatment stages at a water reuse facility. Our results indicated that optical filters with wavelength bands in the tryptophan-like and tyrosine-like peak regions were able to track the peaks of most organic chemicals studied. Fluorescence intensities measured with both portable and benchtop instruments were highly correlated for all samples and all contaminants (R2 > 0.90). In the final product water of the water reuse facility, both portable and benchtop fluorometers displayed high sensitivity, being able to discern contaminants from the background at concentrations as low as 0.2 ppb. However, in creek water, post-ozone water, and tertiary effluent, pollutant detection limits were much higher for both portable and benchtop fluorometers. Therefore, in waters with substantial background fluorescence, fluorescence-based sensors may be best suited for tracking higher concentrations of organic contaminants, such as those found in chemical spills in source waters.
Water impactOur work attempts to evaluate the limits of detection for online fluorescence sensors and the performance of fluorescence-based sensors in diverse water types with different amounts of background fluorescence for public health protection. In addition, we aimed at comparing the measurements taken by a portable fluorometer and the gold-standard, laboratory-based benchtop fluorometer to monitor trace organic water pollutants. The presence of high concentrations of background DOM affects the sensitivity of both instruments to detect trace levels of contaminants. We also observed that for the purpose of monitoring water quality, optical filters with wavelength bands that capture both the tryptophan and tyrosine-like peak regions are recommended for online contaminant monitoring. Our results have broad implications for source water protection, identification of contaminants and other forensic information (e.g., that may help track illicit dischargers), and triggering an action (e.g., used as a critical control point) in the water industry. |
1. Introduction
The occurrence of organic contaminants in surface water, potable water, domestic wastewater, and other water sources has led to increased interest in monitoring these contaminants in a wide range of water types. Analytical approaches have been very effective at quantifying some organic chemicals of concern in water supplies.1,2 However, as the time shortens between water treatment and delivery of water to the consumer (e.g., direct potable water reuse) there is increasing interest in tracking of contaminants in real-time.3 Currently, potable water reuse facilities already use real time on-line total organic carbon analyzers to measure the bulk parameter; however, characterizing the individual organic contaminants requires significant laboratory analysis time and preparation. Also, total organic carbon analyzers cannot differentiate between different organic compounds, such as those from soils and leaf litter vs. those from synthetic organic chemicals.2 From the perspective of responding to contamination events, being able to elucidate the general source of organic contaminants in real-time has added value for water managers. Therefore, continuing to evaluate the suitability of new in-line, real-time sensors for organic contaminant monitoring is of interest.Fluorescent dissolved organic matter is derived from naturally-occurring organic compounds, such as bacteria, algae, and higher plants, as well as a wide range of manmade chemicals, including various compounds from the petroleum industry, paper and pulp mills, agrochemical industries, and other industrial and domestic wastewater constituents. Many aromatic and double-bonded structures produced by diverse organic compounds are fluorescent and can therefore be visualized as a three-dimensional excitation–emission matrix (EEM) spectrum.4 Fluorescence spectral acquisition, even for 3D EEM spectra, is relatively rapid when compared to chromatographic spectroscopic techniques, such as gas or liquid chromatography. Due to its ability to provide rapid information about the presence of diverse organic compounds, fluorescence spectroscopy has been widely used to track organic compounds in natural environments and engineered systems.
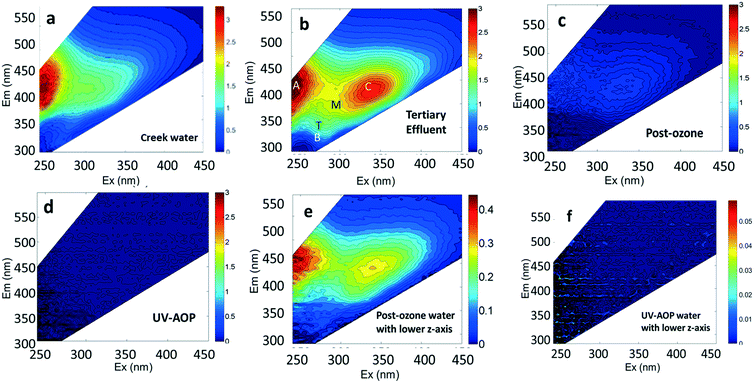
Considerable attention has been given to tracking wastewater inputs to riverine systems with fluorescence.5,6 For example, the tryptophan-like fluorescence peak (Peak T) identified in EEM spectra (Fig. 1 and Table 2) has been shown to discriminate contributions of bacteria in sewage-impacted rivers5,6 and pathogenic enteric viruses in groundwater-derived potable water supplies in Africa.7 Zhou et al.8 found a highly significant (R2 = 0.9, p < 0.0001) correlation between wastewater addition and an increase in Peak T intensity. Other studies have demonstrated the potential of fluorescence spectroscopy as a method for assessing the treated water quality and efficacy of the treatment plants.9–11 In a study of online monitoring of organic matter concentrations and character in drinking water systems, Shutova et al.12 observed that the fluorescence intensity of a peak associated with humic-like substances had a high correlation (R2 of >0.85) with dissolved organic carbon (DOC) concentration and concluded that it can be used to monitor DOC in raw and treated water. Online monitoring of reverse osmosis membrane fouling by Singh et al.13 revealed a strong correlation between humic-like peak intensities and transmembrane pressure.
Recent applications of parallel factor analysis (PARAFAC) modeling have made it possible to resolve the complex 3D EEM spectra into its dominant components and quantify each component's contribution to the total fluorescence. For example, Sgroi et al.14 used EEM-PARAFAC to characterize emerging organic compounds and monitor their trends in two catchment basins impacted by wastewater discharges. EEM-PARAFAC has also been used to study and predict the removal of emerging trace organic compounds (ETOrCs) during conventional wastewater treatment.9,15 Sgroi et al.14 concluded that fluorescence based peaks can be used as surrogates for wastewater contamination indication. Similarly, Zhou et al.8 applied EEM-PARAFAC to identify tryptophan-like fluorescence at a wavelength of 275/342 nm as a key indicator of point source contamination by sewage in a lake in China used for drinking water supply. Although the tryptophan-like peak has been associated with microbial sewage contamination, studies are still needed to evaluate fluorescent components associated with synthetic organic contaminants.
Benchtop fluorometers, which are considered to be more sensitive than portable fluorescence sensors, have recently been used to characterize organic matter in drinking water16–19 with typically low DOC concentrations (up to <1.0 mg L−1). Fluorescence analysis with benchtop fluorometers can be a challenge in field settings due to the poor portability of most benchtop instruments and longer times for spectral acquisition compared to portable sensors. Portable fluorescence sensors, which can provide real-time data or have data-logging capabilities and are often submersible or weather-resistant, are thus better suited to monitoring contaminants onsite. Most portable fluorometers are equipped with sensors to provide single point fluorescence intensity data for a limited number of excitation/emission (Ex/Em) pairs (typically 1–7 sensors for brands such as Seapoint™ and Turner™). Comparisons of fluorescence data obtained from portable and benchtop fluorometers would help evaluate the performance of portable fluorescence instruments compared to their more sensitive benchtop counterpart; however, to date, such studies are lacking for water treatment or water reuse systems.
In addition, given the ability of fluorescence sensors to track different types of fluorescent organic contaminants,9 there is a potential role of fluorescence sensors to serve as a warning system for source water protection and treatment performance for water reuse systems.20 However, much still remains to be understood about the different classes of contaminants that can be traced with commercially-available sensors and whether the contaminants can be detected at environmentally-relevant concentrations. Therefore, the main objectives of this study were to (i) assess the potential of fluorescence spectroscopy to monitor select organic chemical contaminants in different water sources and (ii) compare the ability of a portable submersible fluorometer to monitor changing chemical concentrations with that of a 3D benchtop fluorometer.
2. Methods and materials
2.1 Water sources and sampling
This study was conducted using creek water, as an example of a surface water body, and recycled water from different steps in the treatment train. Grab samples were collected from Alvarado Creek (32° 46′42.3′′N, 117° 03′48.97′′W) near San Diego State University and from three points in the treatment train of the Demonstration Pure Water Facility (DPWF), a water reuse demonstration facility in San Diego, California. Grab samples were collected from the following locations: 1) from the tertiary-treated effluent flowing into the inlet of DPWF (referred to as “tertiary effluent water”), 2) after the ozonation and biological activated carbon (BAC) treatment steps (referred to as “post-ozone water”), and 3) after the reverse osmosis and UV-advanced oxidation processes (referred to as “UV-AOP water”). Detailed information about the sampling locations and the treatment train of the DPWF are shown on Fig. S1,† and a detailed report of the facility is available in Trussell et al.21 Water samples from both the creek and the DPWF were collected between 15th December 2016 and 15th February 2017.2.2 Chemicals and reagents used as contaminants
Four different chemicals and two hydrocarbon-based fuels, which contain aromatic carbon rings in their structure and therefore may serve as fluorescent tracers for contamination, were utilized in this study: gasoline, diesel, ibuprofen, lopinavir, isoxathion, and caffeine. Diesel and gasoline were selected because they are environmental pollutants that are made up of a wide range of chemicals and they regularly find their way into surface waters due to runoff or accidental spills. Isoxathion was chosen in this study because it is a type of organophosphate insecticide, which is a class of widely used pesticides and is commonly found in natural waters.22 Caffeine and ibuprofen are common pharmaceuticals and personal care products (PPCPs) that have been reported in many wastewater studies.9,23 Lopinavir was used in this study because it is one of the pharmaceuticals that are used in the manufacture of anti-retroviral (ARVs) (Table 1). In African countries where HIV/AIDs is very prevalent, there has been increased consumption of ARVs. Studies have expressed concern over the fate of such pharmaceuticals in wastewater.24,25 Lopinavir, caffeine, and isoxathion were all purchased from Fischer scientific and were all of high purity and laboratory grade standards. Ibuprofen was obtained from a local pharmacy, and diesel and gasoline were obtained from a local filling station. Table 1 shows chemical properties of the contaminants, including molecular weight (MW) and the log-transformed value of the octanol–water partitioning coefficient (log![[thin space (1/6-em)]](https://www.rsc.org/images/entities/char_2009.gif) Kow) for each. Details for chemical stock solution preparations and spiking experiments are presented in the ESI† Methods.
Kow) for each. Details for chemical stock solution preparations and spiking experiments are presented in the ESI† Methods.
| Contaminant | Category | Usage | MW (g mol−1) | Log![[thin space (1/6-em)]](https://www.rsc.org/images/entities/char_2009.gif) Kow Kow |
Public health concern |
|---|---|---|---|---|---|
| a Sgroi et al.9 b Trapp et al.26 c Saito et al.27 d Wood et al.24 e Molecular structure of one of the representative fluorescent compounds (1-ethyl-3 methylbenzene) in gasoline and (1,3 dimethyl benzene) in diesel fuel. | |||||
Ibuprofen  |
Pharmaceutical | Analgesic | 206.3 | 3.97a | Endocrine disrupting compound |
Gasolinee |
Volatile organic compound | Internal combustion engine gas | 100–105 | 2.17–5.18b | Carcinogenic |
Diesele |
Volatile organic compound | Internal combustion engine gas | ∼200 | 3.37–7.2b | Carcinogenic |
Isoxathion  |
Synthetic organic compound | Pesticide | 313.308 | 3.73c | Carcinogenic and endocrine disrupter |
Lopinavir  |
Pharmaceutical | Protease inhibitors in HIV treatment | 628.814 | 6.26d | Endocrine disrupting compound |
Caffeine  |
Personal care product | Stimulant | 194.194 | −0.07a | Endocrine disrupting compound |
2.3 Analytical methods
Samples for DOC and fluorescence analysis were filtered through pre-combusted glass fiber filters with 0.7 μm nominal pore size before analysis. The DOC and total dissolved nitrogen (TDN) concentrations of each triplicate sample were determined using a Shimadzu TOC-L total organic carbon and total nitrogen analyzer. DOC was measured as non-purgeable organic carbon (NPOC) using a high temperature combustion method in which acidified samples were purged with carbon-free air prior to measurement to remove inorganic carbon.| Peak | Ex/Em wavelength | Description | Source (ref) |
|---|---|---|---|
| a Consolidated as humic-like peak in the manuscript. : Indicates a range. | |||
| Aa | (Ex260,Em (380:460)) | Terrestrial humic-like, high molecular weight, aromatic humic, hydrophobic acid fraction (HPOA); always high in wetlands and forested environments | 33–35 |
| B | (Ex275,Em310) | Tyrosine-like organic compounds, associated with amino acids and hydrophobic neutral fraction (HPON); indicates more degraded peptide material | 33–36 |
| T | (Ex275,Em340) | Tryptophan-like organic compounds, associated with amino acids, hydrophobic base fraction (HPOB), and hydrophilic acid fraction (HPIA); indicates less degraded peptide material | 33–35 |
| Ca | (Ex350,Em(420:480)) | High molecular weight, humic-like compounds; high in terrestrial environments | 33–36 |
| Ma | (Ex312,Em(380:420)) | Low molecular weight, marine humic-like compounds | 33–36 |
| I | (Ex 260,Em 290) | Due to ibuprofen | 37, this study |
The portable, submersible fluorometer (C3 Turner Designs™) used in this study, has three sensors, one for tryptophan-like substance fluorescence, second one for chromophoric dissolved organic matter (CDOM), and third one for chlorophyll a. The submersible fluorometer has a minimum detection limit (MDL) of 0.5 ppb for CDOM while that of a tryptophan-like substance sensor is 3 ppb.29 Physical and electrical specifications of C3 submersible fluorometer are provided in Table S1† and the wavelength for sensors are given in Table S2.† To be consistent with previous studies,30,31 values were recorded in the raw fluorescence mode and are referred to as “relative fluorescence units” (RFU), which are relative values, not blank subtracted or scaled to a standard. We also did not apply temperature correction as recommended by Wasswa and Mladenov32 because all experiments were performed at a consistent room temperature of ∼20 °C. For a 3D benchtop fluorometer, all experiments were carried out in duplicate for lopinavir, isoxathion and caffeine or triplicate for ibuprofen, diesel and gasoline. In case of a C3 submersible fluorometer, measurements were taken for a minimum of 2–5 minutes under constant mixing in the dark and with values loading at every second generating more than 200 values and all experiments were done in duplicate. A mean value for each of the experiment was used. Detailed methods describing contaminant titration experiments and in situ fluorescence measurements are presented in the ESI† Methods.
3. Results and discussion
3.1 Properties of selected water sources
The DOC, TDN, and fluorescence characteristics of four different water sources used in our spiking experiments (creek water, tertiary effluent, post-ozone water, and final product water) are shown in Table 3. Not surprisingly, the highest DOC and TDN concentrations were observed in tertiary effluent. By contrast, the lowest concentrations were found in the UV-AOP water, which receives the highest level of treatment in the water reuse system. Ozonation and BAC did not affect TDN concentration while reverse osmosis and UV-AOP processes substantially decreased TDN.| Water sources | DOC (mg L−1) | TDN (mg L−1) | Peak intensities (RU) | ||||
|---|---|---|---|---|---|---|---|
| A | B | T | C | M | |||
| Creek water | 5.667 | 1.713 | 2.788 | 0.503 | 0.725 | 1.255 | 1.649 |
| Tertiary effluent | 7.894 | 20.09 | 2.300 | 0.806 | 1.518 | 2.255 | 2.132 |
| Post ozone and BAC effluent | 5.132 | 20.06 | 0.383 | 0.097 | 0.204 | 0.302 | 0.307 |
| Reverse osmosis and UV-AOP effluent | 0.236 | 0.777 | 0.023 | 0.006 | 0.000 | 0.004 | 0.005 |
The water sources used in this study contained the ubiquitous fluorescent Peaks A, C, B, T, and M that have been previously identified in natural waters and wastewater settings (Table 1). Peaks A, C and M have been consolidated into humic-like peaks for discussion. The Humic-like peaks are known to be associated with aromatic C bonded structures in humic and fulvic acids36,38,39 and has the highest intensity in all water sources compared to rest of the peaks (Table 3). Peak B (maximum at Ex/Em of 275/310 nm), Peak T (maximum at 275/340 nm), are associated with microbial sources of organic matter.38,39 Peaks B (tyrosine-like) and T (tryptophan-like) have been attributed more specifically to aromatic amino acids and fluorescent compounds derived from microbial sources.38,40 Significant relationships previously identified between wastewater addition and Peak T intensity. Zhou et al.8 may help explain the presence of more intense Peak T in tertiary effluent and post-ozone water (Fig. 1), which are from early treatment steps at the water reuse facility, compared to UV-AOP and creek water, which should be devoid of wastewater influence. The lower overall fluorescence of the post-ozone water (Fig. 1c and e) reflects the substantial transformation and removal of organic compounds after ozonation and BAC processes.
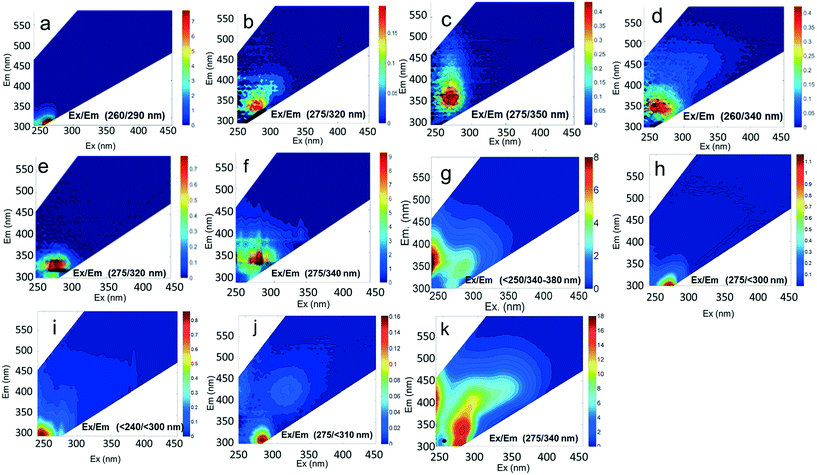
The EEMs of contaminants in ultrapure water (different concentrations chosen for best resolution) are presented in Fig. 2. The fluorescence intensity peak of ibuprofen (Fig. 2a) was centered at an Ex/Em of 260/290 nm, which is in agreement with the observations of Sádecká et al.37 At low concentrations, ibuprofen has high fluorescence intensities (see z-axis colorbar in Fig. 2a), which reflect its high quantum yield. Diesel, gasoline, caffeine, isoxathion and lopinavir all had maxima at Ex/Em between (250–290)/(300–380) nm (Fig. 2), which overlap Peaks B and T. The peak positions of other fluorescent substances, including polyethylene and polystyrene plastics soaked in water, bacteria in water and untreated wastewater, not used in titration experiments are shown in Fig. 2 for comparison.
3.2 Effects of contaminant addition on organic matter fluorescence
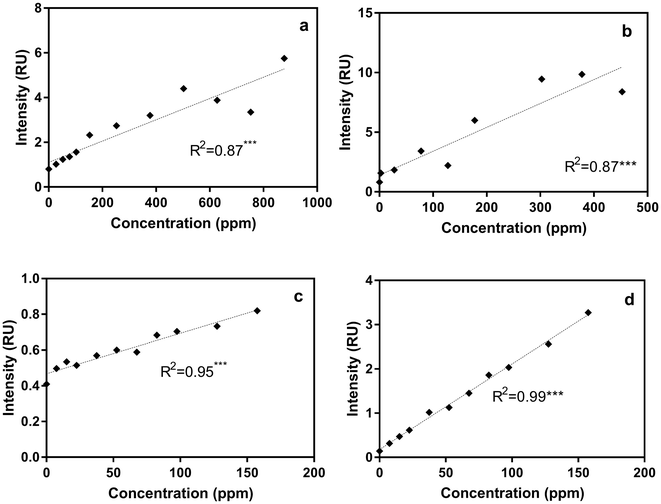
For each sample in the titration experiments, we extracted peak intensity data for the commonly identified DOM fluorescent peaks shown in Table 2. Correlations between the five DOM fluorescent peaks and contaminant concentrations in the titration experiments are presented in Table S3.† Regression analyses revealed that, compared to the other fluorescent peaks, Peak B intensities, measured using the benchtop fluorometer, were most significantly correlated with gasoline, diesel, isoxathion, caffeine and lopinavir concentrations (Table S3 and Fig. S2†). To illustrate the significant correlations, Fig. 3 shows correlations between Peak B intensities and select contaminants in tertiary effluent. Peak T intensities were also significantly correlated with concentrations of most contaminants (Table S3†), but the correlations with Peak B were more significant. At higher contaminant concentrations (e.g., >400 ppm for diesel and >800 ppm for gasoline) a decrease in Peak B fluorescence intensities occurred due to signal quenching (Fig. S2†). At very high concentrations, light cannot pass through the sample to cause excitation, and the signal becomes quenched; therefore, as water becomes highly concentrated in organic matter the linear relationship does not hold.41Correlations between ibuprofen concentration and peak B and T intensities in different water types had weak linear and insignificant relationships (Fig. S2† and Table S3†). The weaker response of peaks B and T intensities in ibuprofen-titrated water can be explained by the fact that ibuprofen has a fluorescence maximum at Ex/Em of 260/290 nm, which is substantially offset from the positions of peaks B and T. At ibuprofen concentrations >100 ppm, there was a linear increase in peak B intensity, which is likely due to the enlargement of the ibuprofen peak at higher concentration.
To more directly track ibuprofen contamination using the benchtop fluorometer, we also measured the intensity of the newly identified peak I (at Ex/Em of 260/ (290–300) nm) in titration experiments. Compared to the weak relationships with peaks B and T especially for post-ozone and UV-AOP water (R2 ∼ 0 for both water types; Fig. S2†), there was a substantial improvement in the R2 values with peak I, even at low concentrations (R2 = 0.98 and 0.99 for UV-AOP and post-ozone water respectively; Fig. 3d and S3†).
3.3 PARAFAC modeling
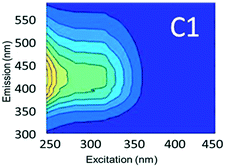
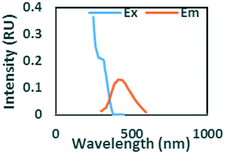
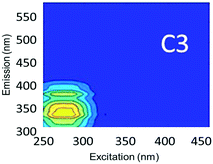
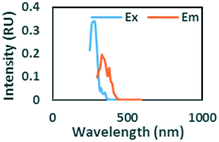
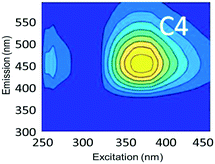
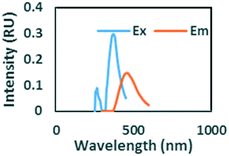
To evaluate contributions from different organic matter sources and contaminants in spiking experiments for the range of water types towards total fluorescence, PARAFAC modeling was used to discriminate the major components in a dataset of 119 samples. The PARAFAC model identified five components, which were validated using a split-half validation procedure. The EEMs and spectral loadings of these five components are presented in Table 4. Components C1 and C4 had maxima at Ex/Em of 240/(414–440) nm and Ex/Em of 370/456 nm, respectively. C1 and C4 track peaks A and C, respectively, due to the presence of terrestrial humic-like materials.36,38 The secondary peak of C4 at Em/Ex 260/456 has been observed as component 6 in Zhou, et al.42 and found to be associated with the presence natural humic-like compounds and oil. In our study, the identified components closely track contaminant additions to different water sources. Components C1 and C4 were typically present in creek water and tertiary effluent water, and low or missing in post ozone water and UV-AOP water. Low maximum fluorescence intensity (Fmax) values, which are analogous to concentrations, of C1 and C4 in UV-AOP water indicate that reverse osmosis followed by advanced oxidation was able to remove these humic-like constituents from water (Table S4†).| Component EEMs | Excitation and emission loadings | Description and related studies |
|---|---|---|
|
|
Em/Ex at 240/ (414–460). Humic-like, derived from terrestrial sources, equivalent to peak A (ref. 34, 38 and 46) |
|
|
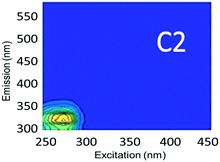
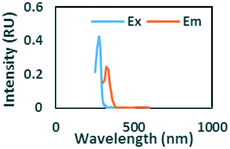
Ex/Em at 260–290/322. Found only in gasoline and diesel polluted samples. Also observed by Zhou, et al.42 as component 2. Related to Pyrene by Beltra et al.43 |
|
|
Ex/Em at 275/332 nm. Observed in gasoline and diesel spiked samples. Related to oil by Zhou, et al.42 and Zhou, et al.47 related to naphthalene by Mendoza et al.44 and Christensen et al.45 |
|
|
Ex/Em of 370/456 nm. Due to aromatic-humic-like components. Equivalent to peak C (ref. 34 and 48) |
|
|
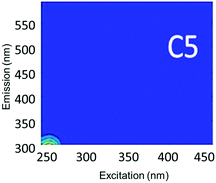
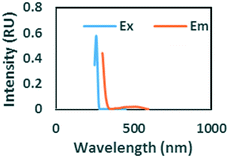
Ex/Em of 260/290 nm. Found only in ibuprofen spiked samples. Also observed by Sádecká et al.37 due to ibuprofen |
Component C2 was in almost the same position as the fluorescent peak associated with gasoline (at Ex/Em maxima at 275/322 nm), and C3 corresponded to the peak of diesel (at 275/332 nm) (Fig. 3). Both C2 and C3 are similar to oil related components in other studies.42 Beltra et al.43 observed a peak similar to C2 in their study, and this resulted from the presence of pyrene. Similarly, Mendoza et al.44 and Christensen et al.45 observed a peak similar to C3, which was due to the presence of naphthalene. Both naphthalene and pyrene are petroleum hydrocarbons and both possess aromatic rings that enable them to fluoresce. As expected, high Fmax values for both of these components were found in our diesel and gasoline spiked samples. C2 was more prominent in gasoline spiked samples while C3 was often more predominant in diesel spiked samples (Table S4†). Since hydrocarbon based fuels have a mixture of many aromatic compounds which may fluoresce with different peaks, our hypothesis was that there may be hidden peaks that would be more suitable for monitoring such compounds that we may have missed by focusing on the usual five peaks. However, PARAFAC demonstrated otherwise.
Since lopinavir, caffeine and isoxathion have maximum peaks in similar positions to diesel and gasoline, creek water spiked with these contaminants also contained substantial amounts of C2 and C3 (Table S4†). Peaks B and T associated with tryptophan-like and tyrosine-like organic compounds overlap with the maximum Ex/Em peaks of synthetic organic contaminants in the regions of components C2 and C3. Therefore, the tertiary effluent, which is expected to contain substantial amounts of tyrosine-like and tryptophan-like compounds, also showed high amounts of components C2 and C3.
Component C5 (with an Ex/Em maximum at 260/290 nm) had high Fmax values only in the ibuprofen spiked samples (Table S4†). A PARAFAC component specifically related to ibuprofen has not previously been identified. However, using peak-picking techniques, Sádecká et al.37 also identified this peak location to correspond to ibuprofen. It is worth noting that samples not spiked with ibuprofen did not have any amount of C5, which suggests that ibuprofen was not present in any source waters or treated waters at detectable concentrations.
3.4 Monitoring with an portable submersible fluorometer
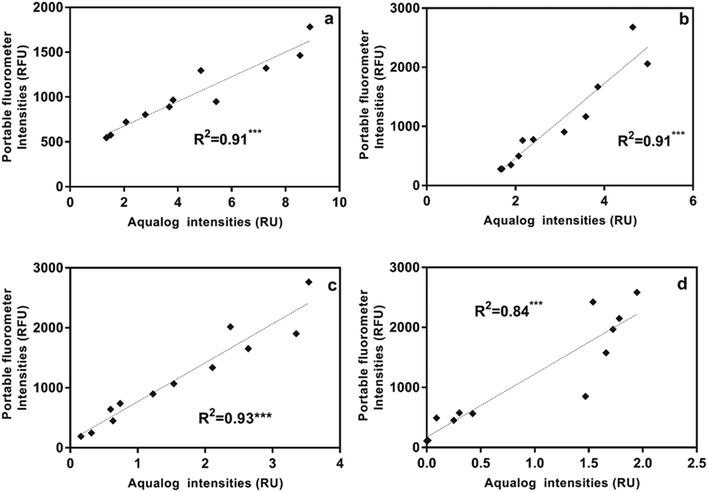
Using the portable submersible fluorometer, we found significant relationships between Region T fluorescence intensities (tryptophan-like substance sensor) and contaminant concentrations (Table S5†). Fig. 4 shows Region T fluorescence for contaminants added to tertiary effluent to illustrate these relationships. Scatterplots for contaminants added to other water types were also produced and are found in the ESI† (Fig. S4). It was initially surprising that the linear regressions determined using the portable fluorometer had higher R2 values than those calculated for experiments using the benchtop fluorometer (Fig. S3†), which is considered to be a “gold standard” instrument in terms of its high sensitivity and high signal:noise ratio. The likely reason is that we used the benchtop instrument to track fluorescence intensities at wavelength pairs associated specifically with peaks B and T. Therefore, due to the high accuracy and precision of the benchtop instrument, the specific peaks of some contaminants were missed. For example, in the case of ibuprofen, when the specific peak (peak I) was intentionally tracked, relationships were found to be much more significant. By contrast, optical filters of the portable instrument capture a broader fluorescence band centered on the tryptophan-like peak, which can track multiple compounds (including ibuprofen) that fluoresce within this band. The in situ portable instrument is therefore advantageous for online applications, such as source water control for water treatment and water reuse systems in which a range of microbial and chemical constituents may be present. The Region T sensor was well suited to tracking the chemicals used in our study, and would likely be able to track other contaminants shown in Fig. 1. Experiments targeting different chemicals selected based more on their molecular structure than on the class of chemical (as in our study) are needed to evaluate if fluorescent regions other than the Region T peak are associated with contaminants of interest for source water protection or water reuse treatment systems.3.5 Fluorometer sensitivity
It is useful for performance monitoring and contaminant detection applications to understand the lowest contaminant concentrations that can be detected by benchtop and portable fluorometers. Different water types will have different background concentrations and the instrument detection limits (IDLs) must, therefore, be calculated separately for each water type. Using our four water sources we found the IDLs for tryptophan-like fluorescence intensities to range from 0.013 RU for UV-AOP product water to 1.237 RU for tertiary effluent for the Aqualog benchtop fluorometer (Table S6†). The IDLs for the Turner in situ portable fluorometer ranged from 157.09 for post-ozone water to 227.31 RFU for tertiary effluent water for the Region T peak and from 26.56 for UV-AOP water to 4296.97 RFU for tertiary effluent for the CDOM peak (Table S7†). In other words, below these IDLs it would not be possible to distinguish the contaminant from the background fluorescence of the different water sources.In addition to determining the IDL for different water types, it is also necessary to determine the lowest concentrations at which the chemical in question can still be distinguished from the background. We refer to this as a compound-specific detection limit. Using a benchtop fluorometer (Varian Cary Eclipse) with lower sensitivity (lower signal to noise ratio), Baker et al.6 found the detection limit for tryptophan-like peak intensity for pure tryptophan in deionized water to be 0.9 ppb. Using the same approach, we spiked three of the contaminants in this study (ibuprofen, gasoline, and diesel) into three water types (UV-AOP, post-ozone and tertiary effluent) at parts per trillion (ppt) and ppb concentrations. Our results indicate that the bench top fluorometer was able to track ibuprofen at concentrations <2 ppb in UV-AOP and post-ozone water sources when peak I intensity was monitored (Fig. S5†) but was able in tertiary effluent. Peak I intensities were greater than the IDL at this concentration and increasing ibuprofen concentrations resulted in a linear fluorescence response (Fig. S5†). In the tertiary effluent, although there was a linear positive correlation between Ibuprofen concentration and peak I intensities, the intensities were below the IDL (Fig. S5†).
For gasoline and diesel fuels in UV-AOP water, Peak B intensities measured on the benchtop fluorometer were greater than the IDL at concentrations lower than ∼0.5 ppb (Fig. S5†). In the tertiary effluent and post-ozone water, the benchtop was not able to detect peak B intensities at concentrations up to 1 ppb. This suggests that at fairly low concentrations, gasoline and diesel could not be differentiated from the background fluorescence in these waters, (Fig. S5†) until concentrations reached the ppm level (Fig. S2†). The lack of relationships between peak B and gasoline and diesel at low concentrations may be due to the volatile nature of the two fuels and rapid loss of the fluorescent chemicals from water.
By contrast, the portable submersible fluorometer equipped with the Region T sensor showed linear relationships starting from concentrations as low as 0.5 ppb of gasoline and diesel (Fig. S6†). Our results also show that fluorescence intensities due to gasoline and diesel addition were higher than the IDL for all water types and had a linear relationship with fluorescence above 0.5 ppb for both (Fig. S6†). Due to the mismatch of the Region T sensor fluorescence band and the ibuprofen peak, ibuprofen addition could not be detected using the submersible fluorometer at concentrations <6 ppb in any water type (Fig. S6†). Nevertheless, the low detection limits for other chemicals and the 3 ppb detection limit for tryptophan standard, as described by the instrument manufacturer,29 indicate that the portable instrument is as good as the benchtop instrument in terms of detecting fluorescent chemicals, such as diesel and gasoline.
3.6 Ratio of tryptophan-like (Region T) to CDOM peak intensities
As was presented in Fig. 1 surface water sources and wastewater effluent used in water reuse systems have substantial background fluorescence due to natural organic matter already present in the water. One approach for trying to discern fluorescent contaminants from the background fluorescence is to take a ratio of fluorescence intensities in two regions, one representative of pollutants and the other representative of background fluorescence. Assuming that the tryptophan-like region is where most synthetic organic contaminants fluoresce, it would be expected that, when contamination events occur, the fluorescence intensity in this region will increase substantially in comparison to the region associated with humic-like substances found in natural waters (e.g., Fig. 1). Therefore, we evaluated whether tracking the ratio of tryptophan-like to CDOM peak intensities would provide better relationships with contaminant concentrations.Our results from the 3D benchtop fluorometer revealed that the ratio of tryptophan-like to CDOM peak intensities for gasoline spiked samples was linear with increasing contaminant concentration (Fig. S7†) and could therefore also serve as a robust method for tracking this contaminant. Interestingly, as the purity of the water increased (from tertiary effluent to UV-AOP water) the ratios also increased by approximately an order of magnitude for each water type. This trend reflects the much lower background CDOM fluorescence in the UV-AOP water compared to the tertiary effluent or creek water background. In the case of our diesel-spiked samples, the relationship was not linear (Fig. S7†), presumably due to the rapid volatilization of diesel that also produced poor relationships in earlier titrations with diesel (e.g., Fig. S2†). We did not evaluate the ratio for ibuprofen since it has little to no effect on tryptophan-like peak intensities.
For in situ fluorescence with the portable submersible fluorometer, our monitoring of ratios produced linear relationships in some water types, but there was generally more variability using this ratio technique (Fig. S7†) than by tracking the tryptophan-like peak region directly (e.g., Fig. S4†). One reason for this lack of correlation is that the wide fluorescence bands captured by sensors in the Turner fluorometer result in an overflow of contaminant fluorescence, which is centered in the tryptophan-like region, into the humic-like fluorescence region. This was not only true for the diesel peak, but also for isoxathion and lopinavir, which also overlap with the CDOM region of the submersible fluorometer slightly (see Fig. 2c and d). Wang et al.49 observed that the presence of protein-like and humic-like components in water samples resulted in overlap behavior between their fluorescence peaks related to inter-component interactions. Additionally, Wang et al.49 also concluded that fluorescence of the protein-like components could be greatly quenched by the humic-like components in the samples. This effect therefore makes the ratio of Region T fluorescence to CDOM fluorescence for the portable submersible fluorometer less effective for contaminant monitoring (Fig. S8†).
4. Conclusion
Our results indicate that among the commonly identified DOM fluorescent peaks, peak B with Ex/Em of 275/310 nm for a 3D benchtop and the Region T peak for a portable submersible fluorometer were the most suitable peaks for the monitoring of organic contaminants used in this study. Overall, the significant linear increase in fluorescence intensities, using both submersible and benchtop instruments, with increased contaminant concentrations in a range of water types suggest that fluorescence can be used for real-time monitoring of fluorescent organic contaminants in water. Since multiple chemicals can possess similar fluorescence peaks, observations of fluorescence in a specific region may signal that more than one contaminant is present. Such observations are still particularly useful for monitoring product water, where no fluorescent chemicals should be present (e.g., Fig. 1f). Fluorescence monitoring efforts can serve as a first alert before more advanced techniques like gas and liquid chromatography are used.Our results further demonstrated that the submersible fluorometer was able to track all contaminants used in this study with compound-specific detection limits that were similar to those found using the benchtop instrument. This unexpectedly high performance is possible because the submersible instrument uses a filter with fairly broad wavelength bands in both excitation and emission, which can capture the fluorescence of more chemicals. By contrast, the benchtop fluorometer tracked the Ex/Em wavelengths for specific peaks, which resulted in the fluorescent peaks of some chemicals (e.g., ibuprofen) being missed. Post-processing of the 3D EEMs acquired by benchtop fluorometers would be recommended to track a range of excitation and emission wavelengths. In addition, it would be, in practice, possible to alter the Matlab algorithm so that the intensity of any unique peak that stands out from the background is identified. In this way, new fluorescence peaks associated with unexpected contaminants, such as peak I, would not be missed.
It is worth noting that fluorescent organic compounds may be a useful warning system indicating the presence of other non-fluorescent chemicals. The visualization of 3D EEMs would also be advantageous for easily tracking contaminants, especially in high quality permeates or product waters where any deviation from the typical low intensity background would likely signify the presence of organic chemicals that were not removed in earlier treatment steps. For cases when the higher costs of benchtop fluorometers (three-to-four times the cost of portable sensors) is prohibitive or when instantaneous measurements are necessary, a portable submersible fluorometer was shown to be just as responsive to detecting contaminant concentrations as the “gold standard” benchtop instrument.
Conflicts of interest
There are no conflicts to declare.Acknowledgements
We thank A. Sanchez and D. Parsons for assistance with experimental setup and sample collection and F. Pinongcos, C. Campbell, K. Snyder, and A. Bigelow for assistance with EEM spectral acquisition. We acknowledge A. Kolakovsky of Trussell Technologies and W. Mercado of North City Water Reclamation Facility for assistance with sample collection from the Advanced Water Purification Facility of San Diego. We also acknowledge funding from National Science Foundation CBET#1705901. Support was provided by SDSU President's Leadership Fund, the William Leonhard Jr. Endowment, and the College of Engineering at San Diego State University.References
- M. V. Storey, B. van der Gaag and B. P. Burns, Advances in on-line drinking water quality monitoring and early warning systems, Water Res., 2011, 45, 741–747 CrossRef CAS PubMed.
- J. Hall, A. D. Zaffiro, R. B. Marx, P. C. Kefauver, K. E. Radha, R. C. Haught and J. G. Herrmann, On-line water quality parameters as indicators of distribution system contamination, J. – Am. Water Works Assoc., 2007, 99(1), 66–77 CrossRef CAS.
- SWCB, A proposed framework for regulating direct potable reuse in California, 2018, https://www.waterboards.ca.gov/drinking_water/certlic/drinkingwater/documents/direct_potable_reuse/dprframewk.pdf, Last accesses on 6/02/2018.
- J. R. Lakowicz, Principles of Fluorescence Spectroscopy, Springer, New York, USA, 2006, 3rd edn Search PubMed.
- J. H. Goldman, S. A. Rounds and J. A. Needoba, Applications of Fluorescence Spectroscopy for Predicting Percent Wastewater in an Urban Stream, Environ. Sci. Technol., 2012, 46, 4374–4381 CrossRef CAS PubMed.
- A. Baker, S. A. Cumberland, C. Bradley, C. Buckley and J. Bridgeman, To What Extent Can Portable Fluorescence Spectroscopy Be Used in the Real-Time Assessment of Microbial Water Quality?, Sci. Total Environ., 2015, 532, 14–19 CrossRef CAS PubMed.
- J. P. R. Sorensen, D. J. Lapworth, B. P. Marchant, D. C. W. Nkhuwa, S. Pedley, M. E. Stuart, R. A. Bell, M. Chirwa, J. Kabika, M. Liemisa and M. Chibesa, In-situ tryptophan-like fluorescence: A real-time indicator of faecal contamination in drinking water supplies, Water Res., 2015, 81, 38–46 CrossRef CAS PubMed.
- Y. Zhou, E. Jeppesen, Y. Zhang, K. Shi, X. Liu and G. Zhu, Dissolved Organic Matter Fluorescence at Wavelength 275/342 Nm as a Key Indicator for Detection of Point-Source Contamination in a Large Chinese Drinking Water Lake, Chemosphere, 2016, 144, 503–509 CrossRef CAS PubMed.
- M. Sgroi, P. Roccaro, G. V. Korshin, V. Greco, S. Sciuto, T. Anumol, S. A. Snyder and F. G. A. Vagliasindi, Use of fluorescence EEM to monitor the removal of emerging contaminants in full scale wastewater treatment plants, J. Hazard. Mater., 2016, 323, 367–376 CrossRef PubMed.
- W. T. Li, J. Jin, Q. Li, C. F. Wu, H. Lu, Q. Zhou and A. M. Li, Developing LED UV Fluorescence Sensors for Online Monitoring DOM and Predicting DBPs Formation Potential during Water Treatment, Water Res., 2016, 93, 1–9 CrossRef CAS PubMed.
- B. F. Trueman, S. A. MacIsaac, A. K. Stoddart and G. A. Gagnon, Prediction of disinfection by-product formation in drinking water via fluorescence spectroscopy, Environ. Sci.: Water Res. Technol., 2016, 2, 383–389 RSC.
- Y. Shutova, A. Baker, J. Bridgeman and R. K. Henderson, On-Line Monitoring of Organic Matter Concentrations and Character in Drinking Water Treatment Systems Using Fluorescence Spectroscopy, Environ. Sci.: Water Res. Technol., 2016, 2, 749–760 RSC.
- S. Singh, R. K. Henderson, A. Baker, R. M. Stuetz and S. J. Khan, Online fluorescence monitoring of RO fouling and integrity: analysis of two contrasting recycled water schemes, Environ. Sci.: Water Res. Technol., 2015, 1, 689–698 RSC.
- M. Sgroi, P. Roccaro, G. V. Korshin and F. G. A. Vagliasindi, Monitoring the Behavior of Emerging Contaminants in Wastewater-Impacted Rivers Based on the Use of Fluorescence Excitation Emission Matrixes (EEM), Environ. Sci. Technol., 2017, 51, 4306–4316 CrossRef CAS PubMed.
- C. Liu, P. Li, X. Tang and G. V. Korshin, Ozonation effects on emerging micropollutants and effluent organic matter in wastewater: characterization using changes of three-dimensional HP-SEC and EEM fluorescence data, Environ. Sci. Pollut. Res., 2016, 23, 20567–20579 CrossRef CAS PubMed.
- S. A. Baghoth, S. K. Sharma and G. L. Amy, Tracking natural organic matter (NOM) in a drinking water treatment plant using fluorescence excitation - emission matrices and PARAFAC, Water Res., 2010, 45, 797–809 CrossRef PubMed.
- J. Bridgeman, M. Bieroza and A. Baker, The Application of Fluorescence Spectroscopy to Organic Matter Characterization in Drinking Water Treatment, Rev. Environ. Sci. Biotechnol., 2011, 10, 277–290 CrossRef CAS.
- Y. Shutova, A. Baker, J. Bridgeman and R. K. Henderson, Spectroscopic Characterisation of Dissolved Organic Matter Changes in Drinking Water Treatment: From PARAFAC Analysis to Online Monitoring Wavelengths, Water Res., 2014, 54, 159–169 CrossRef CAS PubMed.
- M. Vera, S. Cruz, M. R. Boleda, J. Mesa, J. Martín-Alonso, S. Casas, O. Gibert and J. L. Cortina, Fluorescence Spectroscopy and Parallel Factor Analysis as a Dissolved Organic Monitoring Tool to Assess Treatment Performance in Drinking Water Trains, Sci. Total Environ., 2017, 584–585, 1212–1220 CrossRef CAS PubMed.
- A. Leow, J. Burkhardt, W. E. Platten, B. Zimmerman, N. E. Brinkman, A. Turner, R. Murray, G. Sorial and J. Garland, Application of the CANARY event detection software for real-time performance monitoring of decentralized water reuse systems, Environ. Sci.: Water Res. Technol., 2017, 3, 224–234 RSC.
- S. Trussel, A. N. Pisarenko and E. Chen, Implementation of Advanced Water Purification facility Extended Testing 2015, https://www.sandiego.gov/sites/default/files/implementation_of_awp_facility_extended_testing_project_report_july_2015.pdf, Last accessed on 6/02/ 2018 Search PubMed.
- C. K. Remucal, The Role of Indirect Photochemical Degradation in the Environmental Fate of Pesticides: A Review, Environ. Sci.: Processes Impacts, 2014, 16, 628 RSC.
- N. Bolong, A. F. Ismail, M. R. Salim and T. Matsuura, A Review of the Effects of Emerging Contaminants in Wastewater and Options for Their Removal, Desalination, 2009, 238, 229–246 CrossRef.
- T. P. Wood, C. S. J. Duvenage and E. Rohwer, The occurrence of anti-retroviral compounds used for HIV treatment in South African surface water, Environ. Pollut., 2015, 199, 235–243 CrossRef CAS PubMed.
- O. A. Abafe, J. Späth, J. Fick, S. Jansson, C. Buckley, A. Stark, B. Pietruschka and B. S. Martincigh, LC-MS/MS determination of antiretroviral drugs in influents and effluents from wastewater treatment plants in KwaZulu-Natal, South Africa, Chemosphere, 2018, 200, 660–670 CrossRef CAS PubMed.
- S. Trapp, A. Köhler, L. C. Larsen, K. C. Zambrano and U. Karlson, Phytotoxicity of Fresh and Weathered Diesel and Gasoline to Willow and Poplar Trees, Soils and Sediments, J. Soils Sediments, 2001, 1, 71–76 CrossRef CAS.
- H. Saito, J. Koyasu, K. Yoshida, T. Shigeoka and S. Koike, Cytotoxicity of 109 chemicals to goldfish GFS cells and relationships with 1-octanol/water partition coefficients, Chemosphere, 1993, 26, 1015–1028 CrossRef CAS.
- C. A. Stedmon and R. Bro, Characterizing dissolved organic matter fluorescence with parallel factor analysis : a tutorial, Environ. Res., 2008, 6, 572–579 CAS.
- Turner Designs, C3 and C6p Submersible Fluorometers User's Manual, 2016, Available at: http://docs.turnerdesigns.com/t2/doc/manuals/998-2300.pdf, Last accessed on 30th November 2018 Search PubMed.
- C. J. Watras, P. C. Hanson, T. L. Stacy, K. M. Morrison, J. Mather, Y. H. Hu and P. Milewski, A temperature compensation method for CDOM fluorescence sensors in freshwater, Limnol. Oceanogr.: Methods, 2011, 9, 296–301 CrossRef CAS.
- E. Ryder, E. Jennings, E. De Eyto, M. Dillane, C. NicAonghusa, D. C. Pierson, K. Moore, M. Rouen and R. Poole, Temperature quenching of CDOM fluorescence sensors: temporal and spatial variability in the temperature response and a recommended temperature correction equation, Limnol. Oceanogr.: Methods, 2012, 10, 1004–1010 CrossRef CAS.
- J. Wasswa and N. Mladenov, Improved Temperature Compensation for In Situ Humic-Like and Tryptophan-Like Fluorescence Acquisition in Diverse Water Types, Environ. Eng. Sci., 2018, 35, 1–7 CrossRef.
- P. G. Coble, S. A. Green, N. V. Blough and R. B. Gagosian, Characterization of Dissolved Organic Matter in the Black Sea by Fluorescence Spectroscopy, Nature, 1990, 348, 432–435 CrossRef CAS.
- E. Parlanti, K. Worz, L. Geoffroy and M. Lamotte, Dissolved Organic Matter Fluorescence Spectroscopy as a Tool to Estimate Biological Activity in a Coastal Zone Submitted to Anthropogenic Inputs, Org, Geochemistry, 2000, 31, 1765–1781 CrossRef CAS.
- P. G. Coble, C. E. Del Castillo and B. Avril, Distribution and Optical Properties of CDOM in the Arabian Sea during the 1995 Southwest Monsoon, Deep-Sea Research Part II, Stud. Oceanogr., 1998, 45, 2195–2223 CrossRef CAS.
- C. A. Stedmon and S. Markager, Resolving the Variability in Dissolved Organic Matter Fluorescence in a Temperate Estuary and Its Catchment Using PARAFAC Analysis, Limnol. Oceanogr., 2005, 50, 686–697 CrossRef CAS.
- J. Sádecká, M. Čakrt, A. Hercegová, J. Polonský and I. Skačáni, Determination of Ibuprofen and Naproxen in Tablets, J. Pharm. Biomed. Anal., 2001, 25, 881–891 CrossRef.
- P. G. Coble, Characterization of Marine and Terrestrial DOM in Seawater Using Excitation-Emission Matrix Spectroscopy, Mar, Chem, 1996, 51, 325–346 CAS.
- Y. Yamashita, R. Jaffé, N. Maie and E. Tanoue, Assessing the Dynamics of Dissolved Organic Matter (DOM) in Coastal Environments by Excitation Emission Matrix Fluorescence and Parallel Factor Analysis (EEM-PARAFAC), Limnol. Oceanogr., 2008, 53, 1900–1908 CrossRef CAS.
- R. K. Henderson, A. Baker, K. R. Murphy, A. Hamblya, R. M. Stuetz and S. J. Khan, Fluorescence as a Potential Monitoring Tool for Recycled Water Systems : A Review, Water Res., 2009, 43, 863–881 CrossRef CAS PubMed.
- Turner Designs, Technical Note: An Introduction to Fluorescence Measurements. Turn. Des. 1–15 (2015). Available at: http://www.turnerdesigns.com/t2/doc/appnotes/998-0050.pdf, Last accesses on 6/02/ 2018 Search PubMed.
- Z. Zhou, L. Guo, A. M. Shiller, S. E. Lohrenz, V. L. Asper and C. L. Osburn, Characterization of oil components from the Deepwater Horizon oil spill in the Gulf of Mexico using fluorescence EEM and PARAFAC techniques, Mar. Chem., 2013, 148, 10–21 CrossRef CAS.
- J. L. Beltra, R. Ferrer and J. Guiteras, Multivariate calibration of polycyclic aromatic hydrocarbon mixtures from excitation ± emission fluorescence spectra, Anal. Chim. Acta, 1998, 373, 311–319 CrossRef.
- W. G. Mendoza, D. D. Riemer and R. G. Zika, Application of fluorescence and PARAFAC to assess vertical distribution of subsurface hydrocarbons and dispersant during the Deepwater Horizon oil spill, Environ. Sci.: Processes Impacts, 2013, 15, 1017 RSC.
- J. H. Christensen, A. B. Hansen, J. Mortensen and O. Andersen, Characterization and matching of oil samples using fluorescence spectroscopy and parallel factor analysis, Anal. Chem., 2005, 77, 2210–2217 CrossRef CAS PubMed.
- M. Xie, N. Mladenov, M. W. Williams, J. C. Neff, J. Wasswa and M. P. Hannigan, Water soluble organic aerosols in the Colorado Rocky Mountains, USA: composition, sources and optical properties, Sci. Rep., 2016, 6, 39339 CrossRef CAS PubMed.
- Z. Zhou, L. Guo and C. L. B. Osburn, Fluorescence EEMs and PARAFAC techniques in the analysis of petroleum components in the water column, 2015, ch. 1–29 Search PubMed.
- J. B. Fellman, E. Hood and R. G. M. Spencer, Fluorescence Spectroscopy Opens New Windows into Dissolved Organic Matter Dynamics in Freshwater Ecosystems: A Review, Limnol. Oceanogr., 2010, 55, 2452–2462 CrossRef CAS.
- Z. Wang, J. Cao and F. Meng, Interactions between protein-like and humic-like components in dissolved organic matter revealed by fluorescence quenching, Water Res., 2014, 68, 404–413 CrossRef PubMed.
Footnotes |
| † Electronic supplementary information (ESI) available. See DOI: 10.1039/c8ew00472b |
| ‡ Author is currently at Syracuse University, Syracuse, New York, USA. |
| This journal is © The Royal Society of Chemistry 2019 |

