
 Open Access Article
 This Open Access Article is licensed under a Creative Commons Attribution-Non Commercial 3.0 Unported Licence
Children's exposure to perfluoroalkyl acids – a modelling approach†‡
Fabian G. P.
Balk
 *ab,
Kerstin
Winkens Pütz
ac,
Anton
Ribbenstedt
a,
Melissa I.
Gomis
ad,
Marko
Filipovic
ae and
Ian T.
Cousins
*a
*ab,
Kerstin
Winkens Pütz
ac,
Anton
Ribbenstedt
a,
Melissa I.
Gomis
ad,
Marko
Filipovic
ae and
Ian T.
Cousins
*a
aDepartment of Environmental Science and Analytical Chemistry (ACES), Stockholm University, Svante Arrhenius väg 8c, 10691 Stockholm, Sweden. E-mail: Ian.Cousins@aces.su.se; Fabian.Balk@eawag.ch
bDepartment of Environmental Toxicology, Swiss Federal Institute of Aquatic Science and Technology, Überlandstrasse 133, 8600 Dübendorf, Switzerland
cDepartment of Environmental Research and Monitoring, Swedish Museum of Natural History, P.O. Box 50007, 10405 Stockholm, Sweden
dUniversité Paris-Saclay, 91190 Saint-Aubin, France
eNIRAS Sweden AB, Fleminggatan 14, Box 70375, 107 24 Stockholm, Sweden
First published on 21st August 2019
Abstract
Adults are mainly exposed to per- and polyfluoroalkyl substances (PFASs) via ingestion of food, inhalation of air and ingestion of dust, whereas for children the exposure to PFASs is largely unknown. This study aimed to reconstruct the serum concentrations of perfluorooctanoic acid (PFOA), perfluorooctane sulfonic acid (PFOS) and perfluorohexane sulfonic acid (PFHxS) in children after infancy up to 10.5 years of age and to test if dietary intake is the major exposure pathway for children to PFOA, PFOS and PFHxS after infancy. For this work, a dataset from a Finnish child cohort study was available, which comprised serum concentrations of the studied perfluoroalkyl acids (PFAAs) and PFAS concentration measurements in dust and air samples from the children's bedrooms. The calculated PFAA intakes were used in a pharmacokinetic model to reconstruct the PFAA serum concentrations from 1 to 10.5 years of age. The calculated PFOA and PFOS intakes were close to current regulatory intake thresholds and diet was the major exposure medium for the 10.5 year-olds. The one-compartment PK model reconstructed median PFOA and PFOS serum concentrations well compared to corresponding measured median serum concentrations, while the modelled PFHxS serum concentrations showed a constant underestimation. The results imply that children's exposure to PFOA and PFOS after breastfeeding and with increasing age resembles the exposure of adults. Further, the children in the Finnish cohort experienced a rather constant exposure to PFOA and PFOS between 1 and 10.5 years of age. The PFHxS exposure sources and respective pharmacokinetic parameter estimations need further investigation.
Environmental significanceThe exposure of adults to PFASs has been well studied, while children's exposure to PFASs is poorly understood, especially in the period after cessation of breastfeeding. Nevertheless, understanding childhood exposure is of high importance given that exposure to PFASs is hypothesized to have the most pronounced negative effects during this period. Mechanistic mass balance models are key to determine which exposure pathways to PFASs are relevant and where knowledge gaps on exposure to PFAS exist. With the present modelling approach, it was possible to reconstruct the historic exposure to PFASs of a child cohort. The results imply that individuals have highest PFAS intakes during infancy and that PFAS serum concentrations decrease thereafter on average due to lower PFAS intakes. |
1. Introduction
Long-chained per- and polyfluoroalkyl substances (PFASs) are detected worldwide in human blood among which perfluorooctanoic acid (PFOA), perfluorooctane sulfonic acid (PFOS) and perfluorohexane sulfonic acid (PFHxS) are the most abundant.1,2 In general, adults are directly exposed to PFOA, PFOS and PFHxS (termed PFAAs hereafter) through the ingestion of dust3,4 and food,5 the inhalation of air4 and the intake of drinking water.6 Besides the direct exposure to PFAAs, indirect exposure to PFAAs can also occur in the body following uptake and biotransformation of PFAA-precursors, such as perfluorooctane sulfonamide derivates7 and fluorotelomer alcohols (FTOHs,8). In background exposed adult populations, dietary uptake has been concluded to be the main exposure pathway of PFOA, PFOS and PFHxS (e.g.ref. 1 and 5).The exposure assessment of young children to PFAAs is challenging due to rapid physiological changes, based on which the most prominent phenomenon to consider is growth dilution, i.e. the dilution of a pollutant's concentration in an organism as a result of an increase in body weight. Besides the exposure pathways that adults experience, children are additionally exposed to PFAAs during the prenatal period via transplacental transfer and during infancy via breastfeeding (e.g.ref. 9). For infants (from birth to 1 year of age) and children (<11 years of age), dust is hypothesized to be of greater importance for the exposure to PFAS than for adults.10 The greater exposure to dust is argued to be caused by children's different behaviour, specifically, a higher hand-to-mouth contact and object-to-mouth frequency compared to adults.10 Furthermore, the exposure to PFAAs via food is unclear for children in later life stages. Their diet consists of different types of products and quantities compared to adults' diet. While infant food has been studied frequently, only one study considered the diet during later life stages of childhood.11 As a result, current exposure and monitoring studies give an incomplete picture of children's exposure to PFAAs,12 which hampers the estimation of their external and internal exposure (e.g. serum concentrations) to PFAAs.13 An exposure assessment of PFAAs for children becomes even more relevant in the light of recently published guidelines on tolerable weekly intakes (TWIs) for PFOA and PFOS by European authorities.14 A first approximation of the tolerable daily intake (TDI) from the TWI for PFOS and PFOA revealed a drastic decrease of the previous threshold values. For PFOS, the reason to lower the TDI from 150 ng per kg bw per d down to 1.86 ng per kg bw per d (ref. 14) was the associated decrease in antibody response to vaccination in children with PFOS exposure.14,15 For PFOA, the TDI was lowered from 1500 ng per kg bw per d to 0.86 ng per kg bw per d, while for PFHxS currently no TDIs are available.14
To date, only a few studies exist that focused on the prediction of PFAA serum trends in infants and children.16,17 The first applied a physiologically based pharmacokinetic (PBPK) model to describe the complex interactions between the mother and the foetus during prenatal stages and the subsequent breastfeeding period.16 It revealed that the transplacental and the milk-to-serum transfers are the key factors for infants' exposure to PFOA and PFOS.16 Thereafter, two more recent studies successfully applied one-compartment PK models to predict PFOA and PFOS concentrations in serum based on the transplacental and milk-to-serum transfers in addition to the other exposure pathways such as dietary intake.17,18 Verner et al. (2016) focused on the exposure to PFAAs during foetal development, until early childhood and could explain 52–62% of the measured variability in PFAA serum concentrations of 0.5 and 3 year-old children.17 However, a detailed exposure assessment of later childhood stages (>3 years of age) is missing so far.
The aim of this project was (1) to reconstruct the serum concentrations of PFOA, PFOS and PFHxS in children after infancy up to 10.5 years of age, (2) to test whether dietary intake is the major exposure pathway for children to PFOA, PFOS and PFHxS after infancy and (3) to compare the modelled intake of PFOA and PFOS to the updated regulatory TDIs and other intake estimates from literature. To test these objectives, a comprehensive biomonitoring dataset on PFAA serum concentrations in children from a Finnish child cohort was used.19 PFAA serum concentrations of 44 children sampled at 1 year, 6 and 10.5 years of age20 along with dust and air PFAA concentrations, from the same children's sleeping rooms21,22 were combined in this current work. The children's exposure to PFOA, PFOS and PFHxS was assessed by linking respective concentrations in several external exposure media to the children's internal exposure, i.e. the respective PFAA's serum concentration, using a simple one-compartment pharmacokinetic (PK) model.
2. Methods
2.1. The child cohort and data
For the current modelling approach, serum,20 indoor air,21 dust22 and tap water concentrations (unpublished data) of PFASs from a child cohort study were used. The serum concentrations of PFOA, PFOS and PFHxS were analysed for each of the 44 children at the age of 1 year (2005/6), 6 years (2010/11) and 10.5 years (2014/15).20 The children were a subgroup of a longitudinal child study (LUKAS 2) from the Kuopio area in Finland.19 Within LUKAS 2, the individuals' body weights were documented as well. The LUKAS 2 study was approved by the Research Ethics Committee, Hospital District of Northern Savo, Kuopio, Finland (case number 48/2004). The serum samples were obtained from the National Institute for Health and Welfare, Environmental Health Unit, Kuopio, Finland.In addition to the PFAA concentrations, PFAA-precursor concentrations from air and dust samples from the children's bedrooms were included in the model to estimate the importance of indirect exposure to PFAAs.21,22 The air, dust and tap water samples were taken when the children were 10.5 years old. For more information, consult the studies by Winkens et al.21,22 and Winkens.12 For the present exposure assessment, if available, only the linear isomers, or the sum of isomers of the studied PFAAs and their precursors were used for intake calculations and the subsequent modelling.
2.2. Intake calculations
The estimated daily intake (EDI) represents the bodyweight normalized daily intake (ng per kg bw per d) of one studied PFAA via the respective direct and indirect exposure pathways. Due to the available dataset, it was only possible to calculate a detailed PFAA intake for the children when they were 10.5 years old. The considered PFAA precursors and their corresponding PFAAs are shown in Table 1. In general, the calculation of the total EDIs of PFAAs for each 10.5 year-old is based on dust and air concentrations from the child's bedroom and dietary concentrations from literature. Except for the tap water samples, there was no data available for the dietary PFAA intake of the Finnish child cohort. Therefore, the dietary PFAA intake was estimated from the literature (see Section 2.2.1). Dermal23 and consumer product10 exposure has been estimated to be of minor relative importance for human exposure assessments for PFAAs.24 These exposure pathways were therefore not considered in the model.| Exposure medium | PFAAa | |
|---|---|---|
| PFOA | PFOS | |
| a No PFHxS precursors were available from the experimental studies. x:y refers to a specific FTOH, where x is the number of fluorinated carbon atoms in the chain and y is the number of non-fluorinated carbon atoms, i.e. the ethyl moiety. For further acronyms see ESI. b N/A = not available. | ||
| Indoor air | 8:2 FTOH | MeFOSE, EtFOSE |
| Diet | N/Ab | PFOSA |
| House dust | 6:2/8:2 diPAP, 8:2/8:2 diPAP, 8:2/10:2 diPAP, 8:2/12:2 diPAP, 8:2 FTOH | EtFOSAA, EtFOSE |
Eqn (1) shows the calculations for the dust intake. Dietary ingestion and air inhalation were estimated in a similar way by using the corresponding exposure media's concentrations and consumption or inhalation rates (see ESI Section 1.1‡).
 | (1) |
The PFAA concentrations of the tap water samples from the child cohort are included in the dietary intake. In detail, the dietary concentrations of the different foods were grouped and multiplied with the respective bodyweight normalized daily consumption rate of that specific food group (gfood per kg bw per day). The applied consumption rate was specific to that of Finnish 3 to <10 year-olds.31 In the last step, the intakes of the different food groups were summed up to receive one value for the dietary intake of each child.
2.3. Scenario based exposure assessment and parameters
A scenario-based exposure assessment was applied with a low, intermediate and high exposure scenario, of which the intermediate exposure scenario was considered closest to a realistic exposure scenario.5,10,24 The PK parameters used for the EDI calculations comprised the tissue specific absorption efficiencies and biotransformation factors.The biotransformation factor describes the fraction of a PFAA precursor that is biotransformed into the respective PFAA in the human body (e.g. 8:2/8:2 diPAP results in two PFOA molecules). For 8:2 FTOH (a PFOA precursor), different PK values for the EDI calculation could be applied, since it is better studied. Based on estimates made by Trudel et al. (2008), absorption efficiencies in humans used in this study for the low, intermediate and high exposure scenarios were 0.66, 0.8 and 0.91, respectively. Next to the scenario dependent variation of the parameters in Table 2, the dietary PFAA concentration was varied based on the two sets of dietary concentrations of a lower and upper bound approach (Table S1‡).
| Substance | Ingested dust amountb, mg d−1 | Air inhalation volumeb, m3 d−1 | Absorption efficiency from airc | Gastrointestinal absorption efficiency from diet & dustd | Biotransformation factore |
|---|---|---|---|---|---|
| a See Table 1. b Scenario dependent values recommended by the US-EPA.32 c Ref. 33. d Ref. 5. e For 8:2 FTOH34 and for remaining PFASs5 biotransformation factors were applied to PFOA and PFOS precursors, which are biotransformed to PFOA and PFOS after uptake, respectively. | |||||
| 8:2 FTOH | 60; 60; 100 | 12.4; 12.4; 18.7 | 1 | 0.27; 0.38; 0.56 | 0.0006; 0.003; 0.01 |
| Other PFASsa | 60; 60; 100 | 12.4; 12.4; 18.7 | 1 | 0.66; 0.8; 0.91 | 0.095; 0.2; 0.32 |
2.4. The PK model parameters
A one-compartment PK model was applied to simulate the serum concentrations of PFOA, PFOS and PFHxS.17 The applied parameters in the PK model are the elimination half-live (t1/2, d), the volume of distribution (mL kg−1) and the children's body weights. The volume of distribution represents a proportionality factor between the chemical's concentration in blood relative to its concentration in body tissue. For PFOS and PFOA, the volume of distribution was set to 235 mL kg−1 and 200 mL kg−1, respectively, which were averaged from animal and human studies.35 No volume of distribution was available for PFHxS, thus the one of PFOS was applied, because the volume of distribution for PFOS and perfluorobutane sulfonic acid were similar (PFSA homologue with 4-carbon chain length).35,36 The elimination half-life represents the time needed in days (d) to eliminate half the chemical's amount from the body. The elimination half-lives (t1/2, d) were intrinsic elimination half-lives as defined by Russell et al. (2015) (PFOA 2.2 years, PFOS 4.35 years35). As opposed to merely monitoring the pollutant's elimination from the body (i.e. the apparent elimination half-life), the intrinsic half-life accounts for the ongoing exposure while the pollutant is eliminated at the same time.37 For PFHxS, no intrinsic half-life was available in literature, thus the commonly applied apparent half-life of PFHxS was used (ref. 38: 8.5 years). The body weight profiles of the children are based on the sex-specific median growth curves obtained from the Center for Disease Control and Prevention.39 The growth curves were adjusted for each individual by a body weight adjustment factor, which was defined as the ratio of the body weight of each 10.5 year-old over the corresponding median value from the growth curve.2.5. Model calculations
The PFAA EDIs and the model parameters were used to simulate the PFAA serum concentrations in the 44 Finnish children in the three exposure scenarios. The key equation of the model is: | (2) |
 is the change in PFAA serum concentration over time (ng mL−1 d−1), I the body weight normalized daily PFAA intake (ng (kg bw)−1 d−1) from all considered exposure pathways (see Section 2.1), Vd the volume of distribution (mL kg−1) and kelim the elimination constant (d−1) derived from the ratio of ln
![[thin space (1/6-em)]](https://www.rsc.org/images/entities/char_2009.gif) 2 over the respective half-life (t1/2, d).
2 over the respective half-life (t1/2, d).
First, the model was used to calculate the top-down estimate, which is defined as the theoretical PFAA intake (I) that is needed to result in the measured PFAA serum concentration. It is calculated by rearrangement of eqn (2) and the use of the measured PFAA serum concentrations as cs. A limitation of the top-down estimate is that it only gives the total intake from all possible exposure sources without the possibility to distinguish among their contributions to the total intake. The top-down estimate served for comparison to the derived PFAA EDIs in Table 3. The comparison indicated how close the EDIs were to the theoretical intake (i.e. top-down estimate).
| PFAA (ng (kg bw)−1 d−1) | Exposure | Exposure scenario | Top-down estimatea | ||
|---|---|---|---|---|---|
| Low | Intermediate | High | |||
| a Top-down EDIs were derived from serum measurements of the studied children at 10.5 years of age. b For PFHxS, only direct exposure could be assessed. | |||||
| PFOA | Direct | 0.16 | 0.19 | 0.53 | — |
| Indirect | 0.00064 | 0.0038 | 0.015 | — | |
| Total | 0.16 | 0.19 | 0.55 | 0.26 | |
| PFOS | Direct | 0.15 | 0.19 | 0.53 | — |
| Indirect | 0.0050 | 0.011 | 0.015 | — | |
| Total | 0.16 | 0.20 | 0.55 | 0.16 | |
| PFHxSb | Direct | 0.0026 | 0.0032 | 0.19 | — |
| Indirect | — | — | — | — | |
| Total | 0.0026 | 0.0032 | 0.19 | 0.011 | |
Secondly, the model was used to simulate the PFAA serum concentrations of each child from 1 year to 10.5 years of age by using the derived EDIs of the 10.5 year-olds (see Section 2.2). The EDI was kept constant over the modelled period from 1 year to 10.5 years of age, which was justified by the observed constant body burdens in the studied child cohort20 and the lack of PFAA concentrations from earlier years (<10.5 years of age) in the relevant exposure media.40
The serum concentrations at 1 year of age served as the initial PFAA serum concentration, from which the model set off to simulate serum concentrations in the growing children. The model was run for each child individually and incorporated individual intakes of dust and air, a generalized dietary intake (Section 2.2 and 2.2.1) and the child's weight at 10.5 years of age (i.e. body weight adjustment factor, Section 2.4). Simulated PFAA serum concentrations of each child were correlated with the corresponding measured PFAA serum concentrations of each child at the age of 6 and 10.5 years (Fig. S4‡). Further, the median PFAA serum concentrations of the child cohort were calculated from the simulations of each child and compared to measured median serum concentrations (Fig. 2). The simulated median serum concentrations of two groups, females and males, were calculated in a similar way and compared to the corresponding measured median PFAA concentrations, to gain information about sex-specific trends in the PFAA serum concentrations. However, only the weight could be used to distinguish between the individuals and the sexes. No further physiological input parameters, which could have served for the modelling were available.
The model's performance was assessed by several statistical metrics, which comprised the coefficient of determination (R2), the Student's t-test for significant deviations of the slopes of linear regressions (Tables 4 and S7, Fig. S4‡) and the root mean square deviation (RMSD).
| PFAA | Age (years) | R 2 | RMSD (±ng mL−1) | Slope significantly different from 1:1 line |
|---|---|---|---|---|
| PFOA | 6 | 0.21 | 0.99 | No |
| 10.5 | 0.08 | 0.55 | No | |
| PFOS | 6 | 0.57 | 1.6 | Yes |
| 10.5 | 0.24 | 0.68 | Yes | |
| PFHxS | 6 | 0.49 | 0.26 | No |
| 10.5 | 0.15 | 0.15 | No |
2.6. Model sensitivity and uncertainty analysis
A sensitivity and uncertainty analysis in the form of a first order error propagation was conducted to explore the model's limitations and determine the most influencing model input parameters.41 First, the sensitivity S of each model input parameter was assessed (Fig. S1–S3‡). The model input parameters I are defined as all variables applied in the EDI derivations and the parameters used in the PK model (Table S2‡). The model's sensitivity to each input parameter I was calculated as the ratio of the change in the model output (i.e. PFAA serum concentration) after increasing each I by a fixed amount ΔI, set to 0.1%
  :
: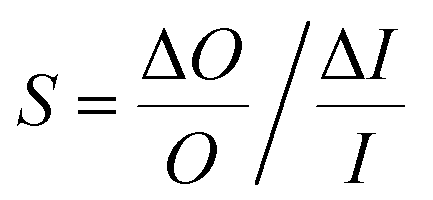 | (3) |
The sensitivity and uncertainty analyses were conducted at different child ages (2, 6 and 10.5 years of age) to assess the impact of model input parameters and the EDIs on the model results. Since the serum concentrations of the 1 year-olds were used as a model input (i.e. initial serum concentration), the sensitivity and uncertainty analysis was conducted at 2 years of age instead. This enabled the observation of changes in the impact of input parameters on early childhood (2 years of age) relative to later childhood (6 and 10.5 years of age).
Putative variance distributions for each input parameter, termed confidence factors CfI,j, were assigned dependent on available data and expert judgement (Table S2‡) to obtain a measurable impact of each input parameter's variation on the modelled serum concentrations. CfI,j is a measure of variance and uncertainty, which states that 95% of the values X lie within the margins around the median μ.41 The relation between CfI,j and X is expressed as:
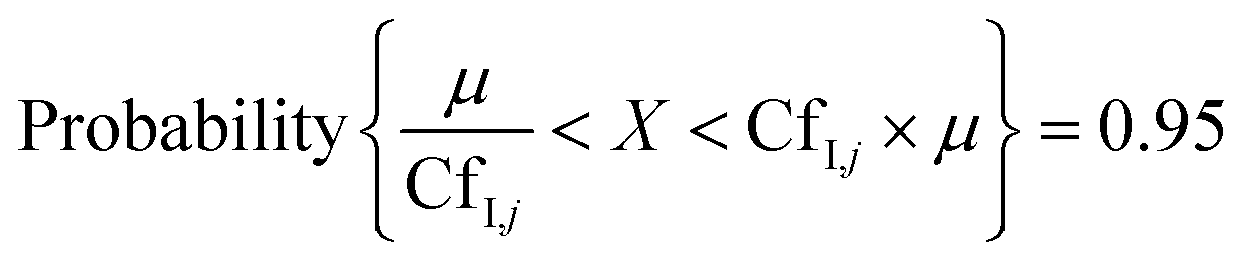 | (4) |
For instance, a CfI,j of 3 means that the variance of input parameter j is 1/3 and 3 times the median μ. The contribution of each input parameter to the variance in model output (expressed as percentage) was calculated as:
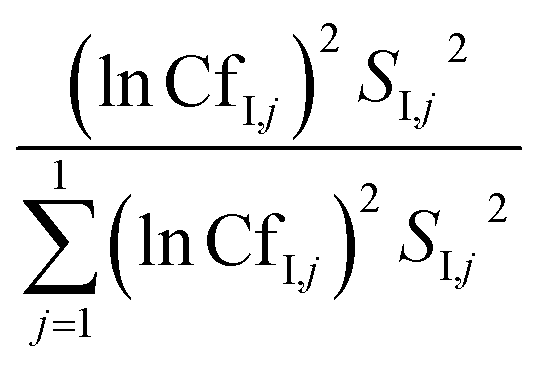 | (5) |
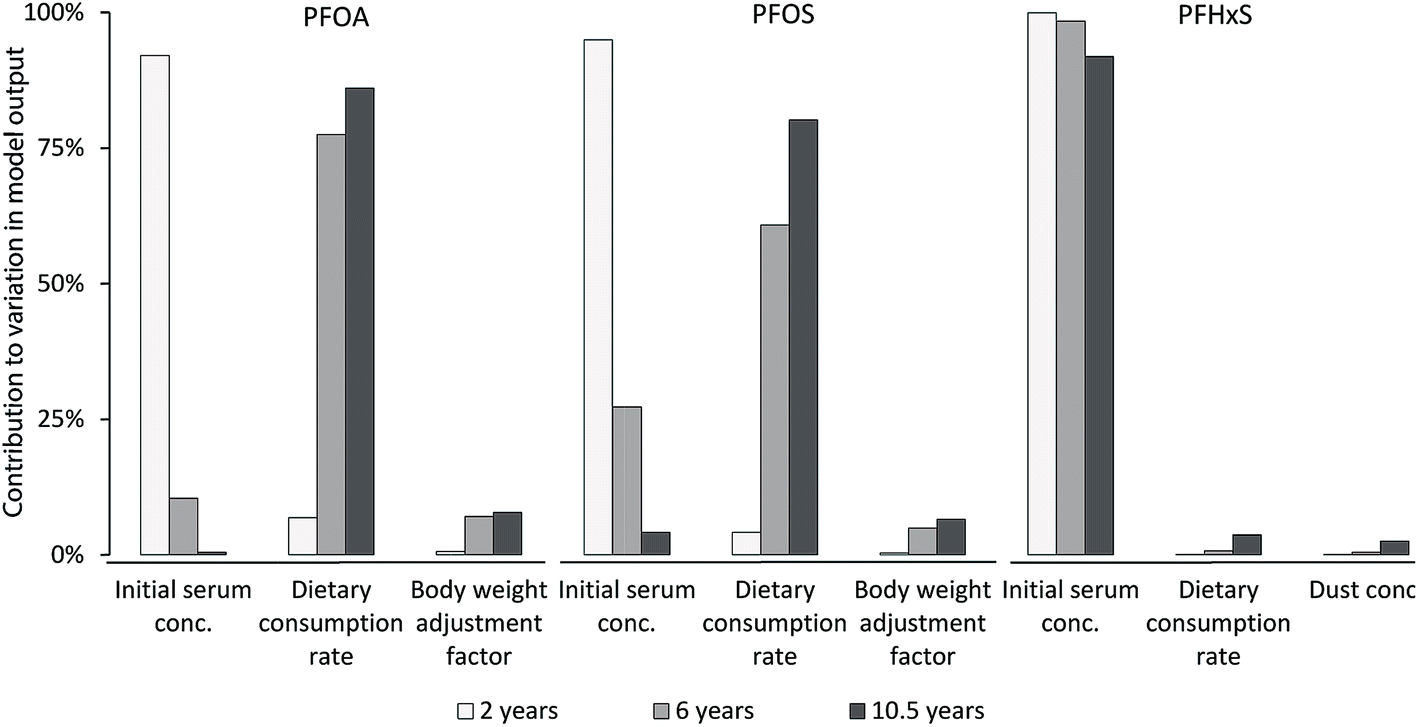
The results of eqn (5) are presented in Fig. 3 and are discussed, since they were considered to be most explanative compared to the calculated sensitivities that do not incorporate the parameters' putative variances (CfI,j). The model's sensitivities SI,n and the assigned confidence factors CfI,j were used to derive the variance of the model output represented as margin of error of CfO (Table S3‡). The margin of error is directly comparable to the measured variances in the serum samples and is based on the relation expressed in eqn (4), where CfI,j is substituted with CfO. CfO of the modelled PFAA serum concentrations was calculated as follows:
| CfO = exp[(lnCfI,1)2SI,12 +…+ (lnCfI,n)2SI,n2]1/2 | (6) |
3. Results
3.1. Calculated PFOA, PFOS and PFHxS intakes
The calculated EDIs of PFOA, PFOS and PFHxS for the Finnish 10.5 year-olds are shown in Table 3 for the low, intermediate and high exposure scenarios. The indirect exposure through the intake and biotransformation of precursors contributed between 0.4% and 3% to the total PFOA exposure and between 3% and 6% to the total PFOS exposure. The contribution of indirect PFHxS exposure could not be assessed due to the lack of precursor data. The total EDI of PFOA and PFOS in the high exposure scenario (both 0.55 ng per kg bw per d) was approximately three-fold greater than the EDI in the low or intermediate exposure scenario (PFOA: 0.16–0.19 ng per kg bw per d, PFOS: 0.16–0.20 ng per kg bw per d). The total EDI of PFHxS in the high exposure scenario was 61- and 73-times greater than in the intermediate and low exposure scenario, respectively. The top-down estimates of the PFOA and PFOS intake were 1.3-times higher and 0.8-times lower compared to the EDIs of the intermediate exposure scenario, respectively. In contrast, the top-down estimate of PFHxS was 3.4-times higher, compared to the EDI in the intermediate exposure scenario.Overall, the dietary intake was the major exposure pathway of the studied PFAAs in all exposure scenarios (Fig. 1). The air and dust exposure contributed up to 5% to the total EDI of PFOA and PFOS. For PFHxS, the dust exposure contributed 38% to the total EDI in the low and intermediate scenario.
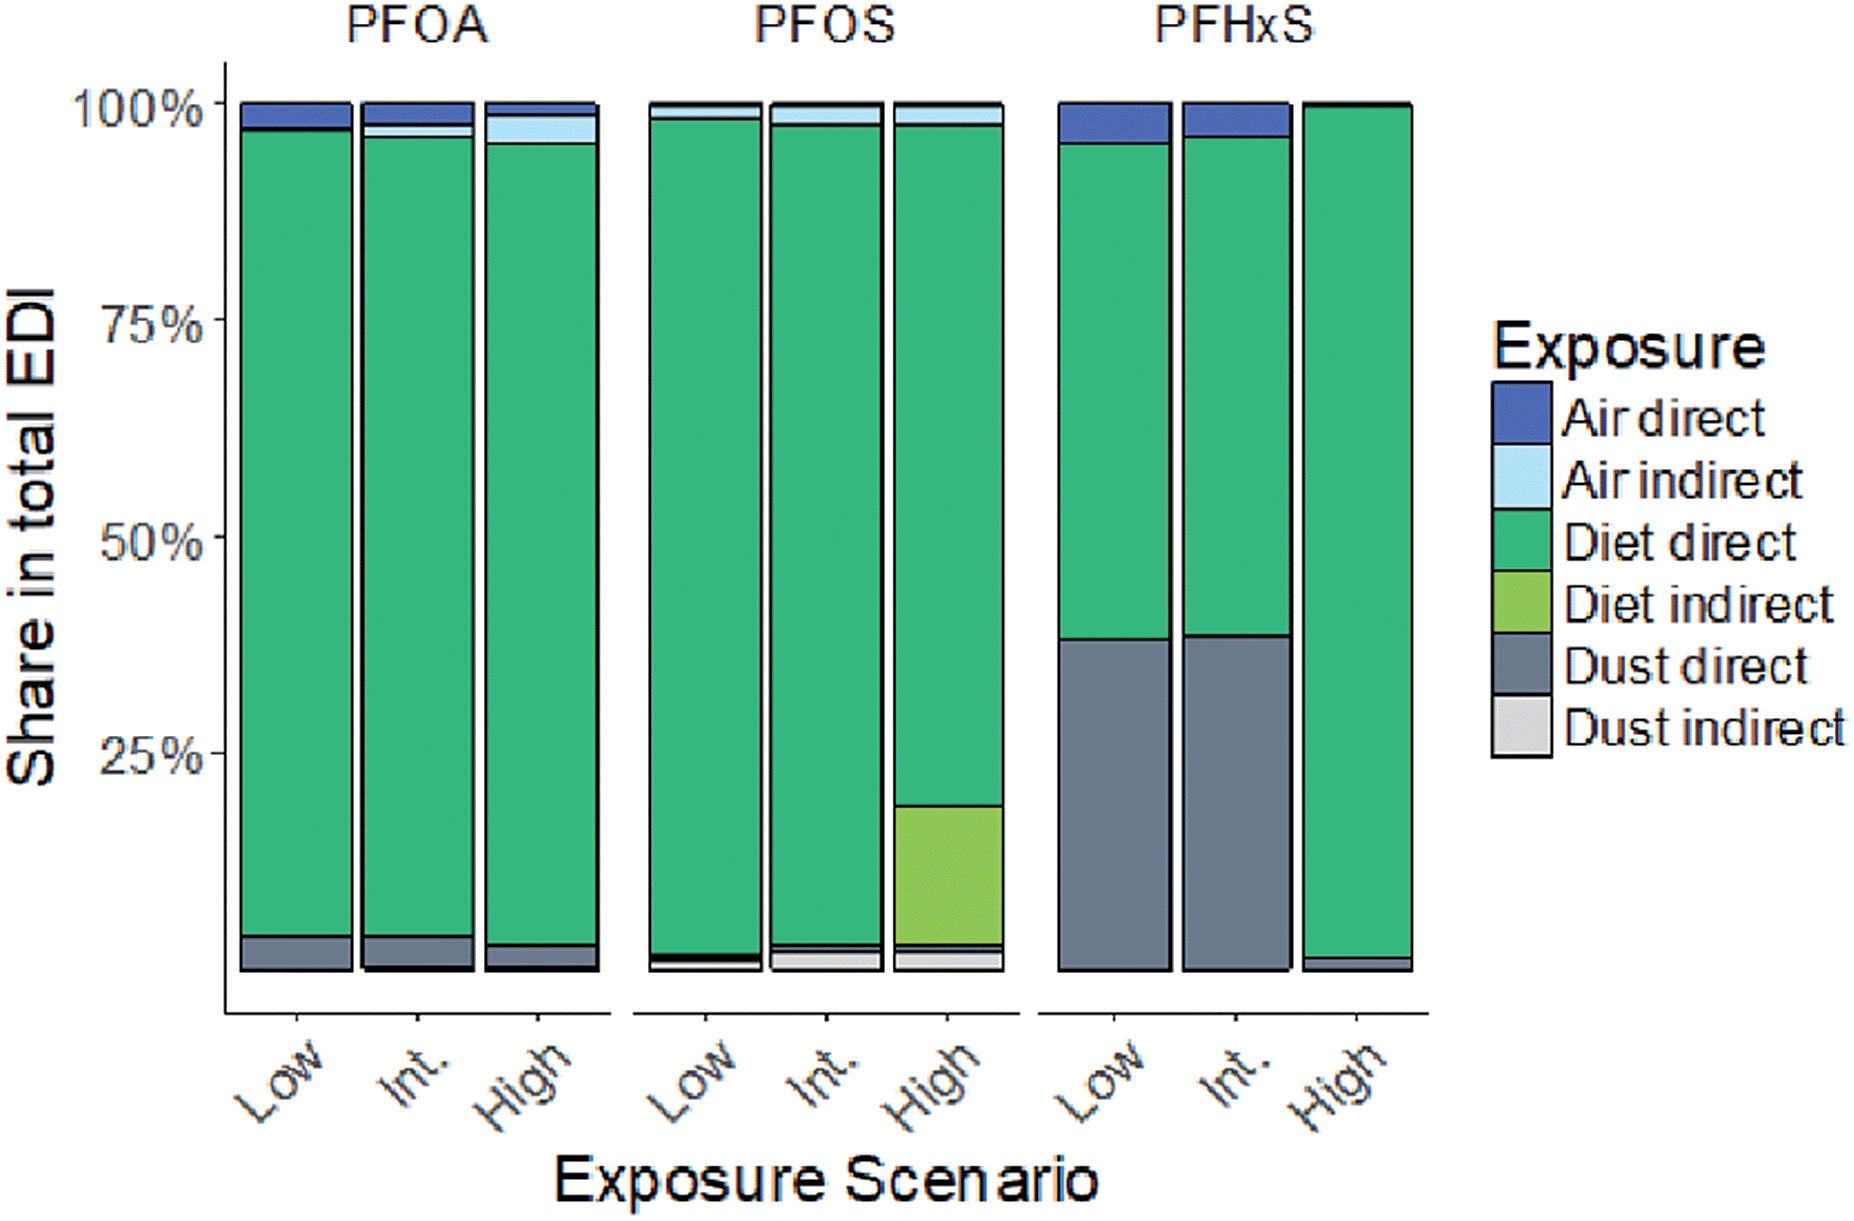 | ||
| Fig. 1 Contribution of direct and indirect diet, dust and air EDIs to total EDIs of 10.5 year-olds at different exposure scenarios. Int. = intermediate; direct = intake of the respective PFAA, Indirect = intake of the respective PFAA intake through precursor biotransformation and the direct intake, for PFHxS, no precursor data were available.21,22,25 | ||
3.2. Dynamic modelling
The model's results of the median serum concentrations of the Finnish child cohort are presented in Fig. 2. The curves of modelled PFOA and PFOS concentrations in the low and intermediate exposure scenario were within the range of measured concentrations (box plots, Fig. 2). At 6 and 10.5 years in the intermediate exposure scenario, the simulations were 0.8-fold lower each for PFOA and 1.3- and 1.4-fold higher for PFOS compared to measured serum concentrations. In contrast, the serum concentrations in the low and intermediate scenarios of PFHxS were 0.5- and 0.6-times lower compared to the measured serum concentrations at 6 and 10.5 years of age. Increasing the PFHxS intake by a factor of 5, the model showed a better agreement with the measured PFHxS serum levels. In contrast, changing the volume of distribution or the half-life barely affected the model output (Fig. S5‡).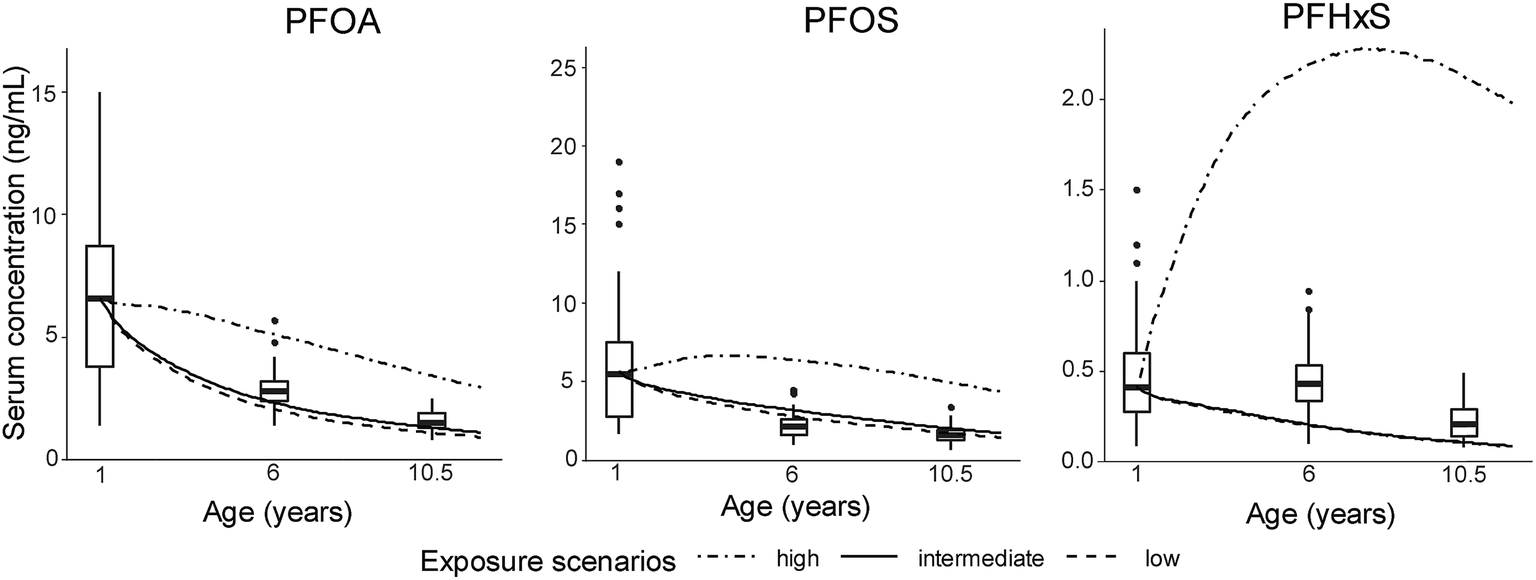 | ||
| Fig. 2 Modelled serum concentrations compared to serum measurements in Finnish children at 1 year, 6 and 10.5 years of age. Box plots represent serum measurements with the boxes marking the first, the second (median) and the third quantile and the whiskers marking maximal 1.5-times the interquartile range; one PFOS measurement of the children aged 1 year (40 ng mL−1) was excluded from the figure as it was an obvious outlier. | ||
 | ||
| Fig. 3 Contribution to modelled PFOA, PFOS and PFHxS serum concentration uncertainties of the three most important model input parameters at different child ages. Note that the most important input parameters for PFHxS differ to those from PFOA and PFOS. Contributions of input parameters were calculated as described in Section 2.6, eqn (5). | ||
The serum concentrations of all PFAAs in the high exposure scenario exceeded the measured serum concentrations, which was caused by the high dietary concentrations applied in that scenario (see Section 2.3, Table S1‡). The curve shape of the modelled serum concentrations of PFAAs was owed to both the constant elimination and growth dilution. At 1 and 10.5 years of age, growth dilution contributed from 63 to 77% and 24 to 55%, respectively, to the total loss of PFOA, PFOS and PFHxS. Elimination caused the remaining losses. It was not possible to reconstruct the observed sex-specific trends in PFOA and PFOS serum concentrations that were found among the children of the cohort.20 The median body burden (i.e. the total amount of a pollutant in an organism) of PFOA decreased with age in the females, whereas it increased with age in the males.20
It can be seen that the model is in better agreement with the measured serum concentrations when the median serum concentrations at 6 and 10.5 years of age were reconstructed in comparison to the modelled serum concentrations of each individual (Table 4 and Fig. S4‡). RMSDs were higher for 6 year-olds than for 10.5 year-olds, which also applied to R2. Between 21 and 57% of the variability in PFAA serum measurements in 6 year-olds could be explained by the model, while for the 10.5 year-olds, only between 8 and 24% of the variability could be explained. For PFOS, fitted linear regressions of the intermediate exposure scenario significantly deviated from the 1:1 line as a result of the spread in the data (blue and red lines, Fig. S4‡).
Unexpectedly the model explained 49% of the observed variability in the individual's PFHxS serum concentrations at 6 years of age (Table 4). This was likely owed to the larger variability in measured PFHxS serum concentrations at this age (Fig. 2).
3.3. Sensitivity and uncertainty analysis
For PFOA and PFOS, the contribution to the variance in model output (eqn (5)) at two years of age was mainly caused by the serum concentration, while the contribution to the variance in model output at later childhood (6 and 10.5 years of age) was mainly caused by the dietary consumption rate (Fig. 3). In the case of PFHxS, the serum concentration was by far the biggest contributor to the variance in the model output (≥92%) throughout childhood. The range in modelled serum concentrations, represented as the margin of error, was in good agreement with the observed variability in measured PFAA serum concentrations (Table S3‡).4. Discussion
4.1. Results summary
Except for the high exposure scenarios, the model accurately reconstructed the median PFOA and PFOS serum concentrations of the Finnish child cohort. For PFHxS, the modelled serum concentrations in the intermediate and low exposure scenario were consistently underestimated compared to the measured serum concentrations. The potential reasons for the model's underestimation of median PFHxS serum concentrations are discussed separately (see Section 4.5).In contrast to the simulation of median serum concentrations, the model showed less accurate results when PFOA and PFOS serum concentrations were reconstructed for each individual (Fig. S4‡), as indicated by the root-mean-square deviation of the model's predictions (RMSD) and R2. The RMSDs ranged between 35 and 75% compared to measured median PFAA serum concentrations (Table 4). R2 values were higher for 6 year-olds than for the 10.5 year-olds, which means that the model could explain less of the observed variability in PFOA, PFOS or PFHxS serum concentrations for older children (Table 4).
The model inputs with the highest contribution to the variance of the modelled serum concentrations were the initial PFOA, PFOS or PFHxS serum concentration and the respective dietary consumption rate, while the margin of error in modelled PFAA serum concentrations was comparable to the variance of the measured concentrations (Table S3‡).
4.2. EDI study comparison
Although dietary intakes of the child cohort were unknown, the present model approach successfully reconstructed the median PFOA and PFOS serum concentrations of the Finnish child cohort. A comparison of the derived EDIs of PFOA and PFOS to the EDIs derived in other studies (Fig. 4) revealed that the EDI ranges were relatively small. All EDIs of the studies' intermediate exposure scenarios ranged from 0.19 to 0.29 ng per kg bw per d for PFOA and from 0.19 to 0.63 ng per kg bw per d for PFOS (dots, Fig. 4). In fact, the EDIs of these different studies were within a much lower range compared to EDIs of studies from before 2011. For example, among these studies is one highly cited work that derived EDIs ranging from 1.8 to 72.2 ng per kg bw per d for PFOA and 7.4 to 148 ng per kg bw per d for PFOS in the low and high exposure scenario, respectively.10 These elevated intake estimations were potentially caused by problems during the analytical procedure.26 In order to avoid an overestimation of intakes and to enable a meaningful comparison, the studies displayed in Fig. 4 were chosen due to their applied improved analytical methods for quantification of PFAAs in external exposure media.5,42–44 | ||
| Fig. 4 Estimated daily intakes (EDIs) of PFOA and PFOS from different studies.5,42–44 Red = present study, dots = EDI of the intermediate scenario. Bars = EDIs of the low to high exposure scenario. Note that small ranges can be covered by dots. For detailed description of scenarios and ranges, see ESI Table S4.‡ | ||
The most sensitive age class in this study is the one-year-olds, due to the various developmental processes that are taking place around this age. The one-year-olds had intakes of 0.70 ng per kg bw per d of PFOA and 0.74 ng per kg bw per d of PFOS in the intermediate exposure scenario (Table S6‡), which is lower than the approximated TDIs derived from the TWIs that were recently set by the EFSA (PFOS: 1.86 ng per kg bw per d; PFOA: 0.86 ng per kg bw per d (ref. 14)). Still, the proximity of the PFOA EDI of one-year-olds (0.70 ng per kg bw per d, intermediate exposure Table S6‡) to the corresponding TDI raises concern about an increased risk for health impacts, since children receive higher body weight dependent doses if they experience the same exposure as adults. Moreover, some individuals in a population will naturally experience a higher exposure to PFAAs than the intermediate case and therefore will be at a higher risk for health impacts caused by the exposure to PFOA. This is the case due to the probability distribution and the case for e.g. occupationally exposed workers in the PFAS industry and potentially their families.
4.3. Dynamic exposure modelling
In contrast to the accurate reconstruction of median PFOA and PFOS serum concentrations, the individual's PFOA and PFOS serum concentrations at 6 and 10.5 years of age could not be predicted satisfactory. The individual variabilities in PFAA serum concentrations could not be accounted for, since dietary intakes and other exposure pathways in this child cohort were not monitored. Such longitudinal studies are often time- and resource-demanding. Furthermore, compared to infancy, where the major exposure to PFAAs is usually limited to prenatal exposure and breastfeeding,9,16 older children experience an increasingly complex and variable exposure to PFAAs.The results of the uncertainty analysis support this by (a) that the influence of PFAA serum concentrations at two years of age was the single most important contributor to the uncertainty in model output (PFOA: 92%, PFOS: 95%, PFHxS: 100%, Fig. 3) and (b) that the dietary consumption rate in later childhood (6 and 10.5 years of age) replaced the PFOA and PFOS serum concentration as the most important contributor to variance in the model output. Furthermore, the strong influence of PFAA serum concentrations in early childhood (2 years of age) indicates that the prenatal exposure and the breastfeeding are at least partially responsible for the PFAA body burden in later life stages.
4.4. Model limitations
Despite the accurate simulation of median PFOA and PFOS serum concentrations relative to measured serum concentrations, the presented model approach comprises several limitations. In this study, the PFAA intake was assumed to be constant over time, despite documented declining trends of PFAA concentrations in selected food items44,45 (see Section 2.4). Several authors concluded that the historical exposure to PFOA, PFOS and respective precursors via exposure media was likely higher.2,7,46 Still, the assumption of a constant intake in the present study is plausible considering that 1 and 6 year-olds eat a 2- to 3-times lower absolute amount of food compared to 10 year-olds. This would correct for 2- to 3-times higher PFAA concentrations in foodstuffs at the time the children were younger (1 and 6 years old). Furthermore, the successful reconstruction of median PFOA and PFOS serum concentrations support one of this study's main assumptions i.e. that the respective absolute PFAA intakes (in ng d−1) of the Finnish children were fairly constant between 1 and 10.5 years of age.Although diet was found to be the main exposure medium to PFAAs, the true historic contribution of each exposure pathway remains unclear, since the individuals' dietary habits were unknown and since the measured PFAA concentrations in the dust, air and water samples only represent a snapshot of the exposure when the children were 10.5 years old. A confounding factor, which complicates the exposure assessment of each individual, is the breastfeeding duration, which differed considerably in the child cohort. In some cases, infants were not breastfed or only partially breastfed for a short period (2 months). According to questionnaires, 50% of the children were breastfed up to 3 or 6 months after birth. Eight out of the 44 children were partially or fully breastfed up to 1 year of age and in two cases partial breastfeeding continued up 14 and 24 months. Thus, for some children breastfeeding continued to be an important exposure pathway to PFAAs past 1 year of age. However, the narrow EDI ranges of PFOA and PFOS across several studies (Fig. 4) and the common finding that diet is the most important exposure medium to PFAAs, support that dietary intake may also be the major exposure route of PFOA and PFOS of the Finnish children, which was the result of their intake calculations.
The indirect exposure via precursors contributed only with 3% to both the total PFOA and PFOS exposure in the high exposure scenario (Fig. 1). Another modelling study by Gebbink et al. (2015) with comparable scenarios for adults found indirect exposure to be of greater relevance (11 to 33% for PFOS and 13 to 64% for PFOA, low and high exposure scenario, respectively).5 The different findings in the two studies reflect the difference in the data (i.e. concentrations in the exposure media) that were applied for the EDI derivation (Table S4‡), as the applied pharmacokinetic parameters were mostly similar.
An accurate assessment of the indirect exposure to PFCAs and PFSAs is currently unfeasible due to largely unknown values for the absorption efficiencies and PK parameters of most PFCA and PFSA precursors.8,46 Estimations for biotransformation factors of PFAA precursors and absorption efficiencies are usually determined in rodent experiments,47–49 which can hamper extrapolation to human metabolism.7,48,50 Trudel et al. (2008) proposed absorption efficiencies for PFOA and PFOS in humans being 0.66, 0.8 and 0.91, which were estimated from a study in rodents.10,48 These values have been continuously used in later modelling studies on direct as well as indirect exposure to PFOS and PFOA precursors.5,24 The biotransformation factors for PFOS precursors were suggested to lie between 9 and >32%.7 However, the authors themselves suspected these values to be underestimated.
Current estimations for the half-life and volume of distribution used in several model approaches seem to be accurate, as indicated by successful model results in other studies.18,34 In the presented model, the values of the serum elimination half-life and of the volume of distribution of PFOA, PFOS and PFHxS were taken from a study that successfully estimated serum concentration trends of PFOA and PFOS in adults.35 Verner et al. (2016) used slightly different values for the half-life and volume of distribution of PFOA and PFOS compared to the present work. Despite the application of different values, the resulting modelled serum concentrations in both studies showed a good agreement with the respective measured data.
The sex-specific trends in body burdens in the child cohort20 could not be explained by the model, as the sex-dependent differences in exposure to PFAAs in humans are currently not known. The only considered individual specific exposure parameters in the model were the individual PFAS exposure concentrations to dust and air and the children's body weight at 10.5 years of age. Harada et al. (2005) found that menstruation is an elimination pathway of PFOA and PFOS specifically for adolescent women, however, not for prepubescent age classes.53 Another possible explanation could be the differing behaviour of boys and girls.12 Previous investigations refer to differences in sex-hormone regulation that could be responsible for sex-specific PFAA serum trends.18,35 A sex-dependent renal elimination of PFOA and other PFCAs was observed in rats, which was concluded to be regulated by hormones that influence the expression of renal organic anion transporters (OATs).51,52 Another study explored the role of OATs in the renal reabsorption of PFOA using a rat pharmacokinetic model.54 The model results strongly suggest that observed sex-specific serum half-lives of PFOA in rats are determined by the expression of OATs in the kidney cells. If such renal transporter specific flux rates of PFOA would become available for human kidney cells, Worley and Fisher's model approach could be used to explain and model the observed sex-specific serum trends of PFOA in the Finnish child cohort.54 However, there are still large knowledge gaps in sex-specific characteristics of human PFAA metabolism and the toxicokinetics of PFAAs in young children are generally unknown.
The model's limitations emphasise the importance to further investigate the role of indirect exposure via precursors, which warrants a meaningful input for future PFOA and PFOS exposure assessments. Specifically, more accurate estimations on absorption efficiencies and biotransformation factors as well as a rigorous inclusion of PFOA and PFOS precursor measurements in food items are needed.
4.5. PFHxS exposure modelling
Although the results of simulated PFHxS serum concentrations for each child were comparable or even better than of PFOA and PFOS for each child, the median PFHxS serum concentration was underestimated in the low and intermediate exposure scenario.The PFHxS EDIs from this study were 10- to 17-times smaller compared to available EDIs from two other studies. In this current work, the PFHxS intermediate exposure scenario EDI was 0.003 ng per kg bw per d for 10.5 year-olds, while the dietary PFHxS intakes in previous studies were estimated to be 0.05 ng per kg bw per d (median of European adults55) and 0.031 ng per kg bw per d (general Swedish population44). Also, the top-down estimate of the PFHxS intake of 0.011 ng per kg bw per d was higher compared to the EDI of the intermediate exposure scenario of 0.003 ng per kg bw per d (Table 3).
Multiple studies indicate an underestimated PFHxS intake, which are summarized in the following paragraph. An underestimation of PFHxS exposure to humans was also found in a study that reconstructed half-lives of PFOA, PFOS and PFHxS from American and Australian cohorts in a population based PK model.35 Verner et al. (2016) underestimated PFHxS exposure to children after the breastfeeding period and they proposed additional, currently unknown exposure sources as the cause of underestimation.17 Other authors found indications of an ongoing PFHxS exposure caused by an unknown pathway via PFHxS containing products or contaminated house dust.35,56
Due to the large contribution of dust intake to the total EDIs in the low and intermediate scenario (Fig. 1), the uncertainty of ingested dust amount adds to the variability in PFHxS exposure. A Norwegian study considered the ingested dust amount as the main uncertainty in their model input based on the hypothesis that dust intake plays a major role in children's exposure to PFAAs.42 Current estimates for dust ingestion are imprecise as reflected by the recommendations in the Exposure Factors Handbook of the US-Environmental Protection Agency.32 There, the amount of dust ingested by 1 to 21 year-olds was estimated to be 60 to 100 mg of dust per day, which is potentially inadequate to accurately represent the dust intake of the specific age classes.32 The studies used to derive the US EPA's recommended dust intakes, are based on estimations from trace elements (such as lead) in fecal, urine, blood and dust samples, which might cause positive or negative discrepancies in the dust intake estimations.32 Another uncertainty was the fact that exposure to dust is location-dependent, which introduces a bias if dust sampling took place in one location only (e.g. children's homes) and other places of potential exposure, such as the child's visited nursery or school, were excluded.32
The inclusion of PFHxS precursors would clearly benefit the exposure assessment to PFHxS. PFHxS precursor measurements are lacking in the used datasets (Table 1) and neither biotransformation factors nor absorption efficiencies of these compounds have been estimated so far. The input parameters used to calculate the PFHxS exposure may be responsible for the underestimated PFHxS serum concentrations, as they are expected to be inaccurate (use of apparent half-life) or unknown (volume of distribution).
Another possibility can be that the measured PFHxS concentrations in serum samples could have been elevated due to interferences in the chemical analysis, thus masking the true PFHxS concentrations in the samples. Endogenous steroid sulfates in human blood samples are known to interfere with PFHxS signals if a non-isomer separation method was applied.57 However, this problem was addressed by analysing the children's serum samples at a slightly different transition mass.58
In summary, to assess the exposure to PFHxS accurately, future research efforts should focus on potentially missing exposure pathways to PFHxS and its precursors and the derivation of pharmacokinetic parameters specifically for this compound, as they are currently not documented.
5. Conclusions
To our knowledge the present work is the only one to thoroughly assess children's exposure to PFOA, PFOS and PFHxS after infancy up to an age, at which the children's exposure to PFAAs is considerably more complex. The results show that children's exposure to PFOA and PFOS becomes more similar to that of adult's with increasing age. This is indicated by the dominance of the dietary exposure pathway in the intake calculations for the 10.5 year-olds and the uncertainty analysis of the dynamic model. However, to elucidate which exposure sources (i.e. diet, dust or air) are crucial after infancy and before entering adolescence, future or ongoing biomonitoring studies should monitor the corresponding exposure media at appropriate time intervals. The findings demonstrate that the exposure of human populations to a phased out chemical such as PFOA or PFOS can continue for a prolonged period after the phase out to an extent that the potential intake still raises concern for health impacts. This work indicates that the exposure to PFHxS is not completely understood and further investigation is needed for (1) potentially missing exposure pathways, (2) the role of indirect exposure via PFHxS precursors and (3) to refine PFHxS pharmacokinetic parameters.Conflicts of interest
There are no conflicts to declare.Acknowledgements
The authors thank Robin Vestergren and the authors of the LUKAS2 study and the CEEP study for data sharing, in particular Jani Koponen (THL, National Institute for Health and Welfare, Finland). Further, we thank Jonathan Benskin, Paul Glantz and the anonymous reviewers for valuable comments and the Department of Environmental Science and Analytical Chemistry at Stockholm University for financial support.References
- H. Fromme, S. A. Tittlemier, W. Völkel, M. Wilhelm and D. Twardella, Perfluorinated compounds – Exposure assessment for the general population in western countries, Int. J. Hyg. Environ. Health, 2009, 212(3), 239–270 CrossRef CAS PubMed.
- R. Vestergren and I. T. Cousins, Tracking the Pathways of Human Exposure to Perfluorocarboxylates, Environ. Sci. Technol., 2009, 43(15), 5565–5575 CrossRef CAS PubMed.
- A. O. De Silva, C. N. Allard, C. Spencer, G. M. Webster and M. Shoeib, Phosphorus-Containing Fluorinated Organics: Polyfluoroalkyl Phosphoric Acid Diesters (diPAPs), Perfluorophosphonates (PFPAs), and Perfluorophosphinates (PFPIAs) in Residential Indoor Dust, Environ. Sci. Technol., 2012, 46(22), 12575–12582 CrossRef CAS PubMed.
- M. Shoeib, T. Harner, G. M. Webster and S. C. Lee, Indoor Sources of Poly- and Perfluorinated Compounds (PFCS) in Vancouver, Canada: Implications for Human Exposure, Environ. Sci. Technol., 2011, 45(19), 7999–8005 CrossRef CAS PubMed.
- W. A. Gebbink, U. Berger and I. T. Cousins, Estimating human exposure to PFOS isomers and PFCA homologues: The relative importance of direct and indirect (precursor) exposure, Environ. Int., 2015, 74, 160–169 CrossRef CAS PubMed.
- M. Filipovic and U. Berger, Are perfluoroalkyl acids in waste water treatment plant effluents the result of primary emissions from the technosphere or of environmental recirculation?, Chemosphere, 2015, 129, 74–80 CrossRef CAS PubMed.
- J. W. Martin, B. J. Asher, S. Beesoon, J. P. Benskin and M. S. Ross, PFOS or PreFOS? Are perfluorooctane sulfonate precursors (PreFOS) important determinants of human and environmental perfluorooctane sulfonate (PFOS) exposure?, J. Environ. Monit., 2010, 12(11), 1979–2004 RSC.
- A. A. Rand and S. A. Mabury, Is there a human health risk associated with indirect exposure to perfluoroalkyl carboxylates (PFCAs)?, Toxicology, 2017, 375, 28–36 CrossRef CAS PubMed.
- E. Papadopoulou, A. Sabaredzovic, E. Namork, U. C. Nygaard, B. Granum and L. S. Haug, Exposure of Norwegian toddlers to perfluoroalkyl substances (PFAS): The association with breastfeeding and maternal PFAS concentrations, Environ. Int., 2016, 94, 687–694 CrossRef CAS PubMed.
- D. Trudel, L. Horowitz, M. Wormuth, M. Scheringer, I. T. Cousins and K. Hungerbühler, Estimating Consumer Exposure to PFOS and PFOA, Risk Anal., 2008, 28(2), 251–269 CrossRef PubMed.
- E. Dellatte, G. Brambilla, S. P. De Filippis, A. di Domenico, J. Pulkrabova, C. Eschauzier, S. Klenow, G. Heinemeyer and P. de Voogt, Occurrence of selected perfluorinated alkyl acids in lunch meals served at school canteens in Italy and their relevance for children's intake, Food Addit. Contam., Part A, 2013, 30(9), 1590–1597 CrossRef CAS PubMed.
- K. Winkens. Estimating children's exposure to per- and polyfluoroalkyl substances. Stockholm University. 2018 Search PubMed.
- K. Winkens, R. Vestergren, U. Berger and I. T. Cousins, Early life exposure to per- and polyfluoroalkyl substances (PFASs): A critical review, Emerging Contam., 2017, 3(2), 55–68 CrossRef.
- EFSA, Risk to human health related to the presence of perfluorooctane sulfonic acid and perfluorooctanoic acid in food, EFSA J., 2018, 16(12), e05194 Search PubMed.
- P. Grandjean, C. Heilmann, P. Weihe, F. Nielsen, U. B. Mogensen, A. Timmermann and E. Budtz-Jørgensenet, Estimated exposures to perfluorinated compounds in infancy predict attenuated vaccine antibody concentrations at age 5-years, J. Immunotoxicol., 2017, 14(1), 188–195 CrossRef CAS PubMed.
- A. E. Loccisano, M. P. Longnecker, J. L. Campbell, M. E. Andersen and H. J. Clewell, Development of Pbpk Models for Pfoa and Pfos for Human Pregnancy and Lactation Life Stages, J. Toxicol. Environ. Health, Part A, 2013, 76(1), 25–57 CrossRef CAS PubMed.
- M. A. Verner, G. Ngueta, E. T. Jensen, H. Fromme, W. Volkel, U. C. Nygaard, B. Granum and M. P. Longnecker, A Simple Pharmacokinetic Model of Prenatal and Postnatal Exposure to Perfluoroalkyl Substances (PFASs), Environ. Sci. Technol., 2016, 50(2), 978–986 CrossRef CAS PubMed.
- F. Wong, M. MacLeod, J. F. Mueller and I. T. Cousins, Enhanced Elimination of Perfluorooctane Sulfonic Acid by Menstruating Women: Evidence from Population-Based Pharmacokinetic Modeling, Environ. Sci. Technol., 2014, 48(15), 8807–8814 CrossRef CAS PubMed.
- A. M. Karvonen, A. Hyvärinen, M. Roponen, M. Hoffmann, M. Korppi, S. Remes, E. von Mutius, A. Nevalainen and J. Pekkanen, Confirmed Moisture Damage at Home, Respiratory Symptoms and Atopy in Early Life: A Birth-Cohort Study, Pediatrics, 2009, 124(2), e329–e338 CrossRef PubMed.
- J. Koponen, K. Winkens, R. Airaksinen, U. Berger, R. Vestergren, I. T. Cousins, A. M. Karvonen, J. Pekkanen and H. Kiviranta, Longitudinal trends of per- and polyfluoroalkyl substances in children's serum, Environ. Int., 2018, 121, 591–599 CrossRef CAS PubMed.
- K. Winkens, J. Koponen, J. Schuster, M. Shoeib, R. Vestergren, U. Berger, A. M. Karvonen, J. Pekkanen, H. Kiviranta and I. T. Cousins, Perfluoroalkyl acids and their precursors in indoor air sampled in children's bedrooms, Environ. Pollut., 2017, 222, 423–432 CrossRef CAS PubMed.
- K. Winkens, G. Giovanoulis, J. Koponen, R. Vestergren, U. Berger, A. M. Karvonen, J. Pekkanen, H. Kiviranta and I. T. Cousins, Perfluoroalkyl acids and their precursors in floor dust of children's bedrooms – Implications for indoor exposure, Environ. Int., 2018, 119, 493–502 CrossRef CAS.
- M. Lorber and P. P. Egeghy, Simple Intake and Pharmacokinetic Modeling to Characterize Exposure of Americans to Perfluoroctanoic Acid, PFOA, Environ. Sci. Technol., 2011, 45(19), 8006–8014 CrossRef CAS.
- R. Vestergren, I. T. Cousins, D. Trudel, M. Wormuth and M. Scheringer, Estimating the contribution of precursor compounds in consumer exposure to PFOS and PFOA, Chemosphere, 2008, 73(10), 1617–1624 CrossRef CAS PubMed.
- E. Papadopoulou, S. Poothong, J. Koekkoek, L. Lucattini, J. A. Padilla-Sánchez, M. Haugen, D. Herzke, S. Valdersnes, A. Maage, I. T. Cousins, P. E. G. Leonards and H. L. Småstuen, Estimating human exposure to perfluoroalkyl acids via solid food and drinks: Implementation and comparison of different dietary assessment methods, Environ. Res., 2017, 158, 269–276 CrossRef CAS PubMed.
- R. Vestergren and I. T. Cousins, 12 - Human dietary exposure to per- and poly-fluoroalkyl substances (PFASs), in Persistent Organic Pollutants and Toxic Metals in Foods, ed. M. Rose and A. Fernandes, Woodhead Publishing, Cambridge, 2013, p. 279–307 Search PubMed.
- 3M Company, Voluntary use and exposure information profile for perfluorooctanoic acid and salts, USEPA administrative record AR226-0595, available from http://www.regulations.gov as document EPA-HQ-OPPT-2002-0051-0009 2000, available fromhttps://www.regulations.gov/document?D=EPA-HQ-OPPT-2002-0051-0009, accessed 06.05.2019.
- US-EPA, 2010/2015 PFOA Stewardship Program 2006, available from https://www.regulations.gov/docket?D=EPA-HQ-OPPT-2006-0621, accessed 06.05.2019.
- W. A. Gebbink, S. Ullah, O. Sandblom and U. Berger, Polyfluoroalkyl phosphate esters and perfluoroalkyl carboxylic acids in target food samples and packaging—method development and screening, Environ. Sci. Pollut. Res., 2013, 20(11), 7949–7958 CrossRef CAS PubMed.
- X. Trier, K. Granby and J. H. Christensen, Polyfluorinated surfactants (PFS) in paper and board coatings for food packaging, Environ. Sci. Pollut. Res., 2011, 18(7), 1108–1120 CrossRef CAS.
- EFSA, EFSA Comprehensive European Food Consumption Database, EFSA, 2011, available from https://www.efsa.europa.eu/en/microstrategy/food-consumption-survey, accessed 10.10.2018.
- US-EPA, Exposure Factors Handbook: 2011 Edition: US-EPA; 2011, updated September 2011, available from http://cfpub.epa.gov/ncea/risk/recordisplay.cfm?deid=236252, accessed 10.10.2018 Search PubMed.
- J. A. Padilla-Sánchez, E. Papadopoulou, S. Poothong and L. S. Haug, Investigation of the Best Approach for Assessing Human Exposure to Poly- and Perfluoroalkyl Substances through Indoor Air, Environ. Sci. Technol., 2017, 51(21), 12836–12843 CrossRef.
- M. I. Gomis, R. Vestergren, H. Nilsson and I. T. Cousins, Contribution of Direct and Indirect Exposure to Human Serum Concentrations of Perfluorooctanoic Acid in an Occupationally Exposed Group of Ski Waxers, Environ. Sci. Technol., 2016, 50(13), 7037–7046 CrossRef CAS PubMed.
- M. I. Gomis, R. Vestergren, M. MacLeod, J. F. Mueller and I. T. Cousins, Historical human exposure to perfluoroalkyl acids in the United States and Australia reconstructed from biomonitoring data using population-based pharmacokinetic modelling, Environ. Int., 2017, 108, 92–102 CrossRef CAS PubMed.
- C. P. Chengelis, J. B. Kirkpatrick, N. R. Myers, M. Shinohara, P. L. Stetson and D. W. Sved, Comparison of the toxicokinetic behavior of perfluorohexanoic acid (PFHxA) and nonafluorobutane-1-sulfonic acid (PFBS) in cynomolgus monkeys and rats, Reprod. Toxicol., 2009, 27(3), 400–406 CrossRef CAS.
- M. H. Russell, R. L. Waterland and F. Wong, Calculation of chemical elimination half-life from blood with an ongoing exposure source: The example of perfluorooctanoic acid (PFOA), Chemosphere, 2015, 129, 210–216 CrossRef CAS.
- G. W. Olsen, J. M. Burris, D. J. Ehresman, J. W. Froehlich, A. M. Seacat, J. L. Butenhoff and L. R. Zobel, Half-Life of Serum Elimination of Perfluorooctanesulfonate, Perfluorohexanesulfonate, and Perfluorooctanoate in Retired Fluorochemical Production Workers, Environ. Health Perspect., 2007, 115(9), 1298–1305 CrossRef CAS.
- R. J. Kuczmarski, C. L. Ogden, L. M. Grummer-Strawn, K. M. Flegal, S. S. Guo, R. Wei, Z. Mei, L. R. Curtin, A. F. Roche and C. L. Johnson, CDC growth charts: United States, Adv. Data, 2000,(314), 1–27 CAS.
- M. Land, C. A. de Wit, I. T. Cousins, D. Herzke, J. Johansson and J. W. Martin, What is the effect of phasing out long-chain per- and polyfluoroalkyl substances on the concentrations of perfluoroalkyl acids and their precursors in the environment? A systematic review protocol, Environ. Evid., 2015, 4(1), 3 CrossRef.
- M. MacLeod, A. J. Fraser and D. Mackay, Evaluating and expressing the propagation of uncertainty in chemical fate and bioaccumulation models, Environ. Toxicol. Chem., 2002, 21(4), 700–709 CrossRef CAS PubMed.
- L. S. Haug, S. Huber, G. Becher and C. Thomsen, Characterisation of human exposure pathways to perfluorinated compounds — Comparing exposure estimates with biomarkers of exposure, Environ. Int., 2011, 37(4), 687–693 CrossRef CAS PubMed.
- C. W. Noorlander, S. P. J. van Leeuwen, J. D. T. Biesebeek, M. J. B. Mengelers and M. J. Zeilmaker, Levels of Perfluorinated Compounds in Food and Dietary Intake of PFOS and PFOA in The Netherlands, J. Agric. Food Chem., 2011, 59(13), 7496–7505 CrossRef CAS PubMed.
- R. Vestergren, U. Berger, A. Glynn and I. T. Cousins, Dietary exposure to perfluoroalkyl acids for the Swedish population in 1999, 2005 and 2010, Environ. Int., 2012, 49, 120–127 CrossRef CAS.
- J. H. Johansson, U. Berger, R. Vestergren, I. T. Cousins, A. Bignert, A. Glynn and P. O. Darnerud, Temporal trends (1999–2010) of perfluoroalkyl acids in commonly consumed food items, Environ. Pollut., 2014, 188, 102–108 CrossRef CAS.
- A. Miralles-Marco and S. Harrad, Perfluorooctane sulfonate: A review of human exposure, biomonitoring and the environmental forensics utility of its chirality and isomer distribution, Environ. Int., 2015, 77, 148–159 CrossRef CAS.
- A. M. Seacat, P. J. Thomford, K. J. Hansen, L. A. Clemen, S. R. Eldridge, C. R. Elcombe and J. L. Butenhoff, Sub-chronic dietary toxicity of potassium perfluorooctanesulfonate in rats, Toxicology, 2003, 183(1), 117–131 CrossRef CAS PubMed.
- S. G. Hundley, A. M. Sarrif and G. L. Kennedy, Absorption, Distribution, and Excretion of Ammonium Perfluorooctanoate (APFO) After Oral Administration to Various Species, Drug Chem. Toxicol., 2006, 29(2), 137–145 CrossRef CAS.
- W. Xie, Q. Wu, I. Kania-Korwel, J. C. Tharappel, S. Telu, M. C. Coleman, H. P. Glauert, K. Kannan, S. V. Mariappan, D. R. Spitz, J. Weydert and H. J. Lehmler, Subacute exposure to N-ethyl perfluorooctanesulfonamidoethanol results in the formation of perfluorooctanesulfonate and alters superoxide dismutase activity in female rats, Arch. Toxicol., 2009, 83(10), 909–924 CrossRef CAS PubMed.
- S. C. Chang, P. E. Noker, G. S. Gorman, S. J. Gibson, J. A. Hart, D. J. Ehresman and J. L. Butenhoff, Comparative pharmacokinetics of perfluorooctanesulfonate (PFOS) in rats, mice, and monkeys, Reprod. Toxicol., 2012, 33(4), 428–440 CrossRef CAS PubMed.
- N. Kudo, M. Katakura, Y. Sato and Y. Kawashima, Sex hormone-regulated renal transport of perfluorooctanoic acid, Chem.-Biol. Interact., 2002, 139(3), 301–316 CrossRef CAS.
- Y. M. Weaver, D. J. Ehresman, J. L. Butenhoff and B. Hagenbuch, Roles of Rat Renal Organic Anion Transporters in Transporting Perfluorinated Carboxylates with Different Chain Lengths, Toxicol. Sci., 2009, 113(2), 305–314 CrossRef.
- K. Harada, K. Inoue, A. Morikawa, T. Yoshinaga, N. Saito and A. Koizumi, Renal clearance of perfluorooctane sulfonate and perfluorooctanoate in humans and their species-specific excretion, Environ. Res., 2005, 99(2), 253–261 CrossRef CAS PubMed.
- R. R. Worley and J. Fisher, Application of physiologically-based pharmacokinetic modeling to explore the role of kidney transporters in renal reabsorption of perfluorooctanoic acid in the rat, Toxicol. Appl. Pharmacol., 2015, 289(3), 428–441 CrossRef CAS PubMed.
- EFSA, Perfluoroalkylated substances in food: occurence and dietary exposure, EFSA J., 2012, 10(6), 2743 Search PubMed.
- K. Kato, A. M. Calafat and L. L. Needham, Polyfluoroalkyl chemicals in house dust, Environ. Res., 2009, 109(5), 518–523 CrossRef CAS.
- J. P. Benskin, M. Bataineh and J. W. Martin, Simultaneous Characterization of Perfluoroalkyl Carboxylate, Sulfonate, and Sulfonamide Isomers by Liquid Chromatography-Tandem Mass Spectrometry, Anal. Chem., 2007, 79(17), 6455–6464 CrossRef CAS PubMed.
- J. Koponen, P. Rantakokko, R. Airaksinen and H. Kiviranta, Determination of selected perfluorinated alkyl acids and persistent organic pollutants from a small volume human serum sample relevant for epidemiological studies, J. Chromatogr. A, 2013, 1309, 48–55 CrossRef CAS PubMed.
Footnotes |
| † This study was conducted at the Department of Environmental Science and Analytical Chemistry (ACES), Stockholm University. ESI is available for this article. The R-code of a simplified model version can be found in the ESI.† |
| ‡ Electronic supplementary information (ESI) available. See DOI: 10.1039/c9em00323a |
| This journal is © The Royal Society of Chemistry 2019 |