Impact of traffic volumes on levels, patterns, and toxicity of polycyclic aromatic hydrocarbons in roadside soils†
Seong-Joon
Kim
a,
Min-Kyu
Park
a,
Sung-Eun
Lee
b,
Hye-Jung
Go
a,
Byung-Chae
Cho
a,
Yoon-Se
Lee
c and
Sung-Deuk
Choi
 *ac
*ac
aSchool of Urban and Environmental Engineering, Ulsan National Institute of Science and Technology (UNIST), Ulsan, 44919, Republic of Korea. E-mail: sdchoi@unist.ac.kr; Fax: +82 52 217 2859; Tel: +82 52 217 2811
bSchool of Applied Biosciences, Kyungpook National University, Daegu, 41566, Republic of Korea
cUNIST Environmental Analysis Center (UEAC), Ulsan National Institute of Science and Technology (UNIST), Ulsan, 44919, Republic of Korea
First published on 3rd January 2019
Abstract
Vehicular exhaust is one of the important sources of polycyclic aromatic hydrocarbons (PAHs) in urban areas, and roadside soils can be directly contaminated with PAHs released from traffic emissions. In this study, roadside soils were collected at 10 sites in Ulsan, the largest industrial city in South Korea, to investigate the relationship between the traffic volume and the contamination characteristics of PAHs. The total concentrations of 16 US EPA priority PAHs (∑16 PAHs, mean: 1079 ng g−1) and organic-matter-normalized ∑16 PAHs (mean: 224 ng g−1 OM) were positively correlated with traffic volumes (Pearson correlation, r = 0.88 and 0.78, p < 0.01). The levels of carcinogenic PAHs were significantly higher at the high traffic sites than at the low traffic sites. High traffic sites (>25![[thin space (1/6-em)]](https://www.rsc.org/images/entities/char_2009.gif) 000 vehicles per day) located at intersections showed elevated concentrations of indicator compounds (e.g., phenanthrene, fluoranthene, pyrene, and benzo[ghi]perylene) for gasoline and diesel exhaust. The diagnostic ratios also suggested a strong influence of the traffic emissions on the roadside soils, not only at urban sites but also at rural ones. Consequently, roadside soils and road dust (which are expected to be much more contaminated with PAHs than roadside soil) can act as important non-point sources of air and water pollution. The cancer risk from exposure to PAHs in the roadside soils was in an acceptable range, but continuous monitoring is required to evaluate the influence of increasing traffic on the environment and human health.
000 vehicles per day) located at intersections showed elevated concentrations of indicator compounds (e.g., phenanthrene, fluoranthene, pyrene, and benzo[ghi]perylene) for gasoline and diesel exhaust. The diagnostic ratios also suggested a strong influence of the traffic emissions on the roadside soils, not only at urban sites but also at rural ones. Consequently, roadside soils and road dust (which are expected to be much more contaminated with PAHs than roadside soil) can act as important non-point sources of air and water pollution. The cancer risk from exposure to PAHs in the roadside soils was in an acceptable range, but continuous monitoring is required to evaluate the influence of increasing traffic on the environment and human health.
Environmental significanceVehicular exhaust is an important source of polycyclic aromatic hydrocarbons (PAHs) in the urban area. Especially, roadside soils can be directly contaminated by PAHs emitted from vehicles, and they can act as a non-point source. However, previous studies did not clearly examine the relationship between traffic volume and the contamination characteristics of PAHs. In this study, therefore, we investigated PAH contamination in roadside soils, where traffic volume data were available. The levels of PAHs and carcinogenicity were statistically correlated with traffic volumes. Cars had the highest contribution to PAH contamination. Traffic indicator compounds were also identified. The major results of this study can be used for the prediction of PAH levels and patterns using traffic volume data. |
1. Introduction
Polycyclic aromatic hydrocarbons (PAHs), a group of persistent organic pollutants (POPs), have two or more fused aromatic rings. Among the 16 US EPA priority PAHs, 7 compounds have been classified as probable human carcinogens.1 Toxicity equivalent factors (TEFs) for the 16 individual PAHs were also established based on the toxicity of benzo[a]pyrene.2 PAHs are ubiquitous pollutants, and are mainly emitted due to the incomplete combustion of organic materials. Even though there are natural sources of PAHs, such as forest fires,3,4 anthropogenic sources such as domestic and industrial burning of fossil fuels and vehicles emissions are dominant in urban areas.5,6 After being emitted into the atmosphere, PAHs are deposited in the aquatic and terrestrial ecosystems via dry and wet deposition.7In urban areas, vehicles are one of the most important local sources of PAHs.8 Road dust and roadside soils can be directly contaminated with PAHs by vehicular exhausts.9 Asphalt, tires, and petroleum products are additional important sources of PAHs in urban road dust.10 Even in remote mountain areas, levels of PAHs in the air and soil are controlled by the proximity to roads.11 Road dust and roadside soils contaminated with PAHs are expected to affect the health of drivers and/or residents via direct ingestion, dermal contact, and inhalation.12 In addition, PAHs in road dust and roadside soils are transported to the aquatic environment by surface runoff.13,14 For these reasons, monitoring studies on road dust and associated PAHs have been conducted worldwide.15
The number of vehicles is increasing, for example, according to Statistics Korea, the number of registered automobiles in South Korea increased from 1.64 million to 2.18 million during the last 10 years (2007–2016). Accordingly, the emission of PAHs from vehicles and its relationship to traffic volume should be of high concern. Many studies have focused on the contamination characteristics of atmospheric PAHs from mobile sources.8,16,17 The atmospheric levels and patterns of PAHs in the gaseous and particulate phases can be different from those in dust or soil. However, the contamination characteristics of PAHs in road dust and roadside soils with respect to traffic volume have not been fully investigated yet. In addition, only few studies on the contamination of road dust with PAHs have been conducted in South Korea.18–20
Ulsan is called the industrial capital of South Korea and has a population of more than 1.1 million. Large-scale industrial complexes (automobile, shipbuilding, petrochemical, and non-ferrous industries) are located along the east coast of the city. The total number of registered vehicles in Ulsan is more than 0.5 million. Only recently, the first monitoring study on soil pollution with PAHs was conducted in Ulsan.21 This study identified the main sources of PAHs in the soil as industrial activities (e.g., heavy oil combustion, coke oven, and coal burning) and traffic emissions (e.g., combustion of diesel and gasoline). Previous studies on road dust in Ulsan18,19 also suggested the influence of industrial emissions and vehicular exhausts. These studies primarily discussed contamination patterns, particle-size distribution, and toxicity of PAHs. However, roadside soils were not considered, and traffic volume data were used in a limited manner for data interpretation.
In the present study, therefore, roadside soils were collected at 10 sites with a range of traffic volumes in Ulsan, South Korea to clearly understand the relationship between traffic volume and the contamination characteristics of PAHs. In addition, a probabilistic human health risk assessment was conducted. To the best of our knowledge, this study represents the most quantitative data to describe the relationship between PAH contamination and traffic volume in roadside soils.
2. Materials and methods
2.1. Characteristics of the study area and sampling
The study area, Ulsan, is a coastal city with a monsoon-influenced temperate climate with four distinct seasons. The annual average temperature was 15.0 °C in 2015. The monthly average temperature ranged from 3.5 °C in January to 26.4 °C in August. The total precipitation was 1045 mm.22 Ten sites were chosen from the study area (Fig. 1) based on the traffic volume survey.23 The sampling sites were designated either as high traffic volume (>25![[thin space (1/6-em)]](https://www.rsc.org/images/entities/char_2009.gif) 000 vehicles per day) or as low traffic volume (<25
000 vehicles per day) or as low traffic volume (<25![[thin space (1/6-em)]](https://www.rsc.org/images/entities/char_2009.gif) 000 vehicles per day) sites, which follows the common traffic indicator of the average daily traffic (ADT). Sites 1–6 and 7–10 were classified into low and high traffic groups, respectively. Site 1 was selected as a control site, which had no traffic volume. For six sites (Sites 5–10), cars contributed 80% of the total traffic volume, followed by trucks (18%) and buses (2%). Detailed traffic volume data, site descriptions, and fractions of organic matter (fOM) are provided in Table 1. Since four sites (1–4) were not listed in the traffic volume survey,23 we estimated their traffic volumes using vehicle registration, parking lot, and CCTV data around the sites.
000 vehicles per day) sites, which follows the common traffic indicator of the average daily traffic (ADT). Sites 1–6 and 7–10 were classified into low and high traffic groups, respectively. Site 1 was selected as a control site, which had no traffic volume. For six sites (Sites 5–10), cars contributed 80% of the total traffic volume, followed by trucks (18%) and buses (2%). Detailed traffic volume data, site descriptions, and fractions of organic matter (fOM) are provided in Table 1. Since four sites (1–4) were not listed in the traffic volume survey,23 we estimated their traffic volumes using vehicle registration, parking lot, and CCTV data around the sites.
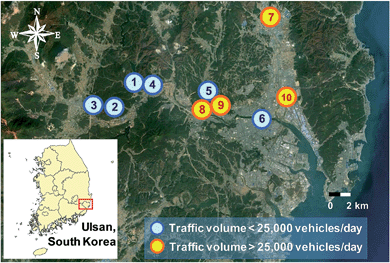 | ||
| Fig. 1 Locations of roadside soil sampling sites in Ulsan, South Korea. The sampling sites are classified based on the daily traffic volume. | ||
| Site location | Traffic volume (vehicles per day) | Site description | f OM (%) | |
|---|---|---|---|---|
| a Estimated by own observation. b f OM values were determined using the loss-on-ignition (LOI) method.3 | ||||
| Site 1 (35°34′35′′N, 129°11′07′′E) | Low traffic | 0a | Trail at the UNIST campus | 4.7 |
| Site 2 (35°33′37′′N, 129°09′50′′E) | <500a | Farm village in a valley | 6.7 | |
| Site 3 (35°33′47′′N, 129°08′12′′E) | <2000a | Approach road to a national highway | 5.3 | |
| Site 4 (35°34′17′′N, 129°12′04′′E) | <3500a | Entrance of UNIST | 4.2 | |
| Site 5 (35°34′06′′N, 129°16′14′′E) | 8181 (car 88%, bus 1%, truck 11%) | Intersection in front of a middle school in a rural area | 4.1 | |
| Site 6 (35°32′48′′N, 129°20′10′′E) | 21![[thin space (1/6-em)]](https://www.rsc.org/images/entities/char_2009.gif) 866 (car 81%, bus 2%, truck 17%) 866 (car 81%, bus 2%, truck 17%) |
Residential area surrounded by apartments | 6.5 | |
| Site 7 (35°38′24′′N, 129°20′40′′E) | High traffic | 32![[thin space (1/6-em)]](https://www.rsc.org/images/entities/char_2009.gif) 820 (car 71%, bus 3%, truck 26%) 820 (car 71%, bus 3%, truck 26%) |
Intersection in a rural/residential area | 8.0 |
| Site 8 (35°33′18′′N, 129°15′56′′E) | 36![[thin space (1/6-em)]](https://www.rsc.org/images/entities/char_2009.gif) 754 (car 83%, bus 3%, truck 14%) 754 (car 83%, bus 3%, truck 14%) |
Intersection in front of a high school | 3.7 | |
| Site 9 (35°33′20′′N, 129°16′34′′E) | 41![[thin space (1/6-em)]](https://www.rsc.org/images/entities/char_2009.gif) 142 (car 83%, bus 2%, truck 15%) 142 (car 83%, bus 2%, truck 15%) |
Intersection in a residential/commercial area | 5.8 | |
| Site 10 (35°33′26′′N, 129°21′38′′E) | 52![[thin space (1/6-em)]](https://www.rsc.org/images/entities/char_2009.gif) 392 (car 73%, bus 3%, truck 24%) 392 (car 73%, bus 3%, truck 24%) |
Intersection near automobile industries | 3.5 | |
Soil sampling was conducted on October 17, 2011. At each sampling site, roadside soils at three points were collected from the surface (<2.5 cm) using soft plastic brushes and metal trowels. The composite samples (∼200 g) in polyethylene zipper bags were stored in a freezer at −5 °C prior to pretreatment and instrumental analysis.
2.2. Sample preparation and instrumental analysis
The roadside soils were homogenized using a steel sieve of 120-mesh size. The homogenized samples (5 g) were then extracted using an accelerated solvent extractor (ASE 350, Dionex) with 60 mL of hexane/acetone solution (v/v 9![[thin space (1/6-em)]](https://www.rsc.org/images/entities/char_2009.gif) :
:![[thin space (1/6-em)]](https://www.rsc.org/images/entities/char_2009.gif) 1). Surrogate standards (30 ng of naphthalene-d8, acenaphthene-d10, phenanthrene-d10, chrysene-d12, and perylene-d12, respectively) were added to the samples prior to the extraction. The extracted samples were concentrated to 10 mL using a nitrogen evaporator (MGS-2200, Eyela). Subsequently, the concentrated samples (2 mL) were cleaned up using silica gel columns (30 cm, 1 cm ID), which were loaded with sodium sulfate (2 g), alumina (2 g), and activated silica gel (5 g). The concentrated extracts were eluted with dichloromethane/hexane (v/v 1
1). Surrogate standards (30 ng of naphthalene-d8, acenaphthene-d10, phenanthrene-d10, chrysene-d12, and perylene-d12, respectively) were added to the samples prior to the extraction. The extracted samples were concentrated to 10 mL using a nitrogen evaporator (MGS-2200, Eyela). Subsequently, the concentrated samples (2 mL) were cleaned up using silica gel columns (30 cm, 1 cm ID), which were loaded with sodium sulfate (2 g), alumina (2 g), and activated silica gel (5 g). The concentrated extracts were eluted with dichloromethane/hexane (v/v 1![[thin space (1/6-em)]](https://www.rsc.org/images/entities/char_2009.gif) :
:![[thin space (1/6-em)]](https://www.rsc.org/images/entities/char_2009.gif) 3, 200 mL) and were concentrated further using a TurboVap II (Caliper) and a nitrogen evaporator to obtain a final volume of 1 mL. Finally, an internal standard (30 ng of p-terphenyl-d14) was injected into the gas chromatograph (GC) vials.
3, 200 mL) and were concentrated further using a TurboVap II (Caliper) and a nitrogen evaporator to obtain a final volume of 1 mL. Finally, an internal standard (30 ng of p-terphenyl-d14) was injected into the gas chromatograph (GC) vials.
The 16 US EPA priority PAHs (i.e., naphthalene (Nap), acenaphthylene (Acy), acenaphthene (Ace), fluorene (Flu), phenanthrene (Phe), anthracene (Ant), fluoranthene (Flt), pyrene (Pyr), benz[a]anthracene (BaA), chrysene (Chr), benzo[b]fluoranthene (BbF), benzo[k]fluoranthene (BkF), benzo[a]pyrene (BaP), indeno[1,2,3-cd]pyrene (IcdP), dibenzo[a,h]anthracene (DahA), and benzo[ghi]perylene (BghiP)) were analyzed using a Gas Chromatograph/Ion Trap Mass Spectrometer (GC/ITMS, ITQ 900, Thermo Scientific) with a DB-5MS column (30 m, 0.25 mm ID, and 0.25 μm film thickness). The Selected Ion Monitoring (SIM) mode was used for the analysis of the target compounds. The carrier gas was helium (He), and its flow rate was 1 mL min−1. The GC oven temperature was as follows: 50 °C (1 min) → 15 °C min−1 → 120 °C → 10 °C min−1 → 230 °C → 5 °C min−1 → 300 °C. The final sample (1 μL) was loaded into the GC using a splitless mode, with the GC injector temperature of 250 °C.
Detailed Quality Assurance/Quality Control (QA/QC) procedures and data were presented in our previous study.21 In short, lab blanks were analyzed using the same analytical method for the real samples to check contamination during the experiment. Mean recoveries of surrogate standards ranged from 85% to 97%. Method detection limits (MDL) were calculated using seven replicates of spiked blank samples and the Student's t value (3.14) for a 99% confidence level.
2.3. Statistical analysis
Statistical analyses were performed using SPSS 22 (IBM Corp.). Since all data passed a normality test (Shapiro–Wilk), which indicates that the data were normally distributed, parametric statistical tests were carried out. For a comparison of mean concentrations of PAHs between two groups, independent-samples t-test with a 95% confidence interval was used. In addition, Pearson's correlation coefficients between PAH concentrations and traffic volumes were computed. A significance level of 0.01 was considered for the correlation analysis. Cluster analysis was also conducted (cluster method: between-groups linkage, measure interval: Squared Euclidean distance).2.4. Human health risk assessment
For the calculation of the cancer risk of PAHs, the probabilistic risk assessment (PRA) model from Risk Assessment Guidance for Superfund was used.24 Monte-Carlo simulation was conducted using Crystal ball 11.1 (Oracle). Three exposure pathways were considered: ingestion, inhalation, and dermal contact.25 Chronic daily intakes (CDIs) of PAHs (mg per kg per day) were calculated using below equations.| CDIingestion = (Csoil × IRsoil × CF × ED × EF)/(BW × AT) | (1) |
| CDIinhalation = (Csoil × HR × ED × EF)/(PEFsoil × BW × AT) | (2) |
| CDIdermal = (Csoil × CF × SA × AF × ABS × ED × EF)/(BW × AT) | (3) |
![[thin space (1/6-em)]](https://www.rsc.org/images/entities/char_2009.gif) 550 days). HR is the air inhalation rate (m3 per day), and PEFsoil is the soil particle emission factor (m3 kg−1). SA is the surface area of skin that contacts soil (cm2 per day), with an assumption that 25% of the skin area may be exposed to soil.26 AF is the relative skin adherence factor (mg cm−2), and ABS is the dermal absorption factor.
550 days). HR is the air inhalation rate (m3 per day), and PEFsoil is the soil particle emission factor (m3 kg−1). SA is the surface area of skin that contacts soil (cm2 per day), with an assumption that 25% of the skin area may be exposed to soil.26 AF is the relative skin adherence factor (mg cm−2), and ABS is the dermal absorption factor.
The cancer risks (Ri) for the three exposure pathways (denoted as i) were calculated by multiplying CDIs and cancer slope factors (CSFs) for the corresponding pathways.
| Ri = CDIi × CSFi | (4) |
The values of risk parameters used for Monte-Carlo simulation for two age groups (children and adults) are listed in Table S1 in the ESI.† The total cancer risk (Rtotal) by the three exposure pathways is the sum of individual risks by each pathway.
| Rtotal = Ringestion + Rinhalation + Rdermal | (5) |
3. Results and discussion
3.1. Levels of PAHs in roadside soils
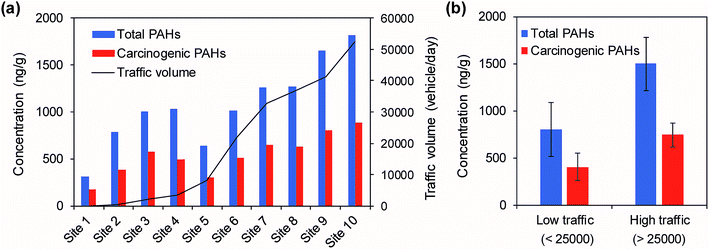
The concentrations of the individual and total PAHs in the roadside soils collected at 10 sites in Ulsan are listed in Table S2.† The concentrations of the ∑16 PAHs with respect to traffic volumes are shown in Fig. 2. The concentrations of the ∑16 PAHs ranged from 310 ng g−1 to 1820 ng g−1 (mean: 1079 ng g−1, median: 1026 ng g−1), while the total carcinogenic PAHs (∑7 carc PAHs: BaA, Chr, BbF, BkF, BaP, IcdP, and DahA) ranged from 178 ng g−1 to 889 ng g−1 (mean: 542 ng g−1, median: 542 ng g−1). The highest concentrations of the total PAHs and the carcinogenic PAHs were measured at Site 10 with the highest traffic volume, whereas the lowest concentrations were measured at Site 1 with the lowest traffic volume (Fig. 2a). There was a strong Pearson correlation (r = 0.88, p < 0.01) between the concentrations of the ∑16 PAHs and the traffic volumes. Furthermore, the organic-matter-normalized concentrations of the ∑16 PAHs (mean: 224 ng g−1, median: 173 ng g−1) and the traffic volumes also showed a positive correlation (r = 0.78, p < 0.01). These correlation results indicate that the high traffic volume is responsible for the elevated levels of PAHs in the roadside soils. Fig. 2b demonstrates a clear comparison of the levels of PAHs with respect to traffic volume. The high traffic sites showed levels of ∑16 PAHs and ∑7 carc PAHs that were twice as high as those at the low traffic sites (t-test, p < 0.01).The correlations between vehicle types (car, bus, and truck) and individual PAH compounds for Sites 5–10 were examined (Table 2). Cars accounted for 80% of the total traffic volumes and showed the highest correlation coefficients (0.972 and 0.970) with ∑16 PAHs and ∑7 carc PAHs at the 0.01 level (2-tailed). The traffic volumes of buses and trucks also had significant correlations with PAH levels. Out of the 16 target compounds, 13, 5, and 5 compounds were significantly correlated with cars, buses, and trucks, respectively. In particular, Nap, Phe, Flt, and Pyr were significantly correlated with all types of vehicles. These results suggest that these four compounds are very common PAHs released from major types of vehicles.
| Napc | Acy | Ace | Flu | Phec | Ant | Fltc | Pyrc | BaA | Chr | BbF | BkF | BaP | IcdP | DahA | BghiP | ∑16 PAHs | ∑7 carc PAHs | |
|---|---|---|---|---|---|---|---|---|---|---|---|---|---|---|---|---|---|---|
| a Correlation is significant at the 0.01 level (2-tailed). b Correlation is significant at the 0.05 level (2-tailed). c The four compounds are significantly correlated with all the types of vehicles. | ||||||||||||||||||
| Car | 0.820b | 0.873b | 0.792 | 0.806 | 0.937a | 0.931a | 0.981a | 0.916b | 0.869b | 0.838b | 0.946a | 0.816b | 0.947a | 0.932a | 0.708 | 0.901b | 0.972a | 0.970a |
| Bus | 0.818b | 0.706 | 0.787 | 0.676 | 0.850b | 0.776 | 0.891b | 0.906b | 0.706 | 0.836b | 0.732 | 0.586 | 0.759 | 0.731 | 0.499 | 0.730 | 0.857b | 0.880b |
| Truck | 0.838b | 0.705 | 0.833b | 0.740 | 0.856b | 0.801 | 0.843b | 0.940a | 0.664 | 0.775 | 0.709 | 0.547 | 0.747 | 0.743 | 0.441 | 0.770 | 0.862b | 0.880b |
| Total vehicles | 0.859b | 0.860b | 0.836b | 0.819b | 0.952a | 0.931a | 0.983a | 0.961a | 0.846b | 0.857b | 0.916b | 0.772 | 0.927a | 0.914b | 0.660 | 0.898b | 0.980a | 0.984a |
As expected, Site 1 (control) showed the lowest levels of PAHs (310 ng g−1 of ∑16 PAHs), which is comparable to the average levels in rural (mean: 220 ng g−1) and urban (mean: 390 ng g−1) soils in Ulsan.21 Even though the traffic volumes at Sites 2, 3, and 4 are low (<3500 vehicles per day), their PAH levels (mean: 942 ng g−1) are similar to the level (1016 ng g−1) at Site 6 with a traffic volume of 21![[thin space (1/6-em)]](https://www.rsc.org/images/entities/char_2009.gif) 866 vehicles per day. Site 2 is in a farm village in a valley, and a reserve forces training area is located further up the valley (<300 m). Puffs of soot emissions from military trucks are frequently observed in this valley. Site 3 is located on an approach road to a national highway. Thus, the total traffic volume around this site appears to be much higher than the traffic load of the site. Site 4 is located at the entrance of the university near a circular intersection and the last bus stop. Therefore, emissions from starting and idling engines are likely the main sources of PAHs. Furthermore, Sites 1–4 are located in rural areas, which can be commonly contaminated by PAHs emitted from agricultural biomass burning and domestic heating.27 Site 5 is located in front of a middle school in a rural area, and Site 6 is located in a residential area surrounded by apartments. These two sites have no specific features for PAH contamination.
866 vehicles per day. Site 2 is in a farm village in a valley, and a reserve forces training area is located further up the valley (<300 m). Puffs of soot emissions from military trucks are frequently observed in this valley. Site 3 is located on an approach road to a national highway. Thus, the total traffic volume around this site appears to be much higher than the traffic load of the site. Site 4 is located at the entrance of the university near a circular intersection and the last bus stop. Therefore, emissions from starting and idling engines are likely the main sources of PAHs. Furthermore, Sites 1–4 are located in rural areas, which can be commonly contaminated by PAHs emitted from agricultural biomass burning and domestic heating.27 Site 5 is located in front of a middle school in a rural area, and Site 6 is located in a residential area surrounded by apartments. These two sites have no specific features for PAH contamination.
Among the high traffic sites, Sites 7 and 10 are located on a major industrial road from Ulsan to Pohang, a city with a large-scale steel industrial complex. Therefore, relatively high levels of PAHs at these sites can be explained by the high traffic volumes of heavy-duty vehicles traveling between the two cities. In our earlier study, the highest levels of PM10 and NO2 in Ulsan were measured along this road.28 In addition, Site 10 is located close to automobile and petrochemical industrial facilities; thus, the site might also be influenced by industrial emissions. Sites 8 and 9 are located at intersections with eight lanes in residential/commercial areas, resulting in heavy traffic volumes.
The levels of PAHs can also be influenced by vehicle speed; lower vehicle speeds resulted in elevated concentrations of PAHs.19 This may be one of the reasons that the rural sites with lower vehicle speeds on narrow two-lane roads showed rather elevated concentrations of PAHs. As all the high traffic sites are located at intersections, the higher levels of PAHs in the roadside soils can be attributed to the reduction of speeds, engine idling, and engine starting at intersections. Furthermore, the emissions of PAHs from vehicles can be reduced by improvements of engine performance and oil quality,29 suggesting that the traffic volume only is not enough for the estimation of soil contamination and the health effect. In addition, PAH concentrations can be affected by the pavement type. For example, asphalt roads showed higher PAH levels than concrete roads.19 Because all the sampling sites in this study were beside asphalt roads, the type of pavement was not considered.
The levels of ∑16 PAHs in this study (0.3–1.8 μg g−1) were generally lower than those found in road dust at different locations in the world,15 such as in Birmingham, UK (14.1–96.6 μg g−1).30 Previous studies conducted in Ulsan also showed much higher levels of PAHs in road dust: 11.8–245.1 μg g−1 (ref. 18) and 19.7–154.6 μg g−1.19 Meanwhile, previous studies on roadside soils generally reported relatively low PAH concentrations (Table S3†). For example, roadside soils collected in Tijuana, Mexico showed relatively low levels of PAHs, ranging from 0.05 to 1.86 μg g−1 with a mean of 0.31 μg g−1.31 The lower levels of PAHs in roadside soils can be explained by the fact that road dust is contaminated more directly by vehicle emissions and asphalt wear and tear than roadside soils.15 In addition, the dilution effect caused by less polluted soils might be responsible for the lower levels of PAHs. On the other hand, road dust samples collected from creeks in the Masan Bay in Korea showed levels of ∑16 PAHs similar to those observed in this study for the road with the heaviest traffic (0.45–4.1 μg g−1), industrial areas (0.1–3.56 μg g−1), and a residential area (0.32–1.95 μg g−1).20 These results suggest that road dust in Ulsan18,19 may be much more highly contaminated with PAHs than road dust in other industrial cities in Korea. However, additional comparison studies with other Korean cities are required.
3.2. Profile and toxicity of PAHs in roadside soils
The profile of 16 individual PAHs with respect to traffic volume is presented in Fig. 3. The concentrations of most PAHs were higher for the high traffic sites than for the low traffic sites. Specifically, the concentrations of Phe, Flt, Pyr, Chr, and BghiP were about two times higher at the high traffic sites than at the low traffic sites. These results suggest that these five PAHs can serve as strong indicators of traffic emissions. Indeed, Phe, Flt, Pyr, and BghiP are known as typical compounds emitted from gasoline and diesel engines.15,32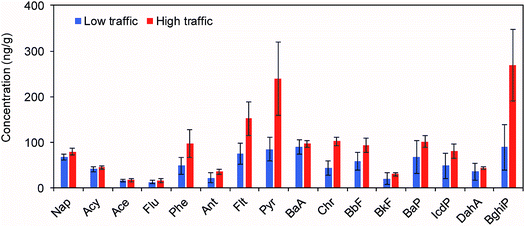 | ||
| Fig. 3 Average profiles of 16 individual PAHs in roadside soils according to traffic volumes. Error bars represent standard deviations. | ||
Site-specific relative fractions of individual PAHs and groups of ring numbers were also considered for 2 rings (Nap), 3 rings (Acy, Ace, Flu, Phe, and Ant), 4 rings (Plt, Pyr, BaA, and Chr), 5 rings (BbF, BkF, BaP, and DahA), and 6 rings (IcdP and BghiP) (Fig. 4). The patterns were generally similar at each site, except at Site 1, where several heavy PAHs with 5 and 6 rings were not detected. There was an increasing trend in the contribution of the 4- and 6-ring PAHs to the concentration of ∑16 PAHs with traffic volumes mostly owing to the substantial increases in Pyr and BghiP concentrations. As mentioned above, these two compounds are typically emitted from diesel and gasoline vehicles. Overall, this observation indicates that the levels and patterns of PAHs in the roadside soils were substantially affected by the vehicle emissions.
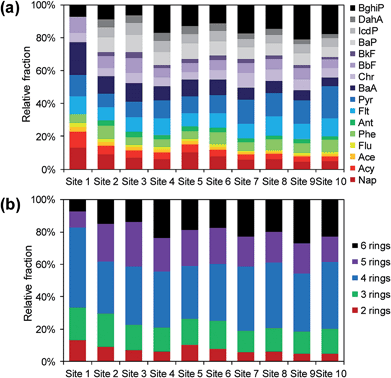 | ||
| Fig. 4 Relative fractions of PAHs in roadside soils: (a) individual compounds and (b) each group of PAHs with ring numbers. | ||
Cluster analysis was used to more objectively investigate the similarity of PAH profiles at each sampling site (Fig. 5). Three clusters were identified: Group A (Sites 2, 3, 5, and 6), Group B (Sites 4, 7, 8, 9, and 10), and Group C (Site 1). The control site was definitely separated from two groups, further indicating less influence of traffic emissions. The low and high traffic sites (except for Site 4) were clustered into Groups A and B, respectively. This result reveals that traffic volumes alter the composition of PAHs in roadside soils.
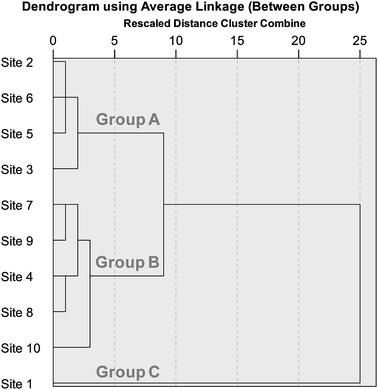 | ||
| Fig. 5 Dendrogram of cluster analysis for PAH profiles at each site with an option of average linkage between groups. The individual data were normalized by ∑16 PAHs. | ||
The contributions of heavy PAHs with 4–6 rings gradually increased with increasing traffic volumes (i.e., from Site 1 to Site 10) (Fig. 4b), implying that carcinogenicity was also enhanced by the vehicle emissions as was already shown in Fig. 2. Meanwhile, the BaP equivalent concentrations (∑16 BaPeq) did not show a statistical difference between the low (127 ± 61 ng g−1) and high (180 ± 21 ng g−1) traffic sites (t-test, p > 0.05). BaA, BbF, BkF, BaP, IcdP, and DahA have relatively higher TEFs (0.1 or 1) than other PAHs, but their concentrations were not significantly higher at the high traffic sites. Therefore, it is preferable to consider ∑7 carcPAHs and ∑16 BaPeq together for the evaluation of the health risks associated with vehicles emitting PAHs. The BaP equivalent concentration was lowest at Site 1 (14.7 ng g−1) with no direct traffic effect, demonstrating that vehicle emissions enhance the toxicity of roadside soils.
3.3. Source identification
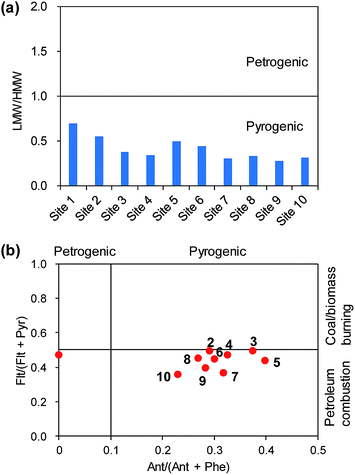
As discussed above, the roadside soils appeared to be directly influenced by the traffic emissions except at Site 1. Although the diagnostic ratios were expected to reflect the effect of the pyrogenic sources, the ratios were calculated to evaluate the degree of the traffic effect. The ratio of low molecular weight (LMW) PAHs with 2–3 rings to high molecular weight (HMW) PAHs with 4–6 rings was used. If the LMW/HMW ratio is smaller than 1.0, it is assumed that the soil is more directly contaminated by pyrogenic sources.33 All the LMW/HMW ratios of the roadside soils were lower than 1.0 (Fig. 6a), suggesting a strong impact of the pyrogenic sources, such as vehicle emissions. Furthermore, a gradual decrease in the LMW/HMW ratios with increasing traffic volumes was evident, which clearly supports the influence of vehicle emissions. In our earlier study in Ulsan,21 16 soil sampling sites were evaluated with regard to the effect of pyrogenic sources, and 9 sites were affected by petrogenic sources. The major reason for the petrogenic effect was attributed to potential oil spills, for example, parking lots and petrochemical industries. Meanwhile, the roadside soils in the present study appear to have been affected considerably by traffic emissions.In addition, the ratios of Ant/(Ant + Phe) and Flt/(Flt + Pyr) were calculated (Fig. 6b). The Ant/(Ant + Phe) ratio was used to distinguish between petrogenic and pyrogenic sources, while the Flt/(Flt + Pyr) ratio can identify petroleum combustion and coal/biomass burning. These two diagnostic ratios were successfully used for the source identification of atmospheric PAHs in Ulsan.27 The scatter plot strongly suggests the influence of pyrogenic sources. The Ant/(Ant + Phe) ratio clearly demarcated the uniqueness of Site 1 as compared to the other sites, which were located on the pyrogenic side of the graph (Fig. 6b). However, Site 1 might not be directly contaminated by petrogenic sources; note that Ant was not detected at Site 1. The traffic volumes were not statistically correlated with the Ant/(Ant + Phe) ratios (Spearman correlation, p > 0.05). This result suggests that the Ant/(Ant + Phe) ratios cannot reflect the degree of PAH contamination by traffic volumes. On the other hand, the Flt/(Flt + Pyr) ratios were negatively correlated with the traffic volumes (Pearson correlation, r = −0.84, p < 0.01), indicating that the influence of petroleum combustion (i.e., diesel and gasoline emissions) on the roadside soils was intensified by the increasing traffic volumes.
3.4. Human health risk
The results of probability density functions of cancer risk by the three exposure pathways for children and adults are presented in Fig. 7. The total cancer risks for children (5th percentile: 6.38 × 10⁻⁸, mean: 1.61 × 10⁻⁶, and 95th percentile: 5.50 × 10⁻⁶) were higher than the risks (5th percentile: 7.91 × 10⁻⁸, mean: 1.59 × 10⁻⁶, and 95 percentile: 5.10 × 10⁻⁶) for adults. The 95th percentile cancer risks for both age groups were in the acceptable range (10−6–10−4) of the US EPA.34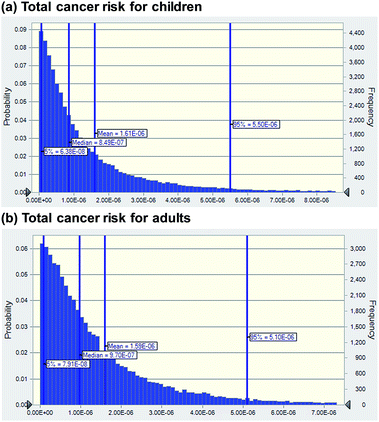 | ||
| Fig. 7 Probability density functions of cancer risk for (a) children (0–18 years old) and (b) adults (19–70 years old). | ||
Among the three exposure pathways, dermal contact was a dominant pathway, accounting for 53% (2.98 × 10⁻⁶) and 73% (3.74 × 10⁻⁶) of the total cancer risk at 95th percentiles for both children and adults, respectively (Fig. 8). For both age groups, the contributions of inhalation exposure were negligible (0.001% and 0.002%, respectively). The cancer risk by soil ingestion for children (2.63 × 10⁻⁶) was higher than that for adults (1.38 × 10⁻⁶), due to a higher value of soil ingestion rate (mg per day, IRsoil). On the other hand, a higher air inhalation rate (m3 per day, HR), a larger surface area of skin that contacts soil (cm2 per day, SA), and a longer exposure duration (year, ED) for adults resulted in higher risks than those for children. These patterns for the three exposure pathways are identical to the results of previous studies,25,35 but the other study34 reported lower risk levels via soil ingestion in children than those in adult. The reason for this discrepancy was that selected IRsoil values (geometric mean: 12.24 mg per day) for children were lower than those (geometric mean: 26.95 mg per day) for adults. However, the US EPA and the Korean Ministry of Environment recommend higher IRsoil values for children than adults.36,37
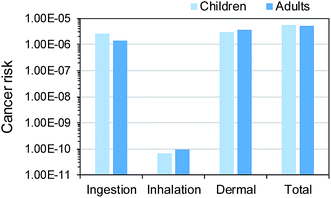 | ||
| Fig. 8 Contributions of three exposure pathways to the total cancer risk at 95th percentiles for children and adults. | ||
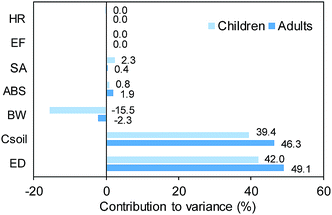
A sensitivity analysis was conducted to evaluate the influence of important input variables for the variance in cancer risk simulations. In Crystal ball software, the contribution of individual input variables to the total variance of the risk simulation is calculated by squaring the rank correlation coefficients and normalizing them to 100%.38 Exposure duration (year, ED) and BaP equivalent concentration (mg kg−1, Csoil) were the most influential input parameters on the variance in total cancer risk, followed by body weight (kg, BW), dermal absorption factor (ABS), and surface area of skin that contacts soil (cm2 per day, SA) (Fig. 9), which are consistent with the results of previous studies.25,34 In particular, the contribution of BW for children was relatively high (−15.5%) because of a high relative standard deviation (53.6%) of BW of children with a wide range of ages (0–18 years). In this sensitivity analysis, several parameters, such as relative skin adherence factor (mg cm−2, AF), soil ingestion rate (mg per day, IRsoil), and cancer slope factors for BaP (mg per kg per day, CSF), were not considered because they were regarded as constants (Table S1†). Among them, AF was reported to be the second most influential parameter.25 Therefore, the AF values in the former studies25,34 were applied to this study, and they accounted for 8.3% and 11.2% of the variance of cancer risk for children and adults, respectively.
Even though Monte-Carlo simulation was applied to evaluate the uncertainty of the predicted cancer risk, there are still other sources of uncertainties. Korean exposure data for BW, IRsoil for children, HR, and SA were used (Table S1†), but other exposure parameters were mostly the recommended values from the US EPA. In addition, the uncertainty of TEFs for individual PAHs and limited dose–response data can be addressed.25,34,35
4. Conclusion
The results of this study indicate that traffic volume is one of the key parameters to determine the levels and patterns of PAHs in roadside soils. Both the levels of ∑16 PAHs and OM-normalized ∑16 PAHs were strongly correlated with traffic volumes at each sampling site. The levels of ∑7 carc PAHs were also higher at the high traffic sites. The profiles of the PAHs were changed by increasing concentrations of the traffic indicator compounds, such as Phe, Flt, Pyr, and BghiP. The direct influence of the traffic emissions on the roadside soils was also confirmed by three different diagnostic ratios. This study clearly demonstrates the relationship between the traffic volume and the contamination of PAHs in roadside soils. Since humans can be exposed to PAHs in road dust and roadside soils via resuspension, and PAHs can be transported to the aquatic environment by runoff, more attention should be focused on this topic.Conflicts of interest
There are no conflicts to declare.Acknowledgements
This work was supported by the National Research Foundation of Korea (NRF) grant funded by the Korean Government (MEST) (2017R1A2B4003229) and the 2018 Research Fund of UNIST (1.180015.01). We acknowledge Jun-Gyu Park for sampling, Joung-Hoon Cho for data handling, and Ezaz Ahmed for editing the first draft.References
- ATSDR, Toxicological profile for polycyclic aromatic hydrocarbons, US Department of Health and Human Services, Atlanta, Georgia, USA, 1995 Search PubMed.
- I. C. T. Nisbet and P. K. LaGoy, Toxic equivalency factors (TEFs) for polycyclic aromatic hydrocarbons (PAHs), Regul. Toxicol. Pharmacol., 1992, 16, 290–300 CrossRef CAS PubMed.
- S.-D. Choi, Time trends in the levels and patterns of polycyclic aromatic hydrocarbons (PAHs) in pine bark, litter, and soil after a forest fire, Sci. Total Environ., 2014, 470, 1441–1449 CrossRef PubMed.
- E. Simon, S.-D. Choi and M.-K. Park, Understanding the fate of polycyclic aromatic hydrocarbons at a forest fire site using a conceptual model based on field monitoring, J. Hazard. Mater., 2016, 317, 632–639 CrossRef CAS PubMed.
- G.-C. Fang, Y.-S. Wu, P. P.-C. Fu, I.-L. Yang and M.-H. Chen, Polycyclic aromatic hydrocarbons in the ambient air of suburban and industrial regions of central Taiwan, Chemosphere, 2004, 54, 443–452 CrossRef CAS PubMed.
- T. N. T. Nguyen, K.-S. Jung, J. M. Son, H.-O. Kwon and S.-D. Choi, Seasonal variation, phase distribution, and source identification of atmospheric polycyclic aromatic hydrocarbons at a semi-rural site in Ulsan, South Korea, Environ. Pollut., 2018, 236, 529–539 CrossRef CAS PubMed.
- G. Jin, L. Cong, Y. Fang, J. Li, M. He and D. Li, Polycyclic aromatic hydrocarbons in air particulates and its effect on the Tumen river area, Northeast China, Atmos. Environ., 2012, 60, 298–304 CrossRef CAS.
- J. Gunawardena, P. Egodawatta, G. A. Ayoko and A. Goonetilleke, Role of traffic in atmospheric accumulation of heavy metals and polycyclic aromatic hydrocarbons, Atmos. Environ., 2012, 54, 502–510 CrossRef CAS.
- L. C. Marr, T. W. Kirchstetter, R. A. Harley, A. H. Miguel, S. V. Hering and S. K. Hammond, Characterization of polycyclic aromatic hydrocarbons in motor vehicle fuels and exhaust emissions, Environ. Sci. Technol., 1999, 33, 3091–3099 CrossRef CAS.
- P. Pengchai, H. Furumai and F. Nakajima, Source apportionment of polycyclic aromatic hydrocarbons in road dust in Tokyo, Polycyclic Aromat. Compd., 2004, 24, 773–789 CrossRef CAS.
- S.-D. Choi, C. Shunthirasingham, G. L. Daly, H. Xiao, Y. D. Lei and F. Wania, Levels of polycyclic aromatic hydrocarbons in Canadian mountain air and soil are controlled by proximity to roads, Environ. Pollut., 2009, 157, 3199–3206 CrossRef CAS PubMed.
- N. Soltani, B. Keshavarzi, F. Moore, T. Tavakol, A. R. Lahijanzadeh, N. Jaafarzadeh and M. Kermani, Ecological and human health hazards of heavy metals and polycyclic aromatic hydrocarbons (PAHs) in road dust of Isfahan metropolis, Iran, Sci. Total Environ., 2015, 505, 712–723 CrossRef CAS PubMed.
- L. Maltby, A. Boxall, D. M. Forrow, P. Calow and C. I. Betton, The effects of motorway runoff on freshwater ecosystems: 2. Identifying major toxicants, Environ. Toxicol. Chem., 1995, 14, 1093–1101 CrossRef CAS.
- R. Aryal, H. Furumai, F. Nakajima and M. Boller, Characteristics of particle-associated PAHs in a first flush of a highway runoff, Water Sci. Technol., 2006, 53, 245–251 CrossRef CAS PubMed.
- D. Majumdar, B. Rajaram, S. Meshram, P. Suryawanshi and C. V. Chalapati Rao, Worldwide distribution of polycyclic aromatic hydrocarbons in urban road dust, Int. J. Environ. Sci. Technol., 2016, 14, 397–420 CrossRef.
- W.-J. Lee, Y.-F. Wang, T.-C. Lin, Y.-Y. Chen, W.-C. Lin, C.-C. Ku and J.-T. Cheng, PAH characteristics in the ambient air of traffic-source, Sci. Total Environ., 1995, 159, 185–200 CrossRef CAS.
- J. Oda, S. Nomura, A. Yasuhara and T. Shibamoto, Mobile sources of atmospheric polycyclic aromatic hydrocarbons in a roadway tunnel, Atmos. Environ., 2001, 35, 4819–4827 CrossRef CAS.
- T. T. Dong and B.-K. Lee, Characteristics, toxicity, and source apportionment of polycyclic aromatic hydrocarbons (PAHs) in road dust of Ulsan, Korea, Chemosphere, 2009, 74, 1245–1253 CrossRef CAS PubMed.
- B.-K. Lee and T. T. Dong, Effects of road characteristics on distribution and toxicity of polycyclic aromatic hydrocarbons in urban road dust of Ulsan, Korea, J. Hazard. Mater., 2010, 175, 540–550 CrossRef CAS PubMed.
- S. Y. Ha, G. B. Kim, U. H. Yim, W. J. Shim, S. H. Hong and G. M. Han, Particle-size distribution of polycyclic aromatic hydrocarbons in urban road dust of Masan, Korea, Arch. Environ. Contam. Toxicol., 2012, 63, 189–198 CrossRef CAS PubMed.
- H.-O. Kwon and S.-D. Choi, Polycyclic aromatic hydrocarbons (PAHs) in soils from a multi-industrial city, South Korea, Sci. Total Environ., 2014, 470, 1494–1501 CrossRef PubMed.
- Ulsan Metropolitan City, White Paper of Environment, Ulsan, Korea, 2016 Search PubMed.
- Ulsan Metropolitan City, Annual Speed and Traffic Volume Data, Ulsan, Korea, 2011 Search PubMed.
- US EPA, Risk Assessment Guidance for Superfund: Volume 3-Part A, Process for Conducting Probabilistic Risk Assessment, United States Environmental Protection Agency, 2001 Search PubMed.
- A. Tarafdar and A. Sinha, Public health risk assessment with bioaccessibility considerations for soil PAHs at oil refinery vicinity areas in India, Sci. Total Environ., 2018, 616–617, 1477–1484 CrossRef CAS PubMed.
- US EPA, Dermal Exposure Assessment: Principles and Applications, Office of Health and Environmental Assessment, United States Environmental Protection Agency, 1992 Search PubMed.
- S.-D. Choi, H.-O. Kwon, Y.-S. Lee, E.-J. Park and J.-Y. Oh, Improving the spatial resolution of atmospheric polycyclic aromatic hydrocarbons using passive air samplers in a multi-industrial city, J. Hazard. Mater., 2012, 241–242, 252–258 CrossRef CAS PubMed.
- K. Clarke, H.-O. Kwon and S.-D. Choi, Fast and reliable source identification of criteria air pollutants in an industrial city, Atmos. Environ., 2014, 95, 239–248 CrossRef CAS.
- K. Hayakawa, N. Tang, E. G. Nagato, A. Toriba, S. Sakai, F. Kano, S. Goto, O. Endo, K.-i. Arashidani and H. Kakimoto, Long term trends in atmospheric concentrations of polycyclic aromatic hydrocarbons and nitropolycyclic aromatic hydrocarbons: A study of Japanese cities from 1997 to 2014, Environ. Pollut., 2018, 233, 474–482 CrossRef CAS PubMed.
- D. Smith, E. Edelhauser and R. M. Harrison, Polynuclear aromatic hydrocarbon concentrations in road dust and soil samples collected in the United Kingdom and Pakistan, Environ. Technol., 1995, 16, 45–53 CrossRef CAS.
- E. Garcia-Flores, F. T. Wakida, D. D. Rodríguez-Mendivil and H. Espinoza-Gomez, Polycyclic Aromatic Hydrocarbons in Road-Deposited Sediments and Roadside Soil in Tijuana, Mexico, Soil Sediment Contam., 2016, 25, 223–239 CrossRef CAS.
- R. M. Harrison, D. I. T. Smith and L. Luhana, Source apportionment of atmospheric polycyclic aromatic hydrocarbons collected from an urban location in Birmingham, U.K., Environ. Sci. Technol., 1996, 30, 825–832 CrossRef CAS.
- H. Soclo, P. Garrigues and M. Ewald, Origin of polycyclic aromatic hydrocarbons (PAHs) in coastal marine sediments: case studies in Cotonou (Benin) and Aquitaine (France) areas, Mar. Pollut. Bull., 2000, 40, 387–396 CrossRef CAS.
- W. Yang, Y. Lang and G. Li, Cancer risk of polycyclic aromatic hydrocarbons (PAHs) in the soils from Jiaozhou Bay wetland, Chemosphere, 2014, 112, 289–295 CrossRef CAS PubMed.
- A. Tarafdar and A. Sinha, Health risk assessment and source study of PAHs from roadside soil dust of a heavy mining area in India, Arch. Environ. Occup. Health, 2018, 1–11 Search PubMed.
- US EPA, Exposure Factors Handbook 2011 Edition, National Center for Environmental Assessment, United States Environmental Protection Agency, USA, 2011 Search PubMed.
- NIER, Korean Exposure Factors Handbook for Children, National Institute of Environmental Research, Ministry of Environment, Korea, 2016 Search PubMed.
- Oracle, Crystal Ball User's Guide, USA, 2014 Search PubMed.
Footnote |
| † Electronic supplementary information (ESI) available. See DOI: 10.1039/c8em00532j |
| This journal is © The Royal Society of Chemistry 2019 |

