 Open Access Article
Faradaic electro-swing reactive adsorption for CO2 capture†
Sahag
Voskian
 and
T. Alan
Hatton
 *
*
Department of Chemical Engineering, Massachusetts Institute of Technology, Cambridge, MA 02139, USA. E-mail: tahatton@mit.edu
First published on 1st October 2019
Abstract
Carbon capture is one of the foremost methods for curtailing greenhouse gas emissions. Incumbent technologies are inherently inefficient due to thermal energy losses, large footprint, or degradation of sorbent material. We report a solid-state faradaic electro-swing reactive adsorption system comprising an electrochemical cell that exploits the reductive addition of CO2 to quinones for carbon capture. The reported device is compact and flexible, obviates the need for ancillary equipment, and eliminates the parasitic energy losses by using electrochemically activated redox carriers. An electrochemical cell with a polyanthraquinone–carbon nanotube composite negative electrode captures CO2 upon charging via the carboxylation of reduced quinones, and releases CO2 upon discharge. The cell architecture maximizes the surface area exposed to gas, allowing for ease of stacking of the cells in a parallel passage contactor bed. We demonstrate the capture of CO2 both in a sealed chamber and in an adsorption bed from inlet streams of CO2 concentrations as low as 0.6% (6000 ppm) and up to 10%, at a constant CO2 capacity with a faradaic efficiency of >90%, and a work of 40–90 kJ per mole of CO2 captured, with great durability of electrochemical cells showing <30% loss of capacity after 7000 cylces.
Broader contextThere is a clear scientific consensus on the role of anthropogenic greenhouse gas (GHG) emissions in the unusually wild fluctuations of global climate patterns over the last century, to which carbon dioxide is the largest contributor. This has generated a scientific tide in the study of carbon removal techniques over the last three decades, which has slowly gathered momentum, culminating in the 2015 Paris Agreement, which heavily emphasized the role of carbon removal by tackling emissions or via negative emissions technologies. While a path forward for carbon capture is being shaped by a mix of incumbent actors and newcomers, the great majority of the proposed processes rely on conventional concepts. Moreover, most of these processes have a large balance of plant which hinders their potential to flexibly adapt to the multi-scale nature of carbon capture. Herein, we demonstrate a new approach which presents a paradigm shift in adsorption type processes and carbon capture. The electro-swing basis of our process allows its linear scaling with desired capacity and lends it geometric flexibility. It also allows carbon capture from streams of any concentration, and its release into any carrier streams, including pure CO2, with a low balance of plant. |
Introduction
With the alarming increase in the atmospheric concentration of carbon dioxide (CO2) and its implications for global climate pattern developments,1,2 mitigation of climate change through curtailment of anthropogenic CO2 emissions has been one of the most urgent socioeconomic and scientific problems in the global arena over the last decade.3 To this end, a number of technologies have been developed for the large-scale capture of CO2 from combustion and other industrial processes to produce high-purity CO2 streams for storage or valorization.4 The most mature of these technologies are solvent scrubbing, mainly amine scrubbing,5 and oxyfuel combustion,6 which target high CO2 concentration streams (>10%). These approaches have a large footprint and, when retrofitted to a process, can require major modifications to the plant. Consequently, there has been a major effort to develop new materials and processes for high efficiency CO2-capture, including sorbents for pressure and temperature swing adsorption systems,7 and membranes for selective transport of the CO2.8 Furthermore, many potential applications of carbon capture require compact devices due to space limitations, such as in the direct capture of CO2 from tailpipe exhausts on board mobile sources, in which there is growing interest given the large contribution of transportation exhaust to greenhouse gas emissions (33.5% of U.S. CO2 emissions in 2016).9In addition to the capture of CO2 from direct combustion processes, there is a need to remove CO2 from enclosed spaces for ventilation purposes in buildings and car cabins, or for cabin environmental control systems on board spacecraft and submarines, where the maximum allowed CO2 concentration in habitable spaces is 5000 ppm (or 0.5%).10 The first of such systems was developed by Winnick et al., for the electrochemical capture of CO2 in spacecraft cabins using molten carbonates.11 However, the low concentration of CO2 in such applications poses a challenge, mainly due to the low driving forces for mass transfer and the large quantities of other species present in air in addition to CO2.12 Thus, carbon capture is a multi-scale problem, where the CO2-rich streams to be treated vary greatly in volume, concentration and composition, and different criteria need to be fulfilled to ensure optimal processing depending on whether sources are industrial or small-scale (e.g., power plants or oil and gas heaters), concentrated or dilute (exhausts from combustion or air in confined spaces), and clean or contaminated with other pollutants.
Many of the CO2-capture chemical processes that involve a capture agent such as amines or solid sorbents require temperature and/or pressure swings to release the captured CO2 and regenerate the agents for further capture. These swings result in inefficiencies due to energy wasted in heating solvents and sorbents, pressurizing feed gas, or drawing a vacuum for desorption. Electrochemical systems can minimize such parasitic energy losses as they can be operated at near isothermal conditions, with significantly higher efficiencies than their thermal-swing (TSA) and pressure-swing (PSA) adsorption counterparts.13 One mode of electrochemical capture of CO2 is through the use of a redox-active carrier.
Electrochemically mediated selective transport of chemical species was first reported by Ward et al.,14 where a redox-active carrier (ferrous ion) was used to transport nitric oxide across a membrane. Since then, a number of systems have been developed for transporting chemical species by redox-active carriers that are activated at one electrode, to bind with the target species, and deactivated at the opposite electrode, to release the target and regenerate the carrier.15,16 Systems that have been proposed for the concentration of CO2 through this approach have been based on a number of different carrier molecules, such as quinones,17–20 4,4′-bipyridine,21 and thiolates.22,23 Quinones are of particular interest to this work for their superior electrochemical performance, serving as redox-active carriers for CO2 in electrochemically mediated separation processes. DuBois et al. demonstrated this possibility, and studied the thermodynamics of an electrochemical CO2 pumping system that utilizes quinones.18 More work followed, where Scovazzo et al. demonstrated the electrochemical separation of CO2 from <1% concentration gas mixtures using 2,6-di-tert-butyl-1,4-benzoquinone as a carrier in ionic liquid (IL) and organic solvent electrolytes media,19 while Gurkan et al. screened a number of ILs to serve as suitable electrolytes for quinone carriers in an electrochemically mediated selective transport system for CO2.20 All of these systems, however, require the transport of the electrolyte and the dissolved carrier molecules between two electrodes in an electrochemical cell for capture and release of CO2. This limits their implementation in a number of applications where the requirement for flow systems and pumping, and the large footprint, are problematic.
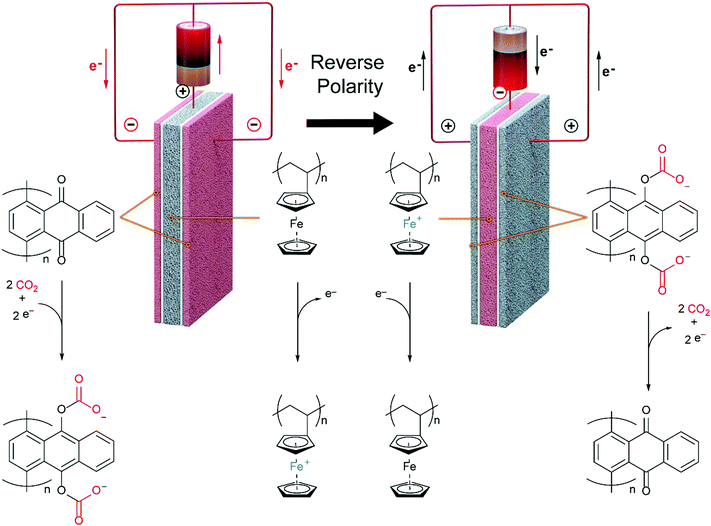
In this work, we develop a compact electrochemical device for CO2 capture that eliminates the requirement for complex flow systems, and that can be effective in the treatment of both high and low concentration feed streams. A quinone-utilizing faradaic electrochemical cell that fulfils these requirements and operates as an Electro-Swing Adsorption (ESA) process is illustrated schematically in Fig. 1. The cell is comprised of two cathode electrode substrates coated with a CO2-binding quinone–carbon nanotube (Q–CNT) composite sandwiching an anode electrode substrate coated with a ferrocene–CNT (Fc–CNT) composite, with separator membranes between the electrodes. This cell architecture is employed to maximize the CO2-binding surface area of the cell exposed to gas flow in a parallel passage adsorbent contactor design where stacks of these cells form parallel gas channels. The Fc–CNT electrode serves as an electron source and sink for the reduction and oxidation, respectively, of the Q–CNT electrodes to regulate the uptake and release of the CO2. Wetting of porous non-woven carbon fiber mats used as the electrode substrates by a room temperature ionic liquid (RTIL) electrolyte enables effective ionic currents to pass through the electrolyte on activation and deactivation of the electrodes, and permits the diffusion of CO2 into the electrolyte-wetted cathodes during capture.
The effectiveness of the electro-swing concept for CO2 capture and release was demonstrated in a sealed system in which cell polarity was cycled to regulate the activation and deactivation of the carrier, i.e. reduction and oxidation of the redox active quinone. This was in lieu of the advection of the carrier electrolyte solution between two electrodes with a difference in potential.19 The performance of flow-through modules constructed with stacks of the assembled electrode cells was also assessed. The CO2 capture processes were modelled to provide greater insight into the operational principles for this technology.
Ultimately, the goal of this work was to demonstrate an electrochemically activated packed parallel passage contactor adsorption system for the removal of CO2 from flue gas and other CO2-rich streams. The regeneration of the bed takes place on reversal of the polarity of the stack in an ESA, with analogies to PSA systems, where adsorption takes place at high pressure and desorption at a lower pressure,24 or TSA systems, where adsorption takes place at low temperatures and the fixed bed is regenerated at higher temperatures.25
Results and discussion
Design of the electrochemical cell
Thin films of crystallized organic compounds have been studied as a means of immobilizing CO2 redox-active carriers onto electrode substrates.26 Redox-active polymers have long been the preferred electrode material when using organic molecules in electrochemical cells, however, because polymers are less soluble in the electrolyte than their corresponding redox-active repeating units, and thus the self-discharge of the cell can be avoided, and its cycling performance improved.27 For example, quinone polymers have been investigated as suitable cathode materials in lithium-ion batteries,28 and pseudocapacitive energy storage devices.29 These polymers are usually made into composites with conductive high-surface area carbon materials, such as carbon black, graphite or carbon nanotubes (CNT), to enhance the overall conductivity of the electrode material and increase the area of the polymer exposed to the electrolyte.30 Here, we used a polyanthraquinone–CNT (PAQ–CNT) composite for the cathode and polyvinylferrocene–CNT (PVFc–CNT) composite for the anode.31 The electrolyte used was the RTIL 1-butyl-3-methylimidazolium bis(trifluoromethylsulfonyl)imide ([Bmim][TF2N]), selected for its low volatility, which allows for flow of gas over the wetted electrodes without loss of electrolyte to evaporation or entrainment.A sealed chamber was constructed in which CO2 capture and release on electrochemical activation and deactivation of the quinones, respectively, was indicated by the concomitant pressure changes in the chamber. A flow cell was also fabricated to house stacks of the electrochemical cells to allow for capture of CO2 from flowing gas streams of compositions similar to those of flue gases, air in aircraft cabins and buildings, and in the ambient environment. The adsorption effectiveness was assessed through analysis of the breakthrough profiles.
The chemical specificity of quinones can provide near 100% purity of released CO2, which, when combined with a well-designed process in which 100% CO2 recovery is achieved, puts the technology much closer to the upper-right corner on the recovery-purity Pareto plot than those based on current CO2 sorbents.32,33
![[thin space (1/6-em)]](https://www.rsc.org/images/entities/char_2009.gif) :
:![[thin space (1/6-em)]](https://www.rsc.org/images/entities/char_2009.gif) 3, PAQ
3, PAQ![[thin space (1/6-em)]](https://www.rsc.org/images/entities/char_2009.gif) :
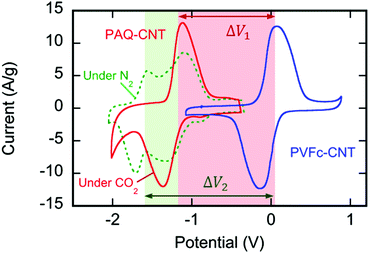
:![[thin space (1/6-em)]](https://www.rsc.org/images/entities/char_2009.gif) CNT ratio by weight (Fig. S4, ESI†). The cyclic voltammograms in Fig. 3 shown in green (under N2) and red (under CO2) indicate the strong redox activity of these electrode surfaces; the differences in the current response following potential scans are discussed later.
CNT ratio by weight (Fig. S4, ESI†). The cyclic voltammograms in Fig. 3 shown in green (under N2) and red (under CO2) indicate the strong redox activity of these electrode surfaces; the differences in the current response following potential scans are discussed later.
![[thin space (1/6-em)]](https://www.rsc.org/images/entities/char_2009.gif) :
:![[thin space (1/6-em)]](https://www.rsc.org/images/entities/char_2009.gif) 1, PVFc
1, PVFc![[thin space (1/6-em)]](https://www.rsc.org/images/entities/char_2009.gif) :
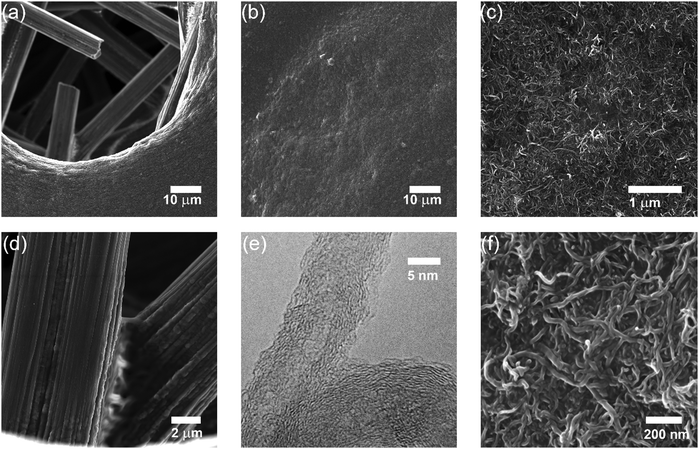
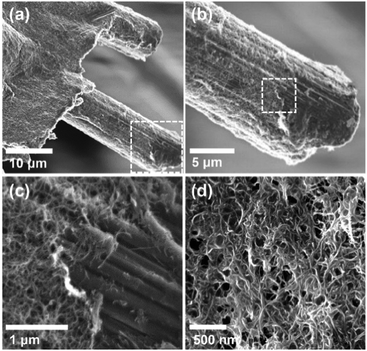
:![[thin space (1/6-em)]](https://www.rsc.org/images/entities/char_2009.gif) CNT, by weight. The electrode substrate was dip-coated in the ink and dried slowly to yield a composite that uniformly coated the substrate at ∼1.4 mg cm−2, as shown in Fig. 4. The CVs of the PVFc–CNT electrode in N2 and CO2 saturated [Bmim][TF2N] are identical, and are indicated by the blue line in Fig. 3. PVFc–CNT has a reduction potential of E0 = −0.03 V, against ferrocene (Fc).
CNT, by weight. The electrode substrate was dip-coated in the ink and dried slowly to yield a composite that uniformly coated the substrate at ∼1.4 mg cm−2, as shown in Fig. 4. The CVs of the PVFc–CNT electrode in N2 and CO2 saturated [Bmim][TF2N] are identical, and are indicated by the blue line in Fig. 3. PVFc–CNT has a reduction potential of E0 = −0.03 V, against ferrocene (Fc).
The capacities of the anode and cathodes of the cell, evaluated by gravimetric charge calibration of the two electrode composite materials (Fig. S5, ESI†), were balanced by requiring that mP14AQ–CNT = 1.12mPFVc–CNT, which allowed for some excess PVFc–CNT.
Carbon capture
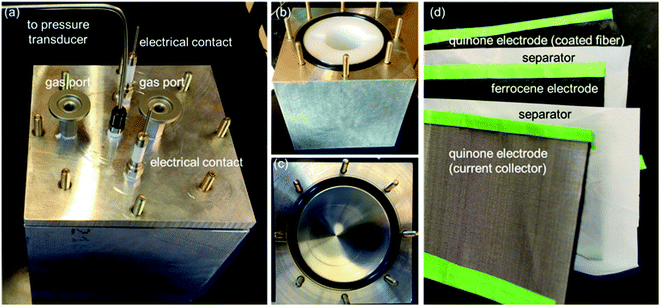
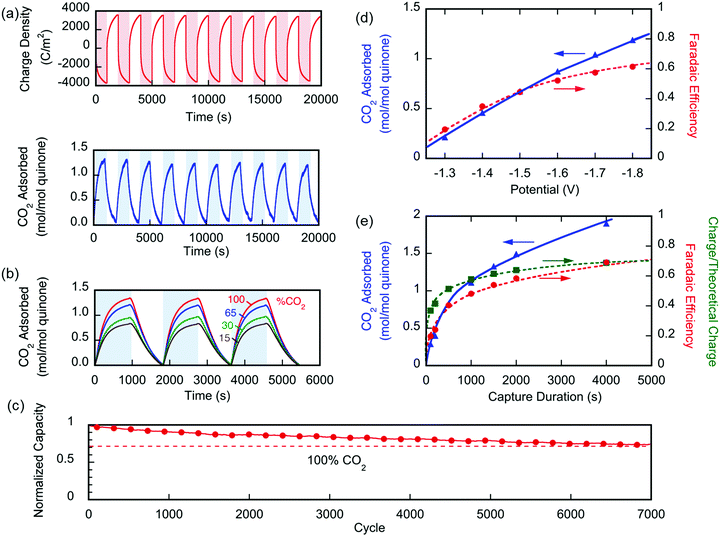
Two different types of units were fabricated to demonstrate the effectiveness of the electro-swing process. The first was a sealed chamber into which the electrodes were inserted. Changes in pressure were measured as CO2 was adsorbed and then released on cycling of the potential applied to the electrodes. The second approach used a flow adsorption in which the CO2 exiting the device was monitored, with the breakthrough point reflecting the overall capacity of the electrodes. All carbon capture experiments were conducted at T ∼ 21 °C.The performance of the electrochemical cell was evaluated in chronoamperometric (potentiostatic) experiments, with capture at 1.3 V and release at 0.5 V, i.e. ΔV = 0.8 V. Fig. 6(a) shows the change in the number of moles of CO2 captured from pure gas over 10 cycles (blue), along with the charge transferred to and from the cell (red). It shows that ∼65% of the quinone units were utilized, i.e. 7.4 μmol of CO2 captured. This may be due to incomplete charging of the quinones that are not exposed to electrolyte. From the charge transferred during charging and discharge (∼800 mC), and the moles of CO2 captured and released, a faradaic efficiency
 | (1) |
 | (2) |
Fig. 6(b) shows similar results for the capture of CO2 from gases of different concentrations ranging between 15 and 100%. Again, quinone utilization was high, but dependent on the initial gas concentration, owing not to capacity limitations, but to a reduction on sorption dynamics due to mass transfer limitations with lower concentration driving forces. The electrochemical cell showed great stability with <30% loss in capacity over 7000 cycles of capture and release, Fig. 6(c). The gradual loss in capacity is mainly due to the electromigration of the shorter polymer chains, Fig. S1 (ESI†), from the electrode and into the electrolyte, towards the opposite electrode.
In a different set of experiments where a larger cell (∼450 cm2 of total exposed area) was used, CO2 transport limitations became more prominent due to the larger internal volume of the cavity used. In this set, the effect of applying an overpotential was studied, where capture potentials of greater than ΔV1 (in Fig. 3) were applied during a 1000 s capture experiment. Fig. 6(d) shows that upon increasing the applied capture potential more CO2 is captured for the duration of the experiment, which indicates the activation of more quinone units on the electrodes during the charging half-cycle. Charging the system at −1.8 V for varying durations, Fig. 6(e), shows that the system is fully charged after 2000 s, but more CO2 is captured, i.e. more of the quinones are utilized, at increasing durations of capture. This demonstrates the transport limitations of the electrodes, as explained in later sections.
It can be shown that axial flow dispersion within individual channels was minimal at most flow rates, and that the transport resistances resided primarily within the electrodes. Imperfect packing of the cells in the flow device by hand did, in some cases, lead to significant channeling and large-scale device axial dispersion, however, with broad breakthrough curves, but it is anticipated that under optimal manufacturing conditions these effects can be reduced significantly.
The chronoamperometric experiments performed in the sealed system were repeated in a flow system. Mixtures of N2 and CO2 at different compositions were flown past the stack of assembled electrochemical cells. Upon reduction of the PAQ–CNT electrodes, CO2 was removed (captured) from the inlet stream, and the decrease in the concentration of CO2 was detected at the outlet stream. In these experiments the bed was fully activated by charging at a constant potential greater than ΔV22 to guarantee the complete reduction of the all accessible quinone units prior to adsorption. Experiments with an initial half activation, i.e., at ΔV1, followed by adsorption at constant potential, did not result in different breakthrough curves, mainly because the kinetics of the reduction and the adsorption reactions are much faster than the rates of mass transfer of CO2 into the film, as discussed later.
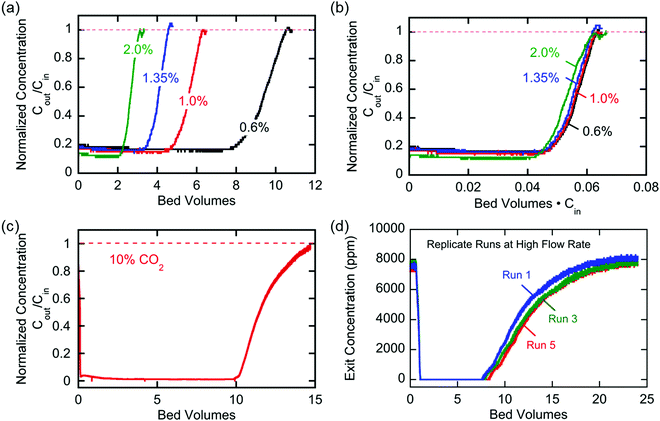
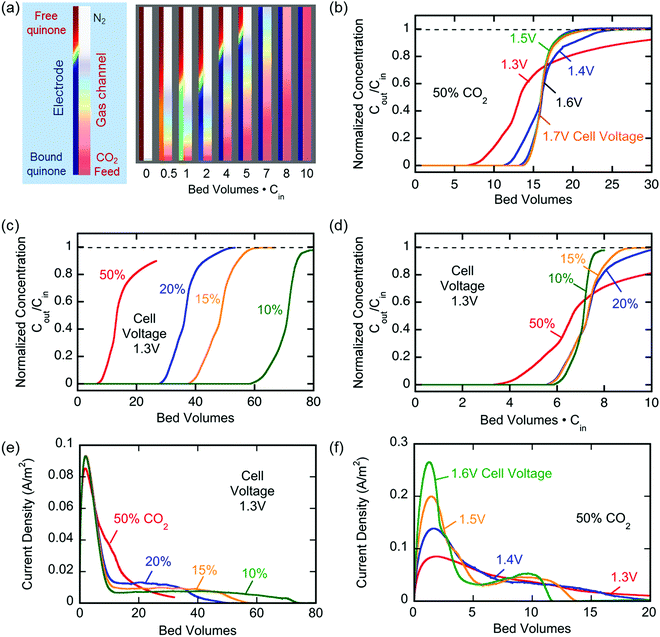
The breakthrough profiles obtained for one flow system are shown in Fig. 8(a). Breakthrough was achieved at smaller bed volumes of gas treated for higher feed CO2 concentrations, where the bed volume is a time measure which represents the total volume of gas treated at any given time relative to the volume of the bed itself. The breakthrough curves superimpose when normalized by the inlet CO2 concentration, shown in Fig. 8(b), which indicates a consistent behavior of the bed, i.e. equal utilization of the overall adsorption capacity regardless of the inlet concentration, an indication of a rectangular equilibrium isotherm. Note in this particular module that, although the breakthrough curves themselves were sharp, prior to breakthrough there was a consistent effluent concentration of 20% of the feed concentration, the result of a bypassing of the active cells by 20% of the total gas flow. The overall capacity of the bed can be calculated from the area between the line at Cout/Cin = 1 and the normalized breakthrough curve. A contactor bed of a desired overall capacity can be designed by linear scaling from this overall capacity. With a larger bed, CO2 was fully captured from a stream at 10% inlet concentration, which is on the higher end for carbon capture applications as it mimics combustion exhaust. Up to 10 bed volumes of feed were treated before breakthrough was achieved, indicating capacity of greater than one bed volume of pure CO2. It has similarly been shown that complete removal of CO2 with a smaller stack of cells (a scaled down contactor), five replicate capture experiments were conducted on an inlet stream of ∼0.8% CO2, Fig. 8(d), which mimics conditions for ventilation of confined living spaces, such as space modules, submarines and buildings. The breakthrough curves were unaffected by the prior history of the bed, indicating that complete regeneration and restoration of the bed capacity was attained during the desorption following each adsorption run.
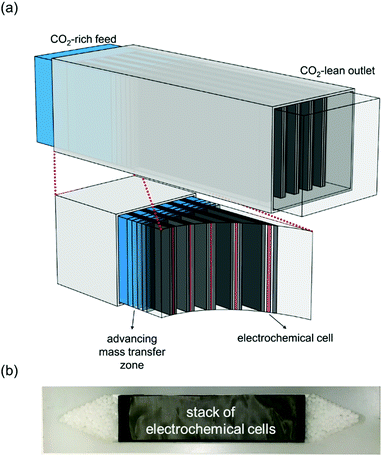
The broadness of the breakthrough profiles in Fig. 8(c) and (d) can be attributed to the variation in channel width. Since the electrochemical cell stacks are hand-assembled and fitted into the bed, some variation in channel width along the same channel and the parallel channels can cause an uneven distribution of flow resulting in overlapping of multiple breakthrough profiles, which culminate in a broad overall profile. Also, mass-transfer dispersion plays a significant role in the broadness of the profiles. As is evident from the long durations for an effective capture in Fig. 6(e), and discussed later, mass transfer of CO2 into the electrodes is the rate controlling step, and this causes axial dispersion that widens the mass transfer zone in the channel, illustrated in Fig. 7(a), resulting in broad breakthrough profiles in this case.
Mechanism of CO2 capture
Mizen and Wrighton first demonstrated the reductive addition of CO2 to 9,10-phenanthrenequinone in aprotic electrolytes. Quinones undergo two reversible one-electron reductions in aprotic electrolytes, at two reduction potentials, as shown in Scheme 1(a) for anthraquinone. But in the presence of CO2, a single two-electron quasi-reversible reduction takes place at the first reduction potential, as shown in Scheme 1(b), where the CO2 molecule carboxylates the quinone resulting in a carbonate salt.37 Upon the first reduction of a quinone molecule, a semiquinone radical anion is produced. Some semiquinones, with sufficient electron density, i.e. sufficient Lewis base strength, can react with CO2 in a nucleophilic addition to form a carbonate salt. Semiquinones with lower electron density – due to attached electron withdrawing groups – do not have the nucleophilic strength to react with CO2.38 A semiquinone carboxylated by the reductive addition of CO2 has its negative charge isolated from the rest of the molecule by a σ-bond, rendering the carboxylated quinone aromatic ring(s) relatively neutral. Hence, the two-electron reduction of the parent quinone under CO2 occurs at the first reduction potential. The second reduction generates another nucleophilic center, i.e. the second oxygen of the quinone, which reacts with a second CO2 molecule to form a bis(carbonate) dianion salt – the quinol dianion diadduct. A similar behavior is observed when quinones are reduced in protic electrolyte media and the reduced quinones react with protons to form two hydroxyl groups via a two-electron reduction.39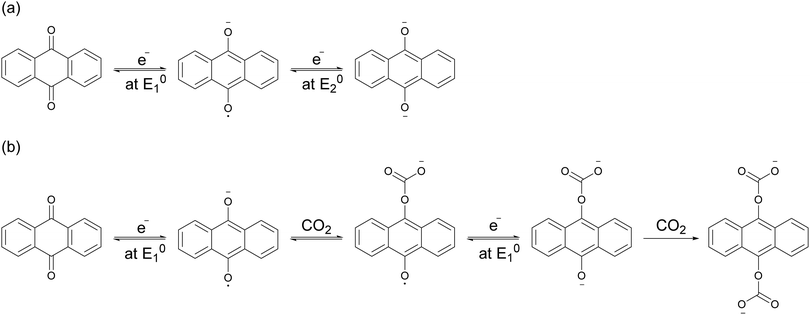 | ||
| Scheme 1 (a) Two single-electron reduction waves of anthraquinone in the absence of electrophiles. (b) One two-electron reduction wave of anthraquinone in the presence of CO2. | ||
The nucleophilic addition reaction of reduced quinones occurs only with electrophiles with sufficient Lewis acidity, such as CO2, and not N2, hence the great selectivity in adsorption. Furthermore, water, in the treated gas stream, has minimal effect on carbon capture, mainly because the hydrophobicity of the IL used presents a considerable mass transfer resistance for water with very little retention,40 and any residual water in the IL phase merely stabilizes the reduced quinones,41 with no significant change to the electrochemical or chemical steps of the carbon capture process.20 While the presence of oxygen can cause the oxidation of some reduced quinones with a sufficiently negative reduction potential, through the formation of the superoxide radical anion O2˙−, it is possible to avoid any reactions with oxygen in the feed stream by carefully tuning the electron density of the quinone polymer.42
The cyclic voltammogram (CV) of the PAQ–CNT composite on the electrode substrate in [Bmim][TF2N] saturated with N2, the green line in Fig. 3, shows two redox couples corresponding to the two reduction potentials of anthraquinone. The cathodic and anodic peaks, however, are broader than those reported for solutions of quinone molecules in electrolytes,20 which can be ascribed to the slower electron exchange between differently-reduced redox units, i.e. neutral quinone, semiquinone (radical anion) and quinol dianion, along the π-conjugated backbone of the polymer,43 and also to the diffusion and electromigration of electrolytic species into and out of the porous PAQ–CNT film.44 The expected disappearance of the second redox couple of the CV under CO2 was observed, as shown by the red line in Fig. 3, and attributed to the carboxylation of the reduced quinone units along the polymer chain facilitating the second electron reduction of anthraquinone at the first reduction potential, with the consequent increase in the current at that potential. The PAQ–CNT electrode can therefore be used to remove CO2 selectively from a gas mixture via nucleophilic addition, and regenerated via an electrochemical oxidation, with release of the CO2, as shown earlier. The two reduction potentials under N2 are E01 = −1.21 V and E02 = −1.63 V, vs. Fc. Under CO2 these two potentials coalesce to yield a single quasi-reversible redox couple at the first reduction potential observed under N2, i.e. E01.
The separation of the oxidation and reduction peaks in the CVs reported is large, indicating sluggish electron transfer to the quinone repeat units on the polymer, and a thick diffusion layer in the porous electrode.44 While the ratio of polymer to CNT was optimized for the greatest gravimetric capacity, it is not the ideal ratio for conductivity. Some of the conductivity takes place through the backbone of the polymer, which contributes to the slow electron transfer. This, however, does not present a problem in the design of the contactor separation unit, since the rate limiting step in the CO2 capture process is the transport of CO2 and not electron transfer.
The double carboxylation (CO2 addition) of anthraquinone to form the bis(carbonate) dianion follows an ECEC mechanism, as shown in Scheme 2(a). During a constant-current charging of the cell in the presence of a flux of CO2 towards the quinone units equal to, or higher than, the rate of the electrochemical reduction of the quinones, both of the reduction electrochemical reactions take place at the first reduction potential, E01. The molar flux of CO2, NCO2, towards the electrode (moles per unit area per second) should match the current density, J, at the electrode (charge per unit area per second), as in,
 | (3) |
CO2 deprivation was not a problem in the highly saturated electrolyte in the CV electrochemical characterizations, where the concentration of CO2 in the electrolyte was about 20 times higher than that of the quinones on the electrode. However, in an adsorption system, where the electrolyte is not saturated with CO2 there needs to be a careful balance between the advective and diffusive fluxes of CO2 towards the anthraquinone cathodes for reductive addition, and the rate of the reduction of anthraquinone. This can be better controlled by charging the cell, i.e. reducing the anthraquinone, at a constant potential that is sufficient to drive the first reduction of anthraquinone but not the second, i.e. charging the cell at a potential difference that is between ΔV1 and ΔV2. With operation at this constant potential, the flux of CO2 does not affect the energy of binding, since the second electron is acquired by a semiquinone at the first reduction potential, but only after the first CO2 addition occurs; following this second reduction, a second CO2 molecule can bind to the dianion monoadduct. When the first reduction is allowed in a CO2-lean environment at a constant potential, the current observed after the initial surge, which results from the first reduction, is proportional to the flux of CO2 towards the anthraquinone electrode. Nevertheless, this current ultimately diminishes due to the decrease in the number of semiquinones available to react with CO2. In a CO2-rich environment, at constant potential charging, the observed current after the initial surge is proportional to the transport of CO2 into the electrode and the rate of the addition reaction which follows the nucleophilic addition mechanism between semiquinones and dissolved CO2,
| R = kCQ˙−CCO2,IL | (4) |
 | (5) |
Modeling of CO2 capture
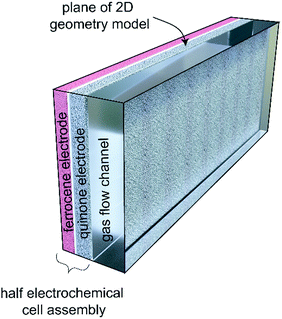
To further understand the behavior of the cell during constant-current and constant-potential charging at various CO2 concentrations, a two-dimensional model of the cell and the adjacent gap was set up in COMSOL®, with the geometry shown in Fig. 9. The model accounted for all the chemical and electrochemical reactions described in Scheme 2, in addition to the electrochemical oxidation of the ferrocene. The equilibrium potentials of all electrochemical reactions were predicted by the Nernst equation | (6) |
 | (7) |
| i0 = k0[red]α[ox](1−α) | (8) |
 | (9) |
| Ni = −Di∇Ci − ziuiFCi∇Φ | (10) |
 | (11) |
 | (12) |
In the sealed system, CO2 transport occurs via diffusion toward the electrode only, while in flow CO2 is also advected down the channel. In the sealed system, the partial pressure of the gas decreases during capture, while in flow the CO2 concentration changes along the gas channel with time, and the concentration of the gas leaving the device is a measure of the total effectiveness of the adsorption bed capacity and transport and kinetic limitations within the system. The total transport of CO2 is modelled by transport equations in each of the two phases, gas and IL. In the gas phase, the mass transfer governing equation in the sealed system is given by
 | (13) |
 | (14) |
 | (15) |
 | (16) |
 | (17) |
| CCO2,IL = βCCO2,gas | (18) |
The purpose of this simulation is to obtain a semi-quantitative analysis of the behavior of the cell under different conditions, and, therefore, order of magnitude estimates are made for the electrochemical parameters of the model.
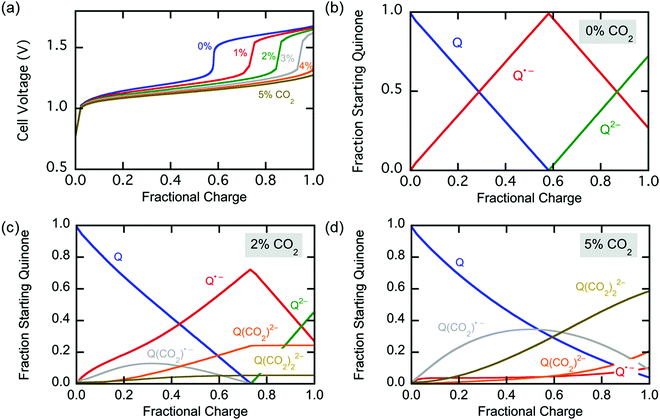
Hence, the optimum charging method of the cell, i.e. CO2 capture, is to operate at a constant potential just larger than the first potential window ΔV1. The greater the charging voltage, the faster the reduction reaction due to the larger overpotential. For practical reasons, and to avoid large current surges, the cell can be charged at a constant current until the desired charging potential difference is reached. This will be between ΔV1 and ΔV2 based on the rate of charging desired. At this point the bed is activated for capture by making half the total capture capacity available. Then the cell can be set at that constant potential until saturation of the cathodes is achieved. The second half of the capture capacity is made available as more CO2 flows in.
It is also possible to fully activate the bed by charging at a potential difference ΔVHigh > ΔV1, at which point the cells are disconnected and allowed to saturate with no further supply of current, until breakthrough is achieved, and the bed is regenerated by discharging the cell and releasing pure CO2. The energy recovered however, cannot exceed QΔV1, resulting in an energy loss of greater than Q(ΔVHigh − ΔV1).
Fig. 11(e) and (f) show the current across the electrochemical cell during the capture experiments in (c) and (b) respectively. Fig. 11(e) shows that at low potential charging, i.e. 1.3 V, an initial spike in current is observed which results from the reduction of the quinones on the electrodes to semiquinone, as explained earlier. This is followed by a region of constant current which is proportional to the flux of CO2 into the electrodes, since it reacts with the semiquinones and allows them to accept a second electron at the low potential. As the electrodes become saturated and all the semiquinone is depleted, the current decreases. This region of constant current followed by the sharp decrease is very broad for the 10% case, but much shorter for the 50% case, where there is a brief transition from the initial spike to the decreasing current region manifested in a shoulder. However, Fig. 11(f) shows that as the applied capture potential increases, the current profile for the same inlet concentration changes dramatically. This is elucidated in Scheme 3; as the applied potential approaches ΔV2, all of the quinone is reduced to semiquinone and a Nernstian distribution of semiquinone and quinol dianion is generated, evident by the increasing current in the first peak.
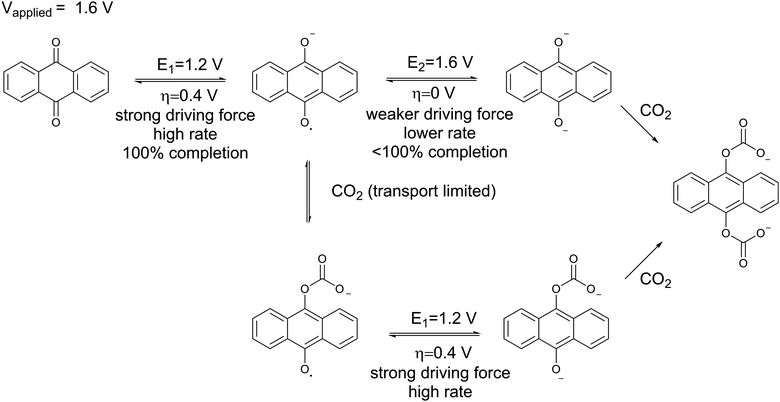 | ||
| Scheme 3 The reduction of anthraquinone at a potential higher than its second reduction potential with a limited flux of CO2. | ||
Thus, CO2 reacts with the Nernstian mixture of semiquinone and quinol dianion, where in the case of the latter no further reaction, chemical or electrochemical, occurs, but in the case of the former a semiquinone monoadduct species is formed, which can be reduced to the dianion monoadduct at ΔV1. Therefore, the applied potential presents a large overpotential for this reaction, hence the second increase in the current which corresponds to the electron transfer for this reduction. Following these steps, all the quinone moieties in the electrodes are in their doubly charged states and no further electron transfer occurs. This double peak behavior of the current is the result of the balance between the rate of electron transfer and the flux of CO2, which relates to the earlier discussions. At charging potentials higher than ΔV2e.g. ΔVHigh, not shown here, a larger first peak is expected where all the quinone is converted to semiquinone then dianion, i.e. two consecutive single-electron reductions, after which the current drops to zero and only chemical addition reactions occur, Scheme 2(b).
Energetic analysis of CO2 release
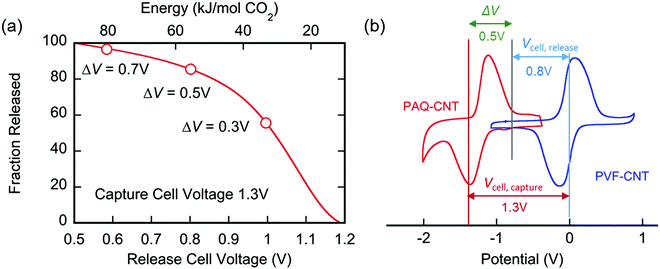
The applied release potential determines the energy recovered from the cell upon the release of CO2, and must, therefore, be selected carefully. While quinones under N2 are expected to be reduced and oxidized reversibly without any significant loss of energy, in an electrophile-rich environment, such as CO2, the reduction is only quasi-reversible due to the energetic penalty of breaking a bond formed with CO2. Therefore, some of the energy is lost in the process, and it is imperative to minimize this loss, since it is directly related to energy per mole of CO2 concentrated (captured and released) in a CO2 capture process. The last step in the CO2 capture, Scheme 1(b), i.e. the addition of a second molecule of CO2 to the semiquinone monoadduct to form a dianion diadduct, is chemically irreversible for the duration of the cycle,37 and the release reaction takes place via an electrochemical oxidation of the diadduct. This oxidation occurs at a more positive potential than the first reduction potential E01. Thus, the more positive the release potential, the larger the overpotential and the faster and more complete is the release of the bound CO2. However, a more positive release voltage corresponds to less energy recovered during discharge, and thus more work done per cycle of capture and release, which is given by eqn (2).Consequently, to reduce energy losses per cycle, a less positive potential can be used in a constant potential discharge. While the capture cell voltage can be maintained at fairly minimal levels by setting it close to ΔV1, with some diminishment in rate, release at high cell voltages can result in a partial release of CO2, due to the partial oxidation of the bis(carbonate) quinone units (dianion diadduct units), and a subsequent underutilization of anthraquinone. After a few cycles of capture and release at a higher potential, a constant equilibrium rate of utilization of anthraquinone is achieved. This is akin to the working capacity of a pressure-swing adsorption system.45 Thus partial release can be achieved at higher cell discharge potentials as shown in Fig. 12. This allows for a much smaller window of operation, which at the ∼90% faradaic efficiency reported earlier, an energy use of ∼43 kJ mol−1, with 60% utilization of accessible quinone is possible. This is on par with other carbon capture systems in efficiency and energy consumption,46,47 including thermal swing systems.48
Solid sorbent materials used in carbon capture applications have enthalpies of CO2 adsorption of the same order, e.g., Metal–Organic Frameworks (MOFs) with 30–50 kJ mol−1 for some types of MOF-74,49 and ∼100 kJ mol−1 for some amine functionalized MOFs,50 or zeolites, such as 13X at 40 kJ mol−1.51 However, these are not process energetics but rather enthalpies of adsorption. Therefore, processes which are designed to utilize these materials incur greater energetic penalties associated with the techniques used for delivering the energy for desorption, i.e. heat and pressure change, whereas the energetics reported herein correspond to that of the process, which unlike those utilizing solid sorbents, has a binary affinity for CO2.
Moreover, if a precise rate of release is desired, the cell can be discharged at a constant current. In this case, the flux of the released CO2 is proportional to the current density, as given by eqn (3). The discharge current and time, control the charge transferred, which is the extensive variable in the work of the process. This method of release is seldom utilized in swing adsorption processes, because it is the intensive, rather than the extensive variable, that is modulated, e.g., temperature in thermal swing, pressure in pressure swing, and, here, potential. Nevertheless, this can be useful for fast regeneration of the bed at high currents, where long periods of capture and short periods of release are desired. But due to the incomplete discharge of the electrochemical cells, in analogy with high current discharge of batteries,30 the bed will only be partially regenerated.
Swing operations
The electro-swing adsorption (ESA) technology developed in this work has a number of perceived advantages over other swing technologies such as temperature- (TSA) and pressure-swing (PSA) adsorption in terms of both its mode of operation and its thermodynamic adsorption characteristics, as illustrated in Fig. 13. Temperature-swing operations require heating and cooling of the entire adsorption matrix to release the adsorbed compounds, rather than just targeting the adsorption sites themselves, which introduces many thermal inefficiencies to the operation. The heating is typically accomplished with high-temperature steam as the sweep gas, with subsequent condensation of the steam to recover the pure CO2 product stream, whereas cooling is achieved during the blowdown phase in preparation for the next sorption cycle. With pressure-swing operations, the release of the captured material occurs on reduction of the adsorbate partial pressure in the sweep to reverse the mass transfer driving force, which can be achieved either by drawing a vacuum on the bed, or by using low pressure steam as the sweep gas. The product leaving the bed is dilute, and requires a second separation step, such as the condensation of steam, and external compression of the resulting CO2 to bring it to the desired pressures for subsequent utilization or for transportation and subsurface sequestration in geologic formations. Moreover, in both TSA and PSA operations, the working capacity is strongly dependent on the shape of the Langmuir- (or Freundlich-) type isotherm, with significantly lower capacities at lower concentrations, which limits the degree of regeneration of the adsorbent, or the partial pressure of the recovered adsorbate in the sweep stream. The electro-swing adsorbents, on the other hand, are characterized by a rectangular adsorption isotherm in which the saturation loading capacity in the activated state is independent of the gas phase concentration, so the adsorbent is equally effective over a wide range of feed concentrations from ambient conditions through to those characteristic of large scale power and industrial facilities. When deactivated, the adsorbent has negligible capacity for the CO2 even at high CO2 gas phase concentrations such that the working capacity of the adsorbent is independent of operating conditions. Thus, the sweep stream during the desorption process can be pure CO2 at the desired pressure, subject primarily to equipment design constraints, which greatly simplifies the adsorption/desorption cycle relative to those of the TSA and PSA processes. The results in Fig. 6(a) show that release into a pure CO2 gas environment is facile and fast, and complete if sufficient time is allowed to account for the kinetics of the process.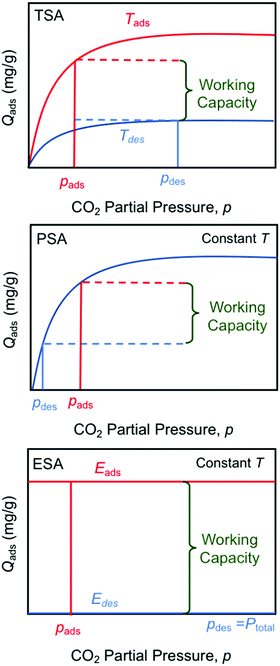 | ||
| Fig. 13 Comparison of temperature- (TSA), pressure- (PSA) and electro- (ESA) swing operations showing the impact of sorption isotherms on total working capacity. | ||
Conclusions
The electro-swing operations outlined in this paper offer a new approach to the exploitation of electrochemically mediated complexation of CO2 with redox-active species for the mitigation of CO2 emissions, and for control of CO2 levels in confined environments. Electro-swing adsorption has been shown to be equally effective, at a constant capacity, for the capture of CO2 at concentrations typical of fossil fuel combustion flue gases (∼10%) and in confined ambient environments (0.6–0.8%). These advances have been made possible by the development of new electrode materials in which redox-active moieties, such as quinones, that can bind CO2 in one oxidation state but not in another are immobilized onto the electrode substrates. These functionalized electrodes were incorporated into an electrochemical cell assembly to facilitate their cyclical electrochemical reduction and oxidation. The cells demonstrated exceptional capture and release of CO2 over more than 7000 cycles at 60–70% quinone utilization, 90% faradaic efficiency, and 90 kJ mol−1 at 100% bed utilization and 43 kJ mol−1 at 60%. A significant advantage of the quinone-functionalized electrodes is that they have a CO2 capacity that is essentially independent of the inlet feed concentration, in contrast to the capacities of sorbents typically used in PSA or TSA operations, where Langmuir-type equilibria limit capacity at lower concentrations.The strong performance of the electro-swing process allows for numerous applications where CO2 removal and/or storage is of interest. The ESA device can be easily integrated into processes in a plug-and-play fashion due to its simple design, and minimum requirement for ancillary equipment, primarily a regulated power source and sink (load). An initial techno-economic analysis (not reported here) shows that such carbon capture systems can be economically feasible with costs ranging from $50–$100 per tonne CO2 depending on the feed concentrations and applications under consideration.
It is projected that further optimization of the ESA process can be obtained through refinement of the electrode chemistries and their assembly into compact adsorption devices to address a wide range of CO2 mitigation strategies.
Experimental
Materials
Dichloro-1,4-anthraquinone (>98%) and 2,2′-bipyridyl (>99%) were purchased from TCI America. Bis(1,5-cyclooctadiene)nickel(0), 1,5-cyclooctadiene (>99%), MWCNT (>98%, O.D. × L 6–13 nm × 2.5–20 μm), anhydrous N,N-dimethylformamide (DMF, >99.5%) and N-methyl-2-pyrrolidinone (NMP, >98%) were purchased from Sigma-Aldrich. Poly(vinylferrocene) (PVFc, MW ∼ 50![[thin space (1/6-em)]](https://www.rsc.org/images/entities/char_2009.gif) 000 g mol−1) was purchased from Polysciences, Inc. 1-Butyl-3-methylimidazolium bis(trifluoromethylsulfonyl)imide (>99%) was purchased from IOLITEC, Ionic Liquids Technologies GmbH. Bone dry 3.0 grade carbon dioxide and industrial grade nitrogen gases were purchased from Airgas. Non-woven carbon mat (34 g m−2) was purchased from Marktek, Inc. Whatman-2 filter paper was purchased from General Electric – Health. Celgard battery separator was purchased from Celgard. Stainless steel (SS) mesh (316, 500 × 500) was purchased from Gerard Daniel International. DMF was dried over 3 Å molecular sieves over three stages and purged with N2 for 12 h. All other reagents were used without further modification.
000 g mol−1) was purchased from Polysciences, Inc. 1-Butyl-3-methylimidazolium bis(trifluoromethylsulfonyl)imide (>99%) was purchased from IOLITEC, Ionic Liquids Technologies GmbH. Bone dry 3.0 grade carbon dioxide and industrial grade nitrogen gases were purchased from Airgas. Non-woven carbon mat (34 g m−2) was purchased from Marktek, Inc. Whatman-2 filter paper was purchased from General Electric – Health. Celgard battery separator was purchased from Celgard. Stainless steel (SS) mesh (316, 500 × 500) was purchased from Gerard Daniel International. DMF was dried over 3 Å molecular sieves over three stages and purged with N2 for 12 h. All other reagents were used without further modification.
Methods
Conflicts of interest
There are no conflicts to declare.Acknowledgements
This work was supported by an MIT Energy Initiative Seed Fund grant, and by Eni Eni S.p.A. We thank Jonathan Thomas and Ziad Mansour for their assistance in coating and assembly of electrodes, and Michael J. Tarkanian and Mark Belanger for their guidance and help with the fabrication of the adsorption beds. This work made use of the DMSE microscopy facility and machine shop, and the Edgerton Student Shop at MIT.References
- F. Giorgi, P. H. Whetton, R. G. Jones, J. H. Christensen, L. O. Mearns, B. Hewitson, H. vonStorch, R. Francisco and C. Jack, Geophys. Res. Lett., 2001, 28, 3317–3320 CrossRef
.
- W. Cai, A. Santoso, G. Wang, S.-W. Yeh, S.-I. An, K. M. Cobb, M. Collins, E. Guilyardi, F.-F. Jin, J.-S. Kug, M. Lengaigne, M. J. McPhaden, K. Takahashi, A. Timmermann, G. Vecchi, M. Watanabe and L. Wu, Nat. Clim. Change, 2015, 5, 849–859 CrossRef
.
- J. Tollefson and K. R. Weiss, Nature, 2015, 528, 315–316 CrossRef CAS PubMed
.
- M. E. Boot-Handford, J. C. Abanades, E. J. Anthony, M. J. Blunt, S. Brandani, N. Mac Dowell, J. R. Fernández, M. C. Ferrari, R. Gross, J. P. Hallett, R. S. Haszeldine, P. Heptonstall, A. Lyngfelt, Z. Makuch, E. Mangano, R. T. J. Porter, M. Pourkashanian, G. T. Rochelle, N. Shah, J. G. Yao and P. S. Fennell, Energy Environ. Sci., 2014, 7, 130–189 RSC
.
- G. T. Rochelle, Science, 2009, 325, 1652–1654 CrossRef CAS PubMed
.
- F. L. Horn and M. Steinberg, Fuel, 1982, 61, 415–422 CrossRef CAS
.
- J. Wang, L. Huang, R. Yang, Z. Zhang, J. Wu, Y. Gao, Q. Wang, D. O’Hare and Z. Zhong, Energy Environ. Sci., 2014, 7, 3478–3518 RSC
.
- A. Brunetti, F. Scura, G. Barbieri and E. Drioli, J. Membr. Sci., 2010, 359, 115–125 CrossRef CAS
.
- United States Environmental Protection Agency, Inventory of U.S. Greenhouse Gas Emissions and Sinks: 1990–2016, 2018.
- ASHRAE, ASHRAE 62.1-2016, Ventilation for Acceptable Indoor Air Quality, 2016.
- J. Winnick, H. Toghiani and P. D. Quattrone, AIChE J., 1982, 28, 103–111 CrossRef CAS
.
- S. Choi, M. L. Gray and C. W. Jones, ChemSusChem, 2011, 4, 628–635 CrossRef CAS PubMed
.
- M. C. Stern, F. Simeon, H. Herzog and T. A. Hatton, Energy Environ. Sci., 2013, 6, 2505 RSC
.
- W. J. Ward, Nature, 1970, 227, 162–163 CrossRef CAS PubMed
.
- N. Jemaa, H. J. Walls, R. D. Noble, D. E. Wedman and C. A. Koval, AIChE J., 1993, 39, 867–875 CrossRef CAS
.
- P. A. Terry, R. D. Noble, D. Swanson and C. A. Koval, AIChE J., 1997, 43, 1709–1716 CrossRef CAS
.
- W. L. Bell, A. Miedaner, J. C. Smart, D. L. DuBois and C. E. Verostko, J. Aerosp., 1988, 97, 544–552 Search PubMed
.
-
D. L. DuBois, A. Miedaner, W. Bell and J. C. Smart, Electrochemical and Electrocatalytic Reactions of Carbon Dioxide, Elsevier, 1993 Search PubMed
.
- P. R. Scovazzo, J. Electrochem. Soc., 2003, 150, D91–D98 CrossRef CAS
.
- B. Gurkan, F. Simeon and T. A. Hatton, ACS Sustainable Chem. Eng., 2015, 3, 1394–1405 CrossRef CAS
.
- R. Ranjan, J. Olson, P. Singh, E. D. Lorance, D.
A. Buttry and I. R. Gould, J. Phys. Chem. Lett., 2015, 6, 4943–4946 CrossRef CAS PubMed
.
- P. Singh, J. H. Rheinhardt, J. Z. Olson, P. Tarakeshwar, V. Mujica and D. A. Buttry, J. Am. Chem. Soc., 2017, 139, 1033–1036 CrossRef CAS PubMed
.
- J. H. Rheinhardt, P. Singh, P. Tarakeshwar and D. A. Buttry, ACS Energy Lett., 2017, 2, 454–461 CrossRef CAS
.
- P. Xiao, J. Zhang, P. Webley, G. Li, R. Singh and R. Todd, Adsorption, 2008, 14, 575–582 CrossRef CAS
.
- T. Harada, F. Simeon, E. Z. Hamad and T. A. Hatton, Chem. Mater., 2015, 27, 1943–1949 CrossRef CAS
.
-
D. H. Apaydin, E. D. Głowacki, E. Portenkirchner and N. S. Sariciftci, Angew. Chem., Int. Ed., 2014, 53, 6819–6822 Search PubMed
.
- Z. Song and H. Zhou, Energy Environ. Sci., 2013, 6, 2280 RSC
.
- Z. Song, Y. Qian, M. L. Gordin, D. Tang, T. Xu, M. Otani, H. Zhan, H. Zhou and D. Wang, Angew. Chem., 2015, 127, 14153–14157 CrossRef
.
- Y. Zhou, B. Wang, C. Liu, N. Han, X. Xu, F. Zhao, J. Fan and Y. Li, Nano Energy, 2015, 15, 654–661 CrossRef CAS
.
- S. Muench, A. Wild, C. Friebe, B. Häupler, T. Janoschka and U. S. Schubert, Chem. Rev., 2016, 116, 9438–9484 CrossRef CAS PubMed
.
- D. S. Achilleos and T. A. Hatton, ACS Appl. Mater. Interfaces, 2016, 8, 32743–32753 CrossRef CAS PubMed
.
- M. Hefti, L. Joss, Z. Bjelobrk and M. Mazzotti, Faraday Discuss., 2016, 192, 153–179 RSC
.
- L. Riboldi and O. Bolland, Int. J. Greenhouse Gas Control, 2015, 39, 1–16 CrossRef CAS
.
- X. Mao, F. Simeon, D. S. Achilleos, G. C. Rutledge and T. A. Hatton, J. Mater. Chem. A, 2013, 1, 13120 RSC
.
- T. Brousse, D. Belanger and J. W. Long, J. Electrochem. Soc., 2015, 162, A5185–A5189 CrossRef CAS
.
- A. Ntiamoah, J. Ling, P. Xiao, P. A. Webley and Y. Zhai, Ind. Eng. Chem. Res., 2016, 55, 703–713 CrossRef CAS
.
- M. B. Mizen and M. S. Wrighton, J. Electrochem. Soc., 1989, 136, 941 CrossRef CAS
.
- T. Nagaoka, N. Nishii, K. Fujii and K. Ogura, J. Electroanal. Chem., 1992, 322, 383–389 CrossRef CAS
.
- P. S. Guin, S. Das and P. C. Mandal, Int. J. Electrochem., 2011, 2011, 1–22 CrossRef
.
- P. Bonĥte, A. P. Dias, N. Papageorgiou, K. Kalyanasundaram and M. Grätzel, Inorg. Chem., 1996, 35, 1168–1178 CrossRef PubMed
.
- P. A. Staley, E. M. Lopez, L. A. Clare and D. K. Smith, J. Phys. Chem. C, 2015, 119, 20319–20327 CrossRef CAS
.
- Q. Li, C. Batchelor-McAuley, N. S. Lawrence, R. S. Hartshorne and R. G. Compton, ChemPhysChem, 2011, 12, 1255–1257 CrossRef CAS PubMed
.
- T. Yamamoto and H. Etori, Macromolecules, 1995, 28, 3371–3379 CrossRef CAS
.
- R. G. C. Ian Streeter, G. G. Wildgoose and L. Shao, Sens. Actuators, B, 2008, 133, 462–466 CrossRef
.
-
D. M. Douglas, M. Ruthven, S. Farooq and K. S. Knaebel, Pressure swing adsorption, VCH Publishers, 1994 Search PubMed
.
- M. C. Stern, F. Simeon, H. Herzog and T. A. Hatton, Energy Procedia, 2013, 37, 1172–1179 CrossRef CAS
.
- M. C. Stern and T. A. Hatton, RSC Adv., 2014, 4, 5906 RSC
.
- A. Ntiamoah, J. Ling, P. Xiao, P. A. Webley and Y. Zhai, Ind. Eng. Chem. Res., 2016, 55, 703–713 CrossRef CAS
.
- M. Ding, R. W. Flaig, H.-L. Jiang and O. M. Yaghi, Chem. Soc. Rev., 2019, 48, 2783–2828 RSC
.
- T. M. McDonald, J. A. Mason, X. Kong, E. D. Bloch, D. Gygi, A. Dani, V. Crocellà, F. Giordanino, S. O. Odoh, W. S. Drisdell, B. Vlaisavljevich, A. L. Dzubak, R. Poloni, S. K. Schnell, N. Planas, K. Lee, T. Pascal, L. F. Wan, D. Prendergast, J. B. Neaton, B. Smit, J. B. Kortright, L. Gagliardi, S. Bordiga, J. A. Reimer and J. R. Long, Nature, 2015, 519, 303–308 CrossRef CAS PubMed
.
- J. S. Lee, J. H. Kim, J. T. Kim, J. K. Suh, J. M. Lee and C. H. Lee, J. Chem. Eng. Data, 2002, 47, 1237–1242 CrossRef CAS
.
Footnote |
| † Electronic supplementary information (ESI) available. See DOI: 10.1039/c9ee02412c |
| This journal is © The Royal Society of Chemistry 2019 |

