
 Open Access Article
 This Open Access Article is licensed under a Creative Commons Attribution-Non Commercial 3.0 Unported Licence
Degradation of iridium oxides via oxygen evolution from the lattice: correlating atomic scale structure with reaction mechanisms†
Olga
Kasian‡
 *abc,
Simon
Geiger‡§
b,
Tong
Li
bd,
Jan-Philipp
Grote
b,
Kevin
Schweinar
b,
Siyuan
Zhang
b,
Christina
Scheu
b,
Dierk
Raabe
b,
Serhiy
Cherevko
e,
Baptiste
Gault
*bf and
Karl J. J.
Mayrhofer
*beg
*abc,
Simon
Geiger‡§
b,
Tong
Li
bd,
Jan-Philipp
Grote
b,
Kevin
Schweinar
b,
Siyuan
Zhang
b,
Christina
Scheu
b,
Dierk
Raabe
b,
Serhiy
Cherevko
e,
Baptiste
Gault
*bf and
Karl J. J.
Mayrhofer
*beg
aHelmholtz-Zentrum Berlin GmbH, Helmholtz-Institute Erlangen-Nürnberg, 14109 Berlin, Germany. E-mail: olga.kasian@helmholtz-berlin.de
bMax-Planck-Institut für Eisenforschung GmbH, 40237 Düsseldorf, Germany. E-mail: b.gault@mpie.de
cDepartment of Materials Science and Engineering, Friedrich-Alexander-Universität Erlangen-Nürnberg, 91058 Erlangen, Germany
dInstitute for Materials & Zentrum für Grenzflächendominierte Höchstleistungswerkstoffe (ZGH), Ruhr-Universität Bochum, 44780 Bochum, Germany
eHelmholtz-Institute Erlangen-Nürnberg for Renewable Energy (IEK-11), Forschungszentrum Jülich GmbH, 91058 Erlangen, Germany. E-mail: k.mayrhofer@fz-juelich.de
fDepartment of Materials, Royal School of Mines, Imperial College, Prince Consort Road, London, SW7 2BP, UK
gDepartment of Chemical and Biological Engineering, Friedrich-Alexander-Universität Erlangen-Nürnberg, 91058 Erlangen, Germany
First published on 18th October 2019
Abstract
Understanding the fundamentals of iridium degradation during the oxygen evolution reaction is of importance for the development of efficient and durable water electrolysis systems. The degradation mechanism is complex and it is under intense discussion whether the oxygen molecule can be directly released from the oxide lattice. Here, we define the extent of lattice oxygen participation in the oxygen evolution and associated degradation of rutile and hydrous iridium oxide catalysts, and correlate this mechanism with the atomic-scale structures of the catalytic surfaces. We combine isotope labelling with atom probe tomography, online electrochemical and inductively coupled plasma mass spectrometry. Our data reveal that, unlike rutile IrO2, Ir hydrous oxide contains –IrIIIOOH species which directly contribute to the oxygen evolution from the lattice. This oxygen evolution mechanism results in faster degradation and dissolution of Ir. In addition, near surface bulk regions of hydrous oxide are involved in the oxygen catalysis and dissolution, while only the topmost atomic layers of rutile IrO2 participate in both reactions. Overall our data provide a contribution to the fundamental understanding of the exceptional stability of Ir-oxides towards the oxygen evolution reaction. The proposed approach to a quantitative assessment of the degree of lattice oxygen participation in the oxygen evolution reaction can be further applied to other oxide catalyst systems.
Broader contextUnderstanding why catalysts are unstable during the oxygen evolution reaction (OER) is crucial for the development of efficient energy conversion and storage technologies. The current insight on the complex degradation mechanism is limited by inability to establish structure–function relationships between reactivity/stability and atomic scale structure. In this contribution we combine atom probe tomography (APT) with online electrochemical mass spectrometry (OLEMS) and a method of isotope labelling to enable direct correlation of the atomic scale structure of iridium oxide catalysts with the mechanisms of their degradation and OER. APT offers previously unavailable insight into the distribution of individual atoms within the surface of rutile and amorphous iridium oxides in three dimensions. In particular it shows that unlike rutile iridium dioxide, hydrous oxide consists of highly reactive –IrIIIOOH species that according to OLEMS on 18O-labelled samples are responsible for release of oxygen molecules directly from the oxide lattice leading to iridium dissolution. With the insight on the reaction mechanism obtained from OLEMS the correlative APT measurements can resolve special structural features that are responsible for high reactivity and/or instability of other catalytic systems guiding the development of materials with superior electrocatalytic performance. |
Introduction
The oxygen evolution reaction (OER) underpins electrochemical technologies for hydrogen generation.1,2 The sluggish kinetics of the OER and the instability of most of the catalysing materials hinder widespread application of proton exchange membrane water electrolysers (PEMWE).3 Up to now, only Ir-based anodes meet the necessary requirements and are currently employed in PEMWE.3,4 Nevertheless, even Ir undergoes dissolution in the harsh conditions of the OER. Experimental correlation between activity and stability of noble metals towards OER suggests that the reaction itself triggers dissolution of the catalyst.5,6 In our recent work7 we have shown that at high anodic potentials evolution of oxygen and Ir dissolution may be linked through common intermediates formed in both reactions, whose stability determines the overall performance of an anode. The degradation of the metal oxides during OER may also originate from the instability of the oxygen anion in the oxide lattice.8 This can be especially crucial in the case of mixed oxide catalysts, where preferential leaching of a less noble element occurs,9 resulting in surface reconstruction10 and the formation of amorphous hydrous oxide of Ir.9,11,12 By combining isotope labelling and differential/online electrochemical mass spectrometry (DEMS/OLEMS), several studies evidenced lattice oxygen participation in the OER mechanism for non-noble perovskites13 and sputtered Ru oxide.14 In contrast, no lattice oxygen participation in the OER was observed for Pt15 and thermally prepared RuO2.16 Up to now, only few studies supporting lattice oxygen evolution on Ir anode were reported.9,17 In particular, the instability of the oxide lattice in Ti/IrO2 electrodes formed upon thermal decomposition of the respective salts was reported by Fierro et al.17 The above mentioned study was focused on the mechanism of OER itself without linkage to the dissolution of the catalyst and its structure. We also qualitatively demonstrated that most of the Ir-based alloys and mixed oxides transform to amorphous or hydrous oxides that tend to evolve oxygen from the lattice, while the lattice of rutile IrO2 is stable.9 However, the atomic scale structure and composition of such electrochemically generated hydrous oxides remain in many cases unresolved and so does the extent of the contribution of the lattice oxygen evolution to the degradation mechanism. When considering the application of Ir-based anodes in service, and the extremely high reactivity of hydrous oxides, gaining a fundamental understanding of the interrelations between lattice OER degradation mechanism and the atomic-scale structure of oxides is truly critical.Here, we provide a quantitative assessment of the degree of lattice oxygen participation in the OER and the associated degradation of the Ir-oxides and correlate this mechanism with the atomic scale structure. This is achieved using a method of isotope labelling, a scanning flow cell (SFC) coupled with OLEMS and an inductively coupled plasma mass spectrometer (ICP-MS) (see the arrangement of setups in Fig. S1, ESI†). The reactively sputtered Ir18O2 and electrochemically formed hydrous Ir18Ox catalysts are chosen as model electrodes because their stabilities significantly differ. The mechanism of lattice oxygen evolution is directly correlated with the near-atomic-level characterization of oxides revealed by atom probe tomography (APT). This unique and correlative combination of techniques reveals that, in contrast to rutile IrO2, hydrous oxide consists of –IrIIIOOH species that contribute to the OER from within the lattice. Dissolution of Ir from its hydrous oxide is hypothesized to be directly correlated with the formation of oxygen molecules from lattice atoms, since the associated partial currents of these processes are of the same order of magnitude. Overall, Ir oxides exhibit high stability as molecular oxygen is generated from water rather than from the oxide lattice itself.
Results
Structure of oxides
The reactively sputtered oxide was first analysed by X-ray photoelectron spectroscopy (XPS), and the binding energy of Ir 4f7/2 peak at 61.8 eV corresponds to IrIV in IrO2 (Fig. S2, ESI†).18,19 Detailed deconvolution of the spectra suggests that this is the only oxidation state of Ir detected in our experiments. Possible presence of other oxidation states in trace amounts cannot be completely ruled out without employment of X-ray absorption methods, e.g. EXAFS. In line with this, a spectrum of O 1s level has significant contribution of lattice oxygen (529.9 eV) (Fig. S2b, ESI†). In agreement with the literature,19 the spectrum of (Fig. S3a, ESI†) hydrous oxide shows the presence of IrIII and IrIV in Ir 4f level. The O 1s level in the hydrous oxide indicates the essential contribution of OH groups in comparison to lattice oxygen (Fig. S3b, ESI†).To address the complex structure of the near surface regions of oxides that might be involved in the possible evolution of oxygen from the lattice, we employed APT. The details of specimen preparation can be found in Fig. S5 (ESI†). The top-down and side views of a three dimensional APT reconstruction from the hydrous oxide are shown in Fig. 1a–d. The spatial resolution in APT is not isotropic with respect to the analysis direction. The depth resolution being at least twice superior to the lateral resolution on average. Within the datasets presented here, one can consider a higher bound of the spatial resolution being in the range of 0.2–0.5 nm across the entire field of view. It is safe to estimate it to be close to ∼0.2 nm in the depth-profiles in Fig. 1c, d and h that are mostly concerned with an analysis parallel to the specimen's main axis. For the profiles in Fig. 1b and g, which were calculated almost normally to the specimen's main axis, a safe estimate would be in the range of 0.5 nm. To detect possible hydroxy-groups the oxide was prepared using a proton-free deuterated electrolyte,20 since hydrogen is the main contaminant of the vacuum chamber and might interfere with data analysis.21 Note that 16O-containing oxides were used for APT experiments. In line with TEM data presented in Fig. S4 (ESI†), the hydrous oxide has a nanoporous structure with an oxide film of only a few atomic layers thick covering the entire surface (Fig. S6, ESI†). The composition of the surface oxide film varies in terms of oxygen content along the surface and contains 16OD-enriched regions (Fig. S6b, ESI†). This observation suggests that the hydrous oxides, when prepared by cycling of the electrode potential, exhibit different structure and composition from those reported for Ir oxide films prepared by galvanostatic or potentiostatic anodic polarization.20Fig. 1a–c show that the bulk of the hydrous oxide contains a network of pores. Fig. 1d displays a close-up on one pore, which clearly shows a scattered cloud of oxygen atoms and an agglomeration of hydroxy groups marked by the deuterated molecular ions 16OD+ detected by APT (Fig. 1e). According to our results presented in Fig. 1d and e, each nanopore of the hydrous oxide is covered by ca. 52 at% of IrO and 48 at% of OH groups, which roughly matches a 1![[thin space (1/6-em)]](https://www.rsc.org/images/entities/char_2009.gif) :1 ratio. The corresponding mass spectra obtained for the outer layer and for the porous bulk of the hydrous oxide are shown in Fig. S7 (ESI†).
:1 ratio. The corresponding mass spectra obtained for the outer layer and for the porous bulk of the hydrous oxide are shown in Fig. S7 (ESI†).
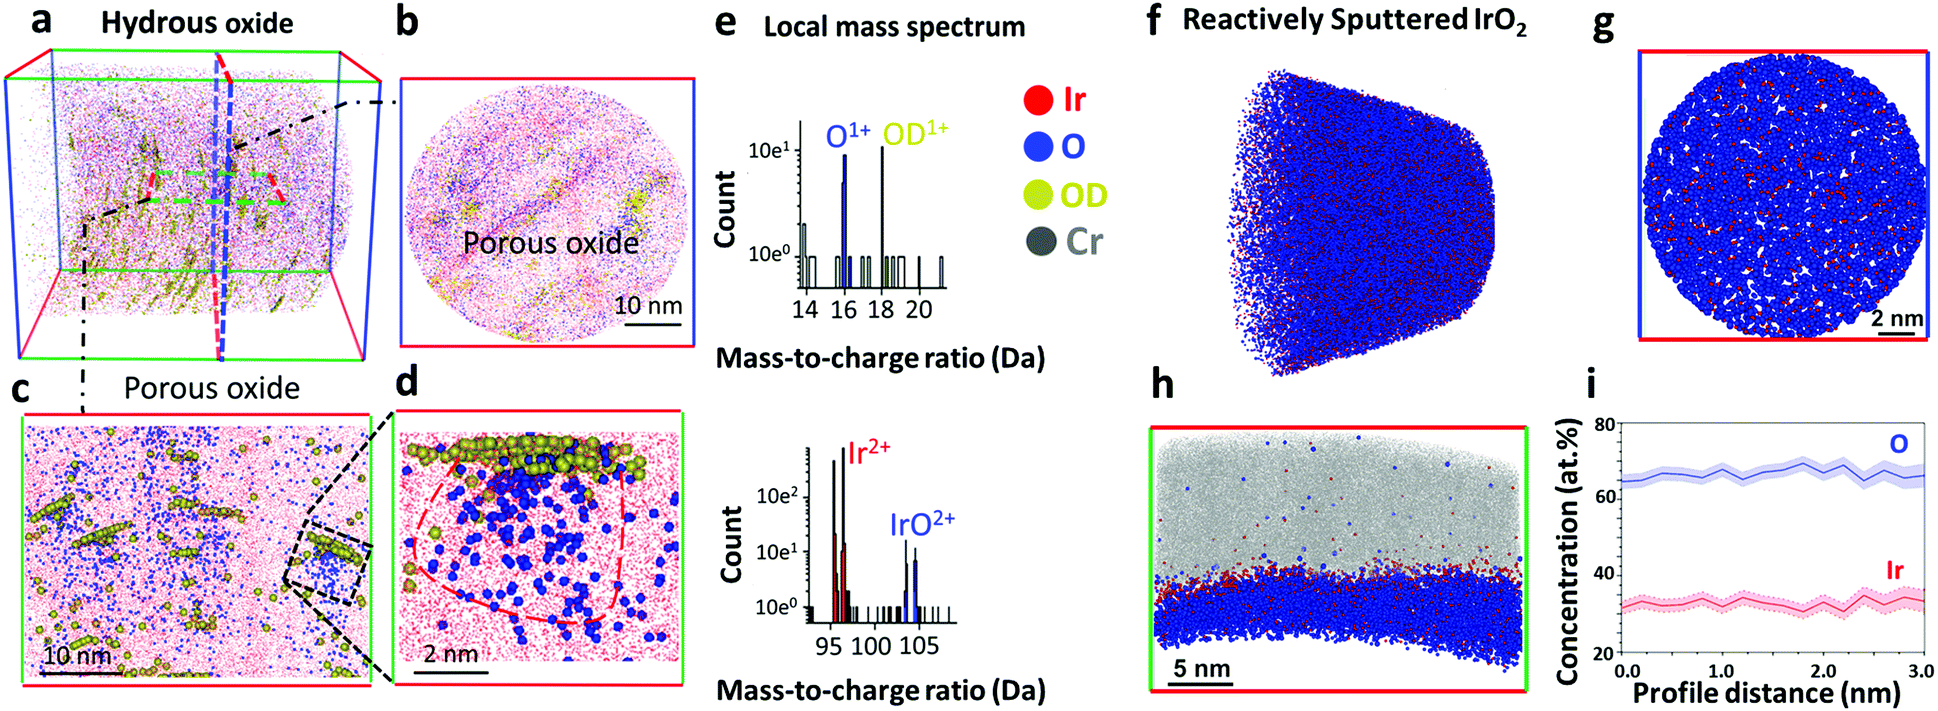 | ||
| Fig. 1 Atom Probe Tomography (APT) data of the near-surface regions of hydrous Ir16Ox (a–e) and reactively sputtered rutile Ir16O2 (f–i). (a) 3D view of the hydrous Ir16Ox. (b) Top-down view of the near surface region of the hydrous Ir16Ox. (c) Side view, showing small pores/clusters. (d) Close-up on a single oxide cluster, and (e) local mass spectrum of the oxide cluster in (d). The sample was prepared following the geometry shown in Fig. S5b (ESI†). (f) 3D view of the side view of reactively sputtered rutile Ir16O2. (g) Top-down view of the surface of reactively sputtered Ir16O2. (h) Side view of reactively sputtered IrO2. (i) Concentration profile corresponding to Ir to O ratio in reactively sputtered Ir16O2. Note: blue dots in a colour scheme represent oxygen containing molecular ions detected in atom probe experiments. | ||
Note that APT works by progressively field evaporating, i.e. desorbing and ionizing under the influence of an intense electric field, the atoms from the specimen's surface. As a void gets intersected by the emitting surface, severe variations of the local curvature appear that make voids the loci of severe trajectory aberrations.22 This explains the apparently diffuse clouds of Ir16O corresponding to the void. In the tomographic reconstruction, the 16OD+ species appear agglomerated at the top of the void. The depth coordinate is sequentially incremented for each detected ion.23 The hydroxy groups present within the nanopores (region in Fig. 1d) will be detected in close succession, escaping from the pore shortly after it starts being analysed. These ions hence artificially appear nearly at the same depth within the reconstruction, while they are in reality distributed over the whole volume of the pore.23
In contrast to hydrous oxide, reactively sputtered Ir16O2 has a compact structure (Fig. 1f–h). The bulk (Fig. 1f) and the near-surface regions (Fig. 1g and h) of the oxide consist of Ir and O in a ratio of 1:2 (Fig. 1i), while hydroxy groups are absent.
Degradation of oxides through evolution of oxygen from the lattice
Details regarding the setups arrangement and electrodes preparation can be found in ESI† and Fig. S1. In short, considering that Ir oxide prepared by anodic or thermal oxidation can have local character20 and to avoid contamination by other oxygen isotopes, Ir18O2 was prepared by reactive sputtering in 18O2 atmosphere. Isotope labelled hydrous Ir18Ox was obtained by cycling of potential of the Ir electrode in 0.1 M HClO4 prepared by dilution of concentrated acid in H218O. Composition of the isotope labelled samples was confirmed using time-of-flight secondary ion mass spectroscopy (Fig. S8, ESI†). In order to remove residuals of H218O from the pores of hydrous oxide, which may affect measured by OLEMS signal of isotopic masses, after the preparation it was ultrasonically treated in ultrapure H216O. Then it was transferred to the high vacuum chamber and annealed at 100 °C in vacuum during the 2 hours at 10−6 Pa. The detailed explanation of the procedure is presented in Supplementary notes to Fig. S9 (ESI†).To resolve possible participation of lattice oxygen in the OER, the further electrochemical measurements were done in H216O containing electrolyte. In this case the oxygen molecules are expected to be formed in three ways (i) from water molecules without lattice exchange (16O16O, m/z = 32 Da); (ii) by combination of oxygen atoms from water and oxide lattice (16O18O, m/z = 34 Da) and (iii) from two lattice oxygen atoms, without participation of water (18O18O, m/z = 36 Da). In order to exclude the effect of corresponding isotope abundance in H216O used for the electrochemical measurements, the same electrochemical protocol was applied to labelled hydrous Ir18Ox and unlabelled Ir16Ox prepared by an identical procedure. The corresponding as received OLEMS data are shown in Fig. S10 and S11 (ESI†). The intensities of 16O18O and 18O18O signals in the Fig. S11 (ESI†) were used as background values, subtracted from those measured for the 18O-labelled samples (Fig. S10, ESI†), whenever quantification was performed. The data after background subtraction are shown in Fig. 2. The following electrochemical protocol was employed to the hydrous Ir18Ox electrode: first, the potential was swept into the anodic direction till the current density approached a value of 20 mA cm−2 (Fig. 2a), then the electrode was polarized at 15 mA cm−2 during 60 s (Fig. 2b) and an identical anodic sweep of potential was performed once again (Fig. 2c) to evaluate changes in the electrode's behaviour. Simultaneously we recorded the Ir dissolution and volatile products with mass-to-charge ratios of 32, 34 and 36 Da.
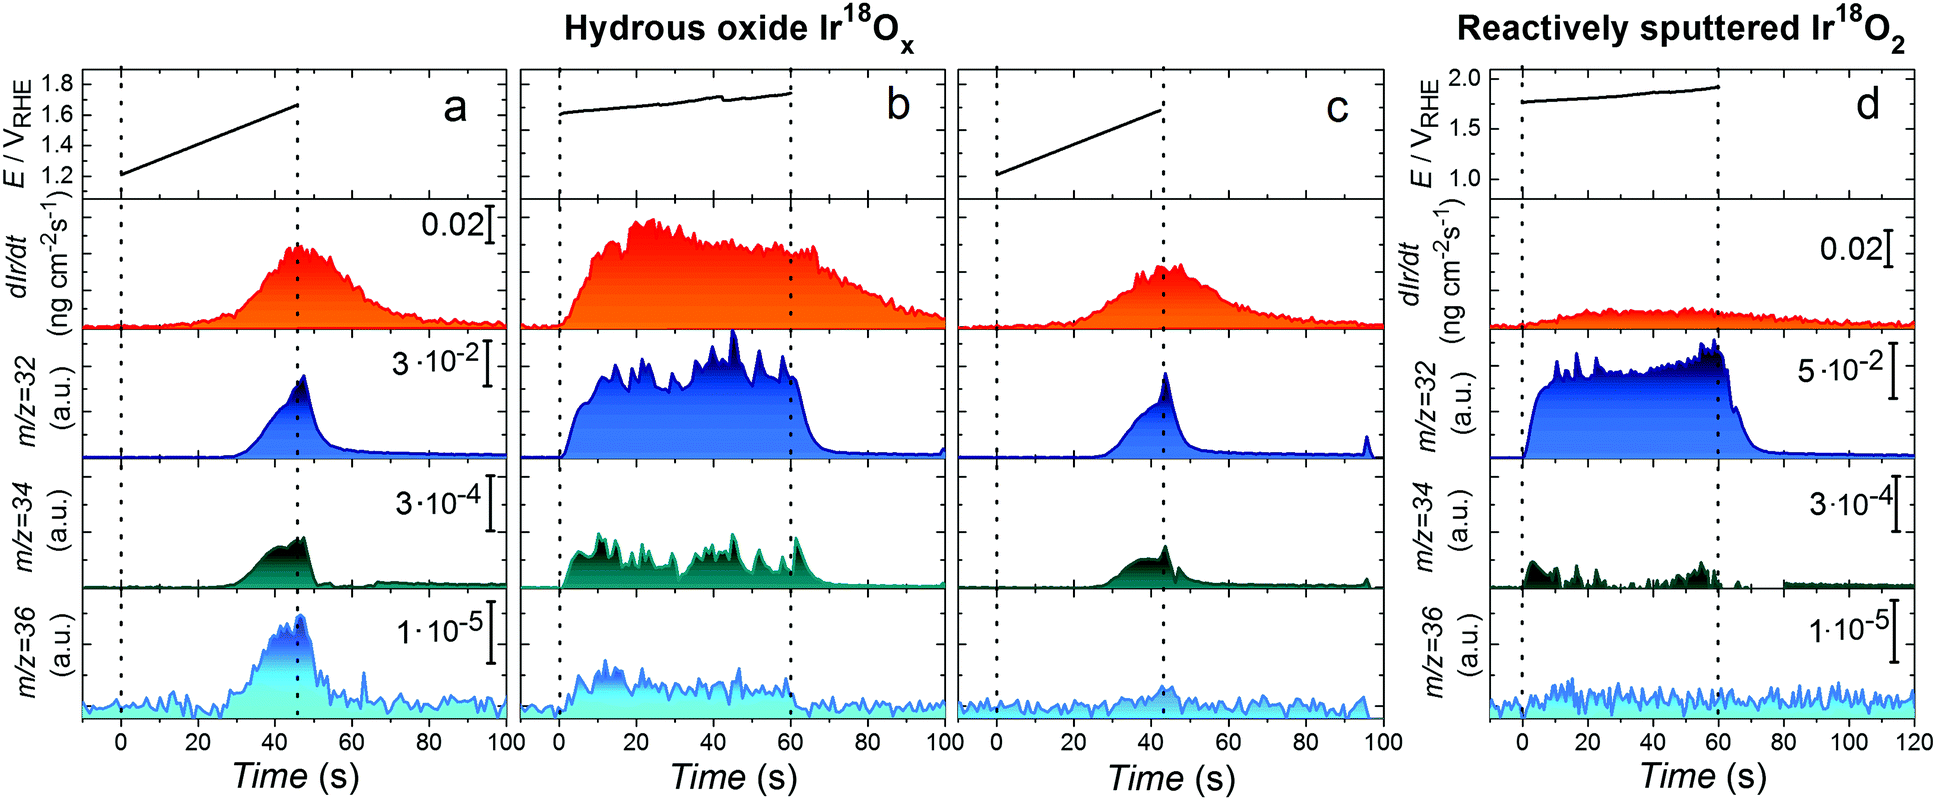 | ||
| Fig. 2 On-line observation of lattice oxygen evolution and dissolution of hydrous Ir18Ox (a–c) and reactively sputtered Ir18O2 (d) during OER in 0.1 M HClO4 in H216O. Applied (a and c) or measured (b) potential for the investigation of OER and corresponding Ir concentration profiles, 16O16O, 16O18O and 18O18O signals plotted vs. time for an isotope labelled hydrous Ir18Ox electrode. Potential scans in (a) and (c) were performed from 1.2 VRHE till current density reached 20 mA cm−2 with the scan rate of 10 mV s−1. (b) Galvanostatic anodic polarization at 15 mA cm−2 during 60 s. (d) The measured potential for the investigation of OER and corresponding Ir concentration profiles, 16O16O, 16O18O and 18O18O signals plotted vs. time for an isotope labelled reactively sputtered Ir18O2 electrode during galvanostatic anodic polarization at 25 mA cm−2 during 60 s. The signals for 16O18O and 18O18O are shown after subtraction of corresponding data obtained on unlabelled 16O-samples. As-received OLEMS data are shown in Fig. S10, S11 and S13 (ESI†). | ||
Fig. 2 shows that the concentration of dissolved Ir slightly decreases from the first to the second scan of potential. The higher dissolution during the first scan can be assigned to the dissolution of the lattice defects and their stabilization after the galvanostatic experiment. Significant formation of species with both m/z 34 and 36 is observed during the polarization of 18O-labelled samples, evidencing participation of lattice oxygen of hydrous Ir18Ox in 16O18O and 18O18O evolution (Fig. 2). Signals of both 16O18O and 18O18O decrease after polarization at constant current (Fig. 2a and c) indicating a continuous exchange between oxygen atoms in the oxide lattice and water during the OER. Similarly, a decay in intensity of 18O18O is observed during longer polarization of the 18O-labled hydrous oxide electrode at 15 mA cm−2 (Fig. S12, ESI†). When exposed to conditions of even more intense oxygen formation, both dissolution and participation of lattice oxygen in the OER on reactively sputtered Ir18O2 are almost negligible (see Fig. 2d and Fig. S13, ESI†). In particular, insignificant amounts of 16O18O and 18O18O species were detected, however, this observation is rather speculative considering that the measured signal is close to the detection limit and has a poor signal-to-noise ratio. This finding agrees with a previous report for Ti/IrO2 prepared by thermal decomposition of an Ir precursor17 and can be expected from the superior durability of stoichiometric IrO2.
In line with our previous reports on metallic Ir,24 the dissolution of hydrous oxide becomes detectable at a potential below that for the evolution of oxygen (Fig. 3a) and accelerates at OER relevant conditions (Fig. 3a–d). Interestingly, the formation of oxygen molecules resulting from the combination of different isotopes occurs simultaneously, with no difference in the onset potential (Fig. 3b–d). Assuming that oxygen evolution and dissolution of Ir are the only anodic processes taking place during polarization, using the experimental data on dissolution and formation of 16O16O, 16O18O and 18O18O, the contribution of each of these species to the total current was estimated and plotted in Fig. 3e–h. Additional details of such estimation can be found in ESI.† In this set of experiments, the Ir dissolution and formation of 16O16O, 16O18O and 18O18O were detected during polarization of freshly prepared 18O-labelled samples of hydrous oxide at various current densities (Fig. S14 and S15, ESI†). The major part of the evolved oxygen is formed by decomposition of water (16O16O), without any contribution of lattice atoms. Lower, but still essential part of current corresponds to oxygen formed by combination of atoms from water and oxide (16O18O). In contrast, the partial currents of Ir dissolution and the formation of 18O18O from the lattice of hydrous oxide, are one to two orders of magnitude lower. Interestingly, in the whole range of studied current densities, the ratio between dissolved Ir and formed 18O18O is found to be constant, suggesting that the dissolution reaction and lattice oxygen evolution are linked.
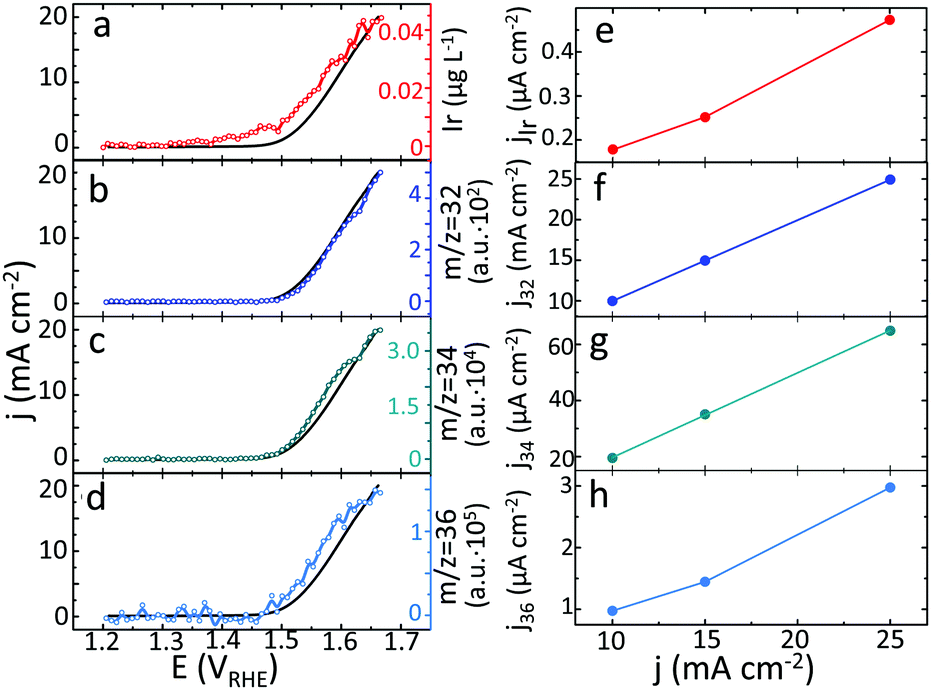 | ||
| Fig. 3 Dissolution of Ir (a) and formation of 16O16O (b), 16O18O (c) and 18O18O (d) plotted versus applied electrode potential during the anodic sweep. Black curve corresponds to a measured current density. Partial currents of Ir dissolution (e) and evolution of 16O16O (f), 16O18O (g) and 18O18O (h) depending on applied for 60 s current density. Electrode: hydrous Ir18Ox, electrolyte: 0.1 M HClO4 in H216O. | ||
Discussion
Development of novel Ir-based anodes with improved electrocatalytic properties requires a detailed understanding of the structural distinctions that can be responsible for high reactivity and/or provide long term stability. To achieve this, the mechanisms of oxygen evolution and degradation reactions need to be collated with the structure of the catalyst, preferably at the atomic scale. Substantial progress in understanding the reactivity of Ir electrodes was made using synchrotron based spectroscopy.10,19,25–28 In particular, electronic defects such as OI− and IrIII were reported to provide high activity towards OER.11,19,28–30 In order to correlate both activity and stability with the distribution of individual atoms within the near surface region potentially available for catalytic reactions we have recently suggested to complement electrochemical data with correlative APT experiments.20 Below we address a mechanism of Ir oxides degradation through the APT analysis and unique data on formation of oxygen molecules from the lattice atoms.As suggested by previous reports,24,31,32 the dissolution of hydrous oxide becomes detectable at a potential below that required for the evolution of oxygen (Fig. 3a), which can be attributed to the dissolution induced by the oxidation of low coordinated Ir species on the electrode surface.7 As soon as oxygen starts evolving, a significant acceleration of the dissolution occurs (Fig. 3a–d). For highly active Ir-based materials, e.g. hydrous or reactively sputtered oxide (Fig. S16, ESI†), the potential at the electrode during the OER is below the value required for oxidation of Ir to IrVI.7 The dissolution, thus, occurs via an intermediate IrIII and results in the formation of Ir3+ degradation products.7
Data in Fig. 3e–h and 2d suggest that the major portion of the oxygen evolution results from water discharge without exchange with atoms from the lattice for both oxides. Similar observations were reported by Fierro et al. for acidic OER on Ti/IrO2 anode,17 and by Grimaud et al. during the alkaline water electrolysis on various perovskites.13 We observe only insignificant contribution of lattice oxygen atoms in the OER for rutile IrO2, in contrast to the amorphous oxide. This difference in the lattice participation to the oxygen evolution can be directly correlated with the atomic scale microstructure of oxides derived from APT. According to the APT data presented in Fig. 1a–c, the hydrous oxide consists of a network of nanopores, each covered by ca. 52 at% of IrO and 48 at% of OH groups, which roughly corresponds to a 1:1 ratio (Fig. 1d and e). The high content of OH-groups is additionally confirmed by XPS data (Fig. S3b, ESI†). Considering our XPS results shown in Fig. S3a (ESI†), and the near ambient pressure XPS (NAP-XPS) from literature,11,19,33 amorphous and hydrous oxides of Ir contain IrIII species. Most probably the role of the OH groups in the oxide structure lies in stabilising the IrIII oxidation state. The 1:1 ratio between IrO and OH derived from the APT spectra indicates that electrochemically prepared hydrous oxide more likely contains –IrIIIOOH groups instead of –IrIII(OH)x. The –IrIIIOOH groups themselves can serve as OER precursors. In particular, OH-groups contribute to the oxygen evolution by combining with atoms from water via a peroxide mechanism and give a rise to a signal for 16O18O in Fig. 3. This can occur with participation of two active sites, as was suggested by Bockris34 or with only one active site involved in accordance with the mechanism proposed by Rossmeisl et al.35 Based on in situ XPS measurements19,30 and CO titration29 experiments, a peroxide pathway of OER was reported on Ir oxohydroxides. In contrast to electrochemically formed oxides, the OH-free structure of reactively sputtered oxide (Fig. 1f–h) indicates that such reaction route is very unlikely to occur on rutile IrO2. As a result, no difference at m/z = 34 Da is observed between 18O-labelled and unlabelled samples of reactively sputtered IrO2 (Fig. 2).
During 1 min of anodic polarization at 15 mA cm−2 approximately 8·1015 OH groups in hydrous oxide contribute to the OER via peroxide route. This corresponds to 0.5% of the total amount of the formed oxygen molecules, while only about 0.01% evolves by combination of two neighbouring lattice oxygen atoms. The formation of different types of oxygen happens approximately at the same onset potential (Fig. 3b–d) and with similar slope.
Fig. 3e and h reveals that the partial currents of Ir dissolution and the formation of 18O18O from the lattice of hydrous oxide are of the same order of magnitude, while the ratio between the dissolved Ir and the formed 18O18O is found to be constant within the range of studied current densities. This important observation has never been reported in the literature before and directly confirms the previously suggested correlation between the lattice oxygen evolution and dissolution.8,9 Obviously, the removal of oxygen atoms from the lattice is an energetically unfavourable event, which results in superior stability of Ir oxides. Nevertheless on hydrous oxide, such events that lead to dissolution may occur more frequently, resulting in an order of magnitude higher dissolution rate than that exhibited by rutile-IrO2. The accelerated dissolution may originate from structural differences between the rutile and hydrous IrOx, particularly the presence of –IrIIIOOH species. This stoichiometry derived from APT experiments corresponds to a degradation intermediate HIrIIIO2 species, which we previously suggested based on the dissolution data.7,31 We made an assumption that an intermediate HIrIIIO2 degrades forming Ir3+ in the solution.7,31 However, the insights gained from the isotope labelled experiments provide complementary information suggesting that the degradation of –IrIIIOOH may be accompanied by the release of molecular oxygen. Thus, when present in the oxide structure the –IrIIIOOH groups themselves can lead to higher degradation via formation of oxygen molecules from the lattice atoms.
In accordance with in situ Raman,36 XPS,11,12,28 STEM studies,37 and CO-titration experiments,30 hydrous oxide is composed of IrO6 clusters that share oxygen atoms in the edges and may be connected by OI−, OH or H2O bridges in vertices. These oxygen-containing groups were reported to be beneficial for the electrode activity since they are spatially available for water attack.37 Participation of oxygen containing linkages in the OER eventually leads to a weakening of the connection between IrO6 octahedra, increasing the probability of Ir dissolution and of the formation of lattice 18O18O. With each new reaction cycle, ‘exposed’ Ir atoms become available for adsorption of OH-radicals formed by water discharge, resulting in a constant exchange between oxygen in the lattice and oxygen atoms in water, as indicated by the decay in the measured intensity of 18O-containg oxygen species in Fig. 2c. In addition, unlike rutile IrO2, hydrous oxide has a porous structure, where not only the topmost surface layers, but also near-surface bulk regions can be available for the OER, see e.g.Fig. 1. As a result much higher signals of 18O18O and dissolution are observed. The oxide structure therefore plays a crucial role in the stability of the oxide lattice and should be considered for the rational design of stable and active Ir-based catalysts. Overall, Ir-based oxides with strong Ir–O bonding in linkages between IrO6 clusters should exhibit higher stability against dissolution.
Conclusions
In summary, by combining advanced electrochemical characterization with a method of isotope labelling and atom probe tomography we have demonstrated that differences in lattice oxygen evolution on Ir-oxides originate from their respective structure and microstructure. Specifically, the lattice oxygen evolution mechanism may take place on both studied materials, however, the high number of defects, the presence of –IrIIIOOH-groups and the porosity in the hydrous IrOx make lattice oxygen atoms more available for combination with those from water. Such interactions result in a weakening of the connection between IrO6 clusters in the oxide matrix, thereby increasing the probability of the formation of molecular oxygen from the lattice and also of Ir dissolution. Nevertheless, oxygen evolution on Ir-based anodes mainly results from discharge of water molecules, explaining superior durability of these materials. The approach based on combining of isotope labelling, OLEMS and atom probe tomography can be further applied to advance understanding of lattice oxygen evolution mechanisms on other catalyst materials, e.g. iridium based perovskites or hollandites, ruthenium oxides or non-precious metal oxides.Experimental
Preparation of reactively sputtered IrO2
Thin films of isotope labelled reactively sputtered Ir18O2 were deposited by magnetron sputtering (BESTEC GmbH, Berlin, Germany) at 100 W in a mixture of 18O2 (99.00 at%, Sigma Aldrich) and Ar as the sputter gas and the chamber pressure was regulated to 0.5 Pa at room temperature. The base vacuum before deposition was 2.0 × 10⁻⁶ Pa. The Ø3 inch target of Ir (99.9%, Evochem, Germany) was pre-cleaned by sputtering against closed shutters prior to deposition and the chamber was purged with of mixture 18O2 and Ar during 30 min. To prepare films with a minimal surface roughness, the smooth substrates of single crystalline Si(100) wafers with a 1.5 μm thermal SiO2 diffusion and reaction barrier layer were used. The resulting thickness of the obtained coating was approximately 80 nm. Unlabelled reactively sputtered Ir16O2 were deposited using a mixture of 16O2 and Ar. All other conditions were kept as described before.Preparation of hydrous IrOx
First thin films of Ir were deposited on the Si(100)/SiO2 wafers by magnetron sputtering in Ar atmosphere at room temperature and 100 W. The base vacuum before deposition was 2.5 × 10⁻⁶ Pa. During the sputtering the pressure was adjusted to 0.5 Pa. The Ir target was also precleaned prior to deposition as described above. The resulting thickness of the obtained coating was ca. 100 nm. Such prepared Ir films were used as working electrodes in a three electrode electrochemical cell, using saturated Ag/AgCl electrode (Metrohm, Germany) and Pt as reference and counter electrodes, respectively. The 18O-labelled samples of hydrous Ir18Ox were prepared using solution of 0.1 M HClO4 in H218O (97.76 at%, Campro Scientific GmbH, Germany) applying a square wave potential program with upper and lower potential limits of 1.4 and 0.04 VRHE, respectively (300 cycles at 0.5 Hz). Then electrodes were carefully rinsed with ultrapure H216O water and treated in the vacuum at 100 °C during 2 hours to ensure removal of physiosorbed H218O from the pores of material. Such procedure does not affect structure of the material and has no impact on stability-activity behaviour.OLEMS measurements
Unlabelled samples were prepared using electrolyte containing 0.1 M HClO4 (Suprapur® 70% HClO4, Merck, Germany) in ultrapure H216O water (PureLab Plus system, Elga, 18 MΩ cm, TOC < 3 ppb). All 18O-labelled samples were prepared right before the OLEMS measurements and transferred in a desiccator to avoid exchange of lattice oxygen in topmost layers with air.The volatile oxygen products with mass to charge ratios of 32, 34 and 36 were measured using scanning flow cell – on-line electrochemical mass spectrometer (OLEMS) set up, previously described in.38 In contrast to SFC connected to the ICP-MS, here the PTFE tip from the top of the cell through an extra vertical channel was introduced (Fig. S1b, ESI†). In this case, surface area of the working electrode was 12.5 × 10⁻² cm2. A 50 μm thick PTFE Gore-Tex membrane with a pore size of 20 nm, through which products can evaporate into the vacuum system of the mass spectrometer (Extrel, Pennsylvania, USA), was mounted onto the very end of the tip. The approximate distance from the tip to the electrode was about 30 μm, which is determined by the thickness of the silicon ring sealing around the cell opening and the applied contact force. These parameters affect the sensitivity and, therefore, they were kept constant during the whole set of measurements. The small size of pores and the thickness of the membrane result in the reduction of the water background pressure inside the vacuum and provide a good response time. Prior to measurements electrolyte was purged with Ar during 2 hours to ensure that no oxygen is coming from air. Such optimized configuration results in good response time and high sensitivity. All OLEMS measurements were performed in electrolyte containing 0.1 M HClO4 in ultrapure H216O water. A potentiostat (Gamry Reference 600, USA) was used for the electrochemical measurements with both setups. Each measurement was reproduced at least three times on three different samples prepared by the identical procedure.
APT experiments
Needle-shaped APT specimens were prepared by means of a site-specific lift-out procedure using a FEI Helios 600 Nanolab focused ion beam (FIB)/scanning electron microscope. A 200 nm thick protective Cr-layer was coated on top of Ir by e-beam deposition in order to protect the surface oxides. The APT experiments were conducted on a CAMECA LEAP 5000 XS instrument equipped with an ultraviolet laser with a spot size of 2 μm and a wavelength of 355 nm (detection efficiency ∼80%). Data was acquired in laser pulsing mode at a specimen temperature of 60 K, with a target evaporation rate of 5 ions per 1000 pulses, a pulsing rate of 200 kHz, laser pulse energy of 60 pJ. The APT data were reconstructed and analysed using the commercial IVAS 3.6.14™ software.Further details on the additional methods, experimental procedures and characterization data can be found in the ESI.†
Author contributions
O. K. wrote the manuscript, prepared reactively sputtered Ir18O2 and Ir16O2 samples, performed XPS, ToF-SIMS, dissolution measurements and data analysis. O. K. and J.-P. G. carried out OLEMS measurements. S. G. synthesized isotope-labelled Ir hydrous oxide samples and performed ICP-MS measurements. T. L. and K. S. conducted FIB and APT experiments and data treatment. S. Z. carried out TEM measurements. O. K., S. G., T. L., S. Z., C. S., D. R., S. C., B. G. and K. J. J. M. contributed through scientific discussions. All authors revised the manuscript and have given approval to the final version.Conflicts of interest
There are no conflicts to declare.Acknowledgements
O. K. acknowledges support from Helmholtz-Zentrum Berlin GmbH and from the Helmholtz Association Initiative and Networking Fund. O. K. and T. L. acknowledge the Alexander von Humboldt Foundation. The authors acknowledge the MAXNET Energy research initiative of the Max Planck Society for financial support. We acknowledge the funding of the BMBF project MANGAN (Grant No. 03SF0507). S. Z. and C. S. acknowledge funding from the German Research Foundation (DFG SCHE 634/12-2). The authors thank to Andrea M. Mingers and Eberhard Heinen for their help in maintaining ICP-MS and PVD facilities. O. K. acknowledges Prof. Alexander Auer and Dr. Jonathon Eric Vandezande for the fruitful discussion of the results presented in this work. K. S. is grateful for the scholarship form the IMPRS-SURMAT. B. G. is grateful for the support from the ERC-CoG-771602-SHINE. Open Access funding provided by the Max Planck Society.Notes and references
- V. R. Stamenkovic, D. Strmcnik, P. P. Lopes and N. M. Markovic, Nat. Mater., 2017, 16, 57–69 CrossRef CAS PubMed.
- Z. W. Seh, J. Kibsgaard, C. F. Dickens, I. Chorkendorff, J. K. Nørskov and T. F. Jaramillo, Science, 2017, 355(6321), eaad4998 CrossRef PubMed.
- L. C. Seitz, C. F. Dickens, K. Nishio, Y. Hikita, J. Montoya, A. Doyle, C. Kirk, A. Vojvodic, H. Y. Hwang, J. K. Norskov and T. F. Jaramillo, Science, 2016, 353, 1011–1014 CrossRef CAS PubMed.
- O. Diaz-Morales, S. Raaijman, R. Kortlever, P. J. Kooyman, T. Wezendonk, J. Gascon, W. T. Fu and M. T. M. Koper, Nat. Commun., 2016, 7, 12363 CrossRef CAS PubMed.
- N. Danilovic, R. Subbaraman, K.-C. Chang, S. H. Chang, Y. J. Kang, J. Snyder, A. P. Paulikas, D. Strmcnik, Y.-T. Kim, D. Myers, V. R. Stamenkovic and N. M. Markovic, J. Phys. Chem. Lett., 2014, 5, 2474–2478 CrossRef CAS PubMed.
- S. Cherevko, A. R. Zeradjanin, A. A. Topalov, N. Kulyk, I. Katsounaros and K. J. J. Mayrhofer, ChemCatChem, 2014, 6, 2219–2223 CrossRef CAS.
- O. Kasian, J.-P. Grote, S. Geiger, S. Cherevko and K. J. J. Mayrhofer, Angew. Chem., Int. Ed., 2018, 57(9), 2488–2491 CrossRef CAS PubMed.
- T. Binninger, R. Mohamed, K. Waltar, E. Fabbri, P. Levecque, R. Kotz and T. J. Schmidt, Sci. Rep., 2015, 5, 12167 CrossRef CAS PubMed.
- S. Geiger, O. Kasian, M. Ledendecker, E. Pizzutilo, A. M. Mingers, W. T. Fu, O. Diaz-Morales, Z. Li, T. Oellers, L. Fruchter, A. Ludwig, K. J. J. Mayrhofer, M. T. M. Koper and S. Cherevko, Nat. Catal., 2018, 1(7), 508 CrossRef CAS.
- A. Grimaud, A. Demortière, M. Saubanère, W. Dachraoui, M. Duchamp, M.-L. Doublet and J.-M. Tarascon, Nat. Energy, 2016, 2, 16189 CrossRef.
- T. Reier, Z. Pawolek, S. Cherevko, M. Bruns, T. Jones, D. Teschner, S. Selve, A. Bergmann, H. N. Nong, R. Schlögl, K. J. J. Mayrhofer and P. Strasser, J. Am. Chem. Soc., 2015, 137, 13031–13040 CrossRef CAS PubMed.
- O. Kasian, S. Geiger, M. Schalenbach, A. M. Mingers, A. Savan, A. Ludwig, S. Cherevko and K. J. J. Mayrhofer, Electrocatalysis, 2018, 9, 139–145 CrossRef CAS.
- A. Grimaud, O. Diaz-Morales, B. Han, W. T. Hong, Y.-L. Lee, L. Giordano, K. A. Stoerzinger, M. T. M. Koper and Y. Shao-Horn, Nat. Chem., 2017, 9, 457–465 CrossRef CAS PubMed.
- M. Wohlfahrt-Mehrens and J. Heitbaum, J. Electroanal. Chem., 1987, 237, 251–260 CrossRef CAS.
- O. W. J. Willsau and J. Heitbaum, J. Electroanal. Chem. Interfacial Electrochem., 1985, 195, 299–306 CrossRef.
- K. A. Stoerzinger, O. Diaz-Morales, M. Kolb, R. R. Rao, R. Frydendal, L. Qiao, X. R. Wang, N. B. Halck, J. Rossmeisl, H. A. Hansen, T. Vegge, I. E. L. Stephens, M. T. M. Koper and Y. Shao-Horn, ACS Energy Lett., 2017, 2, 876–881 CrossRef CAS.
- S. Fierro, T. Nagel, H. Baltruschat and C. Comninellis, Electrochem. Commun., 2007, 9, 1969–1974 CrossRef CAS.
- O. Kasian, S. Geiger, P. Stock, G. Polymeros, B. Breitbach, A. Savan, A. Ludwig, S. Cherevko and K. J. J. Mayrhofer, J. Electrochem. Soc., 2016, 163, F3099–F3104 CrossRef CAS.
- V. Pfeifer, T. E. Jones, J. J. Velasco Velez, C. Massue, M. T. Greiner, R. Arrigo, D. Teschner, F. Girgsdies, M. Scherzer, J. Allan, M. Hashagen, G. Weinberg, S. Piccinin, M. Havecker, A. Knop-Gericke and R. Schlogl, Phys. Chem. Chem. Phys., 2016, 18, 2292–2296 RSC.
- T. Li, O. Kasian, S. Cherevko, S. Zhang, S. Geiger, C. Scheu, P. Felfer, D. Raabe, B. Gault and K. J. J. Mayrhofer, Nat. Catal., 2018, 1, 300–305 CrossRef.
- Y.-S. Chen, D. Haley, S. Gerstl, A. London, F. Sweeney, R. Wepf, W. Rainforth, P. Bagot and M. Moody, Science, 2017, 355, 1196–1199 CrossRef CAS PubMed.
- M. K. Miller, L. Longstreth-Spoor and K. F. Kelton, Ultramicroscopy, 2011, 111, 469–472 CrossRef CAS PubMed.
- D. J. Larson, B. Gault, B. P. Geiser, F. De Geuser and F. Vurpillot, Curr. Opin. Solid State Mater. Sci., 2013, 17, 236–247 CrossRef CAS.
- S. Cherevko, S. Geiger, O. Kasian, N. Kulyk, J.-P. Grote, A. Savan, B. R. Shrestha, S. Merzlikin, B. Breitbach, A. Ludwig and K. J. J. Mayrhofer, Catal. Today, 2016, 262, 170–180 CrossRef CAS.
- A. Minguzzi, C. Locatelli, O. Lugaresi, E. Achilli, G. Cappelletti, M. Scavini, M. Coduri, P. Masala, B. Sacchi, A. Vertova, P. Ghigna and S. Rondinini, ACS Catal., 2015, 5, 5104–5115 CrossRef CAS.
- A. Minguzzi, O. Lugaresi, E. Achilli, C. Locatelli, A. Vertova, P. Ghigna and S. Rondinini, Chem. Sci., 2014, 5, 3591–3597 RSC.
- H. G. Sanchez Casalongue, M. L. Ng, S. Kaya, D. Friebel, H. Ogasawara and A. Nilsson, Angew. Chem., Int. Ed., 2014, 53, 7169–7172 CrossRef CAS PubMed.
- V. Pfeifer, T. E. Jones, J. J. Velasco Vélez, C. Massué, R. Arrigo, D. Teschner, F. Girgsdies, M. Scherzer, M. T. Greiner, J. Allan, M. Hashagen, G. Weinberg, S. Piccinin, M. Hävecker, A. Knop-Gericke and R. Schlögl, Surf. Interface Anal., 2016, 48, 261–273 CrossRef CAS.
- C. Massué, V. Pfeifer, M. van Gastel, J. Noack, G. Algara-Siller, S. Cap and R. Schlögl, ChemSusChem, 2017, 10, 4786–4798 CrossRef PubMed.
- C. Massue, V. Pfeifer, X. Huang, J. Noack, A. Tarasov, S. Cap and R. Schlögl, ChemSusChem, 2017, 10, 1943–1957 CrossRef CAS PubMed.
- S. Cherevko, S. Geiger, O. Kasian, A. Mingers and K. J. J. Mayrhofer, J. Electroanal. Chem., 2016, 774, 102–110 CrossRef CAS.
- S. Geiger, O. Kasian, B. R. Shrestha, A. M. Mingers, K. J. Mayrhofer and S. Cherevko, J. Electrochem. Soc., 2016, 163, F3132–F3138 CrossRef CAS.
- V. A. Saveleva, L. Wang, D. Teschner, T. Jones, A. S. Gago, K. A. Friedrich, S. Zafeiratos, R. Schlögl and E. R. Savinova, J. Phys. Chem. Lett., 2018, 9, 3154–3160 CrossRef CAS PubMed.
- J. O. Bockris, J. Chem. Phys., 1956, 24, 817–827 CrossRef CAS.
- J. Rossmeisl, Z. W. Qu, H. Zhu, G. J. Kroes and J. K. Nørskov, J. Electroanal. Chem., 2007, 607, 83–89 CrossRef CAS.
- Z. Pavlovic, C. Ranjan, Q. Gao, M. van Gastel and R. Schloegl, ACS Catal., 2016, 6, 8098–8105 CrossRef CAS.
- E. Willinger, C. Massué, R. Schlögl and M.-G. Willinger, J. Am. Chem. Soc., 2017, 139, 12093–12101 CrossRef CAS PubMed.
- J.-P. Grote, A. R. Zeradjanin, S. Cherevko and K. J. J. Mayrhofer, Rev. Sci. Instrum., 2014, 85, 104101 CrossRef PubMed.
Footnotes |
| † Electronic supplementary information (ESI) available. See DOI: 10.1039/c9ee01872g |
| ‡ O. K. and S. G. contributed equally to this work. |
| § Present address: Deutsches Zentrum für Luft- und Raumfahrt, 70569 Stuttgart, Germany. |
| This journal is © The Royal Society of Chemistry 2019 |