 Open Access Article
Creative Commons Attribution 3.0 Unported Licence
Correction: Endoplasmic reticulum targeting tumour selective photocytotoxic oxovanadium(IV) complexes having vitamin-B6 and acridinyl moieties
Samya
Banerjee
a,
Akanksha
Dixit
b,
Anjali A.
Karande
*b and
Akhil R.
Chakravarty
 *a
*a
aDepartment of Inorganic and Physical Chemistry, Indian Institute of Science, Bangalore 560012, India. E-mail: arc@iisc.ac.in; Tel: +91-80-22932533
bDepartment of Biochemistry, Indian Institute of Science, Bangalore 560012, India. E-mail: anjali@iisc.ac.in; Tel: +91-80- 22932306
First published on 11th October 2019
Abstract
Correction for ‘Endoplasmic reticulum targeting tumour selective photocytotoxic oxovanadium(IV) complexes having vitamin-B6 and acridinyl moieties’ by Samya Banerjee et al., Dalton Trans., 2016, 45, 783–796.
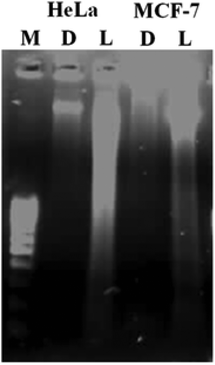
The authors apologize that incorrect images were presented in Fig. 7(a) and 10 (complex 4, MCF-7 panels d–f). The concerned images in Fig. 7(a) and 10 of this paper were adapted from Fig. 3(b) and 4, respectively, of the associated communication previously published by the same research group in Chemical Communications (cited as ref. 25 in the original article). The errors in the communication are also being rectified through publication of a correction notice.
The images have been reviewed by an independent expert and this correction does not alter the conclusions presented in this Dalton Transactions article.
The corrected version of Fig. 7(a) and 10(d–f) are shown here.
In addition, Fig. 12 of this Dalton Transactions paper is adapted from Fig. 5 of ref. 25. Data for complexes 1 and 4 in Table 5 and Fig. 6 were also reproduced from Table 1 and Fig. 3a, respectively, of ref. 25. Ref. 25 is given below as ref. 1.
The reproduced data in Fig. 6, 7(a), 10, 12 and Table 5 were provided for reader's information however, the authors apologise for not correctly attributing the data and figures to their original source.
The authors would like to apologize for these errors and for any inconvenience caused.
The Royal Society of Chemistry apologises for these errors and any consequent inconvenience to authors and readers.
References
- S. Banerjee, A. Dixit, R. N. Shridharan, A. A. Karande and A. R. Chakravarty, Chem. Commun., 2014, 50, 5590–5592 RSC.
| This journal is © The Royal Society of Chemistry 2019 |


