 Open Access Article
Creative Commons Attribution 3.0 Unported Licence
Preparation of cobalt borides by solid–gas reactions†‡
Anne
Henschel
 *,
Michael
Binnewies
,
Marcus
Schmidt
,
Ulrich
Burkhardt
,
Yurii
Prots
 and
Yuri
Grin
Max-Planck-Institut für Chemische Physik fester Stoffe, Dresden, Germany. E-mail: Anne.Henschel@cpfs.mpg.de
First published on 19th November 2019
Abstract
The reaction of Co with gaseous BBr3 in a temperature range of 700 to 1000 °C was studied using the hot-wire method with an experimental set-up reminiscent of the van Arkel–de Boer method. The borides Co2B und CoB form as layers on the surface of elemental cobalt. The influence of pressure, temperature and time on the reaction rate and on the composition of the borides was investigated. The reaction rate is significantly decreased by small amounts of an inert gas. The adjustment of reaction conditions allows to obtain single-phase and well-crystallized bulk materials of Co2B or CoB.
Introduction
Cobalt–boron compounds are currently of considerable interest for various reasons. They are of note in medical technology as coatings on the surface of CoCrMo alloys1,2 and equally as anode materials in batteries.3–5 Cobalt borides are used as catalysts for reduction reactions in synthetic organic chemistry.6–9 Also in hydrogenation and dehydrogenation reactions of various kinds, Co–B compounds find increasing interest as catalysts.10–13 More recent studies demonstrate the possibilities of using cobalt–boron compounds in different areas of hydrogen technology. On the one hand, they are being investigated in the catalytic cracking of natural gas into its constituent elements as a means of obtaining hydrogen without CO2 emissions associated with the steam reforming process.14 On the other hand, Co–B compounds can apparently be applied as particularly efficient catalysts in water splitting, more specifically in hydrogen evolution reactions (HERs).15,16In addition to the classic preparation routes for intermetallic borides,17–19 several new methods have recently been developed which in particular make cobalt borides accessible to the above-mentioned applications. Several Co–B materials have been prepared by the reduction of different cobalt salts with NaHB4 in aqueous media at low temperatures,10–13 in alkali metal halide melts (KCl/LiCl) at elevated temperatures20 and in solid-state reactions near room temperature.21 In addition numerous nanoscale, single-phase transition metal borides have been prepared by the reaction of boron with a transition metal halide in liquid tin. In these reactions metal borides and volatile SnCl2 are formed.22
Widespread interest in cobalt borides has prompted the application of the hot-wire method, a technique for the preparation of single-phase and chemically pure transition metal borides,23,24 also to the synthesis of cobalt–boron compounds. In this method metals react with high-purity gaseous boron trihalides (preferably BBr3) at elevated temperatures. The respective metal wire is heated by electrical current in the presence of boron tribromide and brought to reaction. The reaction proceeds with the formation of solid metal borides and volatile metal halides, which therefore leave the reaction front. In addition this crucible-free procedure prevents contamination.
The phase diagram of the Co–B system,25 partially amended in ref. 26, is characterized by the formation of three compounds Co3B, Co2B and CoB (Fig. 1). Co2B and CoB are congruently melting compounds. Co3B exists in a limited temperature range; it is formed peritectically at 1125 °C and decomposes peritectoidally into Co and Co2B at 845 °C. The formation of Co3B from Co and Co2B seems to be kinetically inhibited and was observed at 870 °C only after 100 h treatment.26
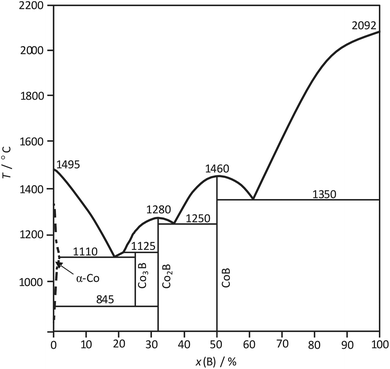 | ||
| Fig. 1 Assessment of the Co–B phase diagram according to ref. 25 and 26. | ||
The aim of this work is to investigate which of the cobalt borides can be obtained by means of the hot-wire method. In particular, the influence of the partial pressure ratio of BBr3 to argon is investigated.
Experimental
Synthesis
The experimental set-up was previously described in the studies on the Hf–B system.23 The synthesis of cobalt borides via the hot-wire method was conducted using a cobalt wire (99.995%, Alfa Aesar, 1 mm diameter) and boron tribromide (99.995%, Sigma Aldrich). The cobalt wire in a glass flask (V = 0.5 l) was heated to reaction temperature (pyrometric control) by electrical current and reacted with boron tribromide vapour (p(BBr3) = 94 mbar) in the presence of argon (p1 = 1.9 mbar; p2 = 19 mbar; p3 = 190 mbar). Various experiments on this and other metal–boron systems have shown that an argon pressure of only a few millibars leads to the reactions proceeding less vehemently than in a pure boron tribromide atmosphere.The temperature of the hottest section of the wire (about 3 cm) was measured pyrometrically and kept constant; the temperature of the flask wall was only slightly higher than room temperature. The characterization findings always refer to the hottest section of the wire.
X-ray powder diffraction (PXRD)
The obtained samples were characterized by means of the Guinier technique (Huber Image Plate Guinier camera G670, CoKα1 radiation, λ = 1.78900 Å, 4° ≤ 2Θ ≤ 100°). For the refinement of the lattice parameters, CeO2 (NIST certified Standard Reference Material 674a, a = 5.411102 Å ± 0.000097 Å) was used as the internal standard. The lattice parameters were refined by means of the program package WinCSD.27 The theoretical patterns of Co2B and CoB were calculated by means of the program package WinXPOW.28Single-crystal X-ray diffraction
A well-shaped single crystal (platelet, 0.025 × 0.060 × 0.005 mm3) was extracted from the surface of the reacted wire and mounted on a glass capillary. Data collection was performed on a Rigaku AFC7 diffractometer equipped with a Saturn 724+ CCD detector (MoKα radiation, λ = 0.71073 Å, oscillating range 0–360°, Δϕ = 1.0°). The absorption correction of the collected intensities was performed by using a multi-scan routine.29Wavelength-dispersive X-ray spectroscopy (WDXS)
Wavelength dispersive X-ray spectroscopy (WDXS) on an electron microprobe (Cameca SX100) was applied to characterize the wires after the preparation using the hot-wire method in respect of phase composition, phase distribution and contamination with other elements. Cross-sections parallel and perpendicular to the wire axis were prepared by the metallographic method suitable for hard materials like CoB and Co2B.The wires were mounted in an electrically conductive resin (PolyFast, Struers) and central specimen force was applied during the automatic polishing process (Buehler Ecomet 250pro) to achieve almost planar cross-sections at interfaces with large differences in hardness like the wire-surface/resin interface. The investigation of the Boron content by WDXS demands very plane cross-sections due to the high surface sensitivity of the yield of the BKα X-ray line.
The so-obtained parallel cross-section reveals the phase distribution along a representative portion of the processed wire. Radial X-ray line scans using the CoLα and BKα lines are recorded across the surface layers. Steps in intensity curves prove qualitatively the formation of Co–B phases with a spatial resolution of approx. 5 μm. The line scans are recorded at an acceleration voltage of 7 kV, a beam current of 100 nA and a step size of typically 0.5 μm. X-ray detectors are equipped with monochromator crystals of TAP (thallium acid phthalate, d = 12.8 Å) and PC3 (Mo/B4C multilayer; d = 102 Å) suitable for selecting CoLα (E = 775 eV) and BKα (E = 183 eV) radiation, respectively. In the case of sufficiently broad and homogenous surface layers, quantitative analysis was performed using the standard materials Ni3B (w(Ni) = 94.22%, w(B) = 5.78%) and elemental cobalt.
Electron backscatter diffraction (EBSD)
In some cases, Electron Backscatter Diffraction (EBSD) was used as a second, independent method for spatially resolved phase identification.Microstructural and local crystallographic characterization studies were performed using a field emission gun SEM (JEOL JSM 7800F) equipped with an EBSD acquisition camera (Bruker, e−-FlashHR detector). Kikuchi patterns were recorded at an acceleration voltage of 15 kV and a sample detector distance of 18 mm. The software CrystalAlign 400 was used for phase assignment30,31 employing crystallographic data for CoB and Co2B. Standardized structural data (CIF-format) were taken from the ICSD repository.
Ion chromatography
The obtained borides were analysed via ion chromatography for potential bromine impurities. An ion chromatograph (Dionex ICS-1000) with a coupled furnace (Envirotech AQF-100) was used for this purpose. The samples were incinerated in ceramic boats and the emerging combustion gas was fed into an absorption solution (an aqueous solution with sulphate as the internal standard), which was subsequently separated in the column of the ion chromatograph (IonPac AS14A-5 μm, with pre-column). A row of standard solutions with 0.1 to 10 ppm bromide content and sulphate as the internal standard were used for calibration. The limit of detection was w = 0.01%.Thermodynamic calculations
The calculation of the equilibrium state was performed using the GMin method (program package TRAGMIN;32 the used thermodynamic data can be found in the ESI‡).Results and discussion
Using the hot-wire method, the phase formation in the cobalt–boron system was studied depending on the reaction parameters of pressure, temperature and time.Reaction temperatures, varying from 700 °C to 1000 °C, are significantly lower than those in typical melting-of-element techniques. The reaction times were between 1 min and 48 h. The atmosphere in the experimental setup consisted of boron tribromide (saturation vapour pressure at 25 °C, 94 mbar) and argon with three different partial pressures (1.9 mbar, 19 mbar and 190 mbar). A condensate of green CoBr2 is formed immediately after the start of the reaction in the cold areas of the reactor. The sublimation of CoBr2 formed on the wire surface is increasingly suppressed by decreasing temperatures. Potential contamination of the borides with CoBr2 was excluded by ion chromatography.
Only the phases Co2B and CoB were observed in the experiments. The results are summarized in Table 1.
| p(Ar)a/mbar | T wire /°C | t | Present phases according to WDXS | PXRD results | Lattice parameters | ||
|---|---|---|---|---|---|---|---|
| a/Å | b/Å | c/Å | |||||
| a p(Ar) – argon partial pressure; Twire – temperature of the wire according to the pyrometer; t – reaction duration. b Single-crystal X-ray diffraction. | |||||||
| 1.9 | 700 | 5 min | Co, Co2B, CoB | majority phase: Co2B | — | — | — |
| minority phase: CoB | — | — | — | ||||
| 30 min | Co, Co2B, CoB | majority phase: CoB | 5.2474(5) | 3.0448(2) | 3.9537(2) | ||
| minority phase: Co2 | — | — | — | ||||
| 1 h | Co, Co2B, CoB | majority phase: CoB | 5.2500(5) | 3.0445(2) | 3.9538(2) | ||
| minority phase: Co2B | — | — | — | ||||
| 4 h | CoB (hollow tube) | CoB | 5.2487(6) | 3.0445(3) | 3.9530(3) | ||
| 800 | 30 min | CoB (hollow tube) | CoB | 5.2475(9) | 3.0450(4) | 3.9535(4) | |
| 900 | 1 min | Co, Co2B | layer too thin for analysis | ||||
| 1000 | 1 min | Co, Co2B, CoB | layer too thin for analysis | ||||
| 5 min | Co, Co2B, CoB | layer too thin for analysis | |||||
| 19 | 800 | 1 h | Layer too thin for analysis | layer too thin for analysis | |||
| 4 h | Co, Co2B | layer adhering too tight to the metal surface | |||||
| 8 h | Co, Co2B | Co2B | 5.0145(2) | — | 4.2191(3) | ||
| 24 h | Co, Co2B | Co2B | 5.0145(1) | — | 4.2188(2) | ||
| 64 h | CoB (hollow tube) | CoB | 5.2478(4) | 3.0449(2) | 3.9541(2) | ||
| 190 | 950 | 48 h | — | Co2Bb | 5.014(3) | — | 4.221(3) |
Considerable progress of the reaction can be observed at 700 °C. At complete conversion (e.g.Fig. 2), the reaction of cobalt with boron tribromide leads to single-phase monoboride CoB according to the general reaction equation:
| 5Co(s) + 2BBr3(g) → 2CoB(s) + 3CoBr2(g) | (1) |
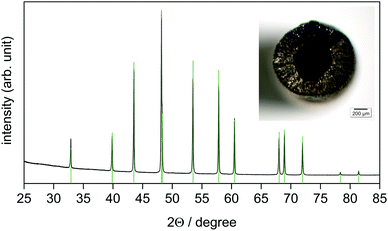 | ||
| Fig. 2 The X-ray powder diffraction pattern (CoKα1 radiation) of the reaction product obtained at 800 °C after 30 min, p(BBr3) = 94 mbar, p(Ar) = 1.9 mbar. Reflection positions (green ticks) and the relative intensities of CoB were calculated using the refined lattice parameters (Table 1) and the atomic coordinates according to ref. 33, respectively. The inset shows the reaction product as a hollow tube with a diameter of 1.2 mm. | ||
The powder XRD pattern (Fig. 2) reveals the orthorhombic lattice of structure type FeB. The lattice parameters a = 5.2475(9) Å, b = 3.0450(4) Å, and c = 3.9535(4) Å (Table 1) are in good agreement with the literature data a = 5.243–5.270 Å, b = 3.037–3.045 Å, and c = 3.948–3.955 Å.33–38 CoB remains in the form of a mechanically stable, but brittle and porous tube (Fig. 2).
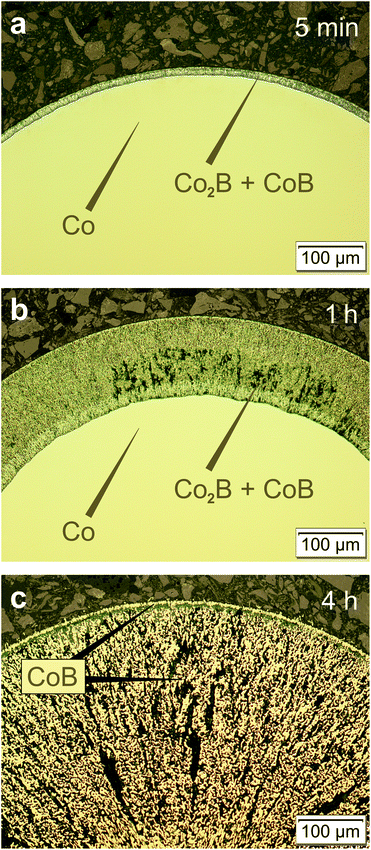
The reaction between cobalt and boron tribromide can be applied to synthesize single-phase CoB within a relatively short time and at moderate temperatures. On the other hand, according to the phase diagram, cobalt is not in equilibrium with CoB at 700 °C but with Co2B. In order to obtain more detailed information about the course of the reaction, experiments were conducted with shorter reaction times. After a reaction time of 5 min (700 °C), a thin layer of products grew consisting of two phases: a layer of Co2B formed on the metal core surrounded by a thinner CoB layer (Fig. 3a). This situation (composition and order) is in accordance with the phase diagram (Fig. 1). With increasing reaction time, the thickness of the boride layer increases, whereas that of Co2B decreases (Fig. 3b). Complete conversion of the cobalt wire is achieved after 4 h. The formed product now consists exclusively of CoB (Fig. 3c). Investigations by X-ray diffraction show that the lattice parameters of CoB do not change for different preparation conditions (Table 1), and thus CoB forms with a constant composition.
The best possible, spatially resolved characterisation of the co-existing phases was achieved using the EBSD technique. For the sample obtained after 5 min at 700 °C (Fig. 3a), the ratio of the measured intensities of the CoLα and BKα signals reflects the molar ratio of the elements in Co2B and CoB (Fig. 4a and b). Using EBSD, the phases Co2B and CoB were clearly spatially distinguished (Fig. 4c).
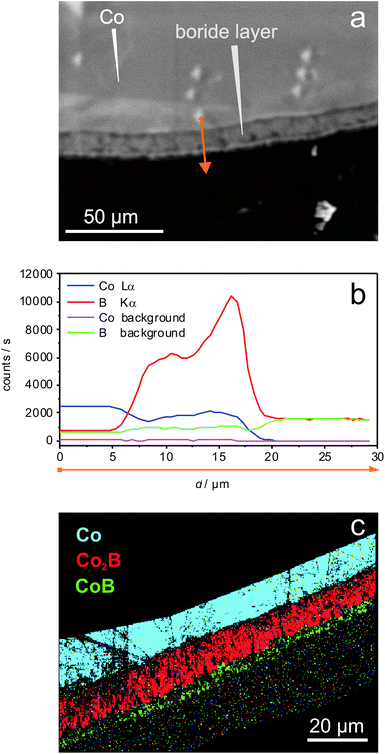 | ||
| Fig. 4 Characterisation of the reaction product of the reaction between Co(s) and BBr3(g) (5 min at 700 °C, p(BBr3) = 94 mbar, p(Ar) = 1.9 mbar), cf. Fig. 3a. (a) Cross-section (SEM image, BSE contrast); (b) the corresponding WDXS linescan (measurement along the orange arrow) with the plateau at the Co2B phase and increased B intensity at the outermost surface layer indicating the formation of the CoB surface layer with thickness close to the electron probe diameter of approx. 5 μm; and (c) phase distribution according to EBSD: section of the core (blue) – Co, inner layer (red) – Co2B, outer layer (green) – CoB. | ||
The formed cobalt borides are obviously porous and allow further continuous access of BBr3 vapor as well as the removal of CoBr2 (Fig. 5).
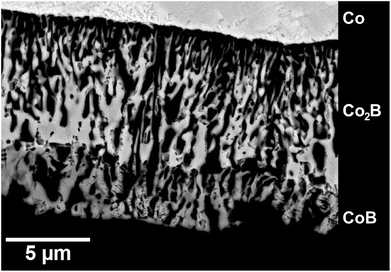 | ||
| Fig. 5 The microstructure of the reaction product obtained after 5 min at 700 °C (p(BBr3) = 94 mbar, p(Ar) = 1.9 mbar; BSE image). | ||
Further experiments have shown that the situation essentially does not change at temperatures of up to 1000 °C. Merely one short-term experiment (900 °C, 1 min) proves the formation of Co2B on the wire surface at the beginning of the reaction, as described in eqn (2):
| 7Co(s) + 2BBr3(g) → 2Co2B(s) + 3CoBr2(g) | (2) |
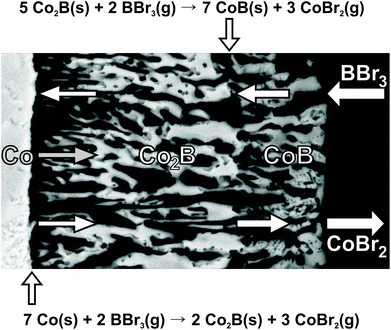
The spatially resolved phase analysis of the different samples shows that Co2B is converted to CoB in a consecutive reaction with BBr3:
| 5Co2B(s) + 2BBr3(g) → 7CoB(s) + 3CoBr2(g) | (3) |
To be able to describe the above reactions, it was necessary to calculate the composition of the gas phase for the equilibrium state. Thus, it is possible to evaluate the crucial gaseous species for the reaction between cobalt and boron tribromide. Whether this is the metal boride or free bromine is not self-explanatory, which became especially clear in former investigations on the tungsten–boron system.24 The results of the calculations for the region of coexistence between Co and Co2B (Fig. 6) suggest the formation of Co2B and give an indication as to the composition of the gas phase as a function of temperature. It is evident that BBr3 is largely consumed in the formation of CoBr2. Free bromine (Br, Br2) and BBr practically do not occur. Based on the calculated composition of the gas phase, it is possible to formulate the essential underlying reactions (1)–(3) as stated above.
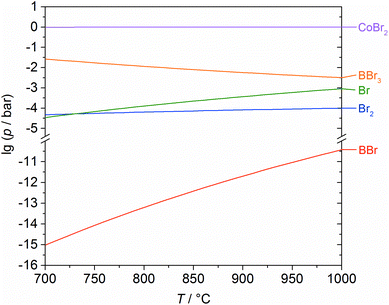 | ||
| Fig. 6 Partial pressures as a function of temperature (for the equilibrium state) of the occurring gas species for the reaction of cobalt with boron tribromide, calculated using the GMin method. | ||
The goal of further experiments was to obtain phase-pure Co2B as bulk material using the hot-wire method. Since the variation of temperature and reaction time did not lead to significant amounts of single-phase Co2B, experiments were conducted with a different ratio of boron tribromide and argon partial pressure. Comparing eqn (1) and (2), the formation of Co2B should be favoured with a lower initial partial pressure of BBr3.
The original BBr3 pressure was kept at about 94 mbar, while the argon pressure was increased to 19 mbar. The experiments were conducted at 800 °C. This significantly decreases the reaction rate. For reaction times of up to 24 h, the exclusive formation of phase-pure Co2B on the surface was observed (Fig. 7). For considerably longer reaction times at 800 °C, the formation of CoB according to eqn (3) was observed after complete consumption of elemental cobalt (Table 1).
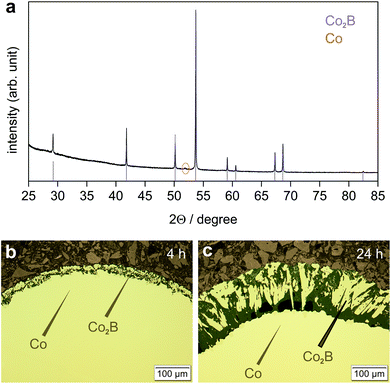 | ||
| Fig. 7 Products of the reaction between Co(s) and BBr3(g) obtained at 800 °C (p(BBr3) = 94 mbar, p(Ar) = 19 mbar); (a) X-ray powder diffraction pattern (CoKα1 radiation) after 24 h; the presence of elemental cobalt (orange tick) is due to sample preparation for PXRD; reflection positions (violet ticks) and their relative intensities of Co2B were calculated using lattice parameters from Table 1 and atomic coordinates from Table 2; (b) Microstructure of the reaction product after 4 h; and (c) Microstructure of the reaction product after 24 h. Single-phase Co2B layers on a Co core adhering tightly to the metal surface (b) become more porous after longer reaction time (c). Infiltrated mounting resin (dark) stabilizes the porous Co2B surface layer. Optical micrographs (bright field contrast) are shown. | ||
Since this change in the partial pressure ratio of BBr3 to argon significantly influenced the reaction course, a further decrease of the reaction rate was expected at an increased argon pressure of 190 mbar.
The original BBr3 pressure at about 94 mbar was retained. A reaction temperature of 950 °C was chosen. After 48 h single crystals had grown on the wire surface (Fig. 8), and they were identified as Co2B via single-crystal X-ray diffraction.
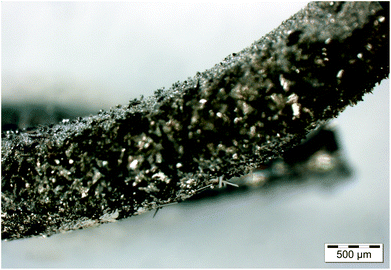 | ||
| Fig. 8 The reaction product obtained at 950 °C after 48 h (p(BBr3) = 94 mbar, p(Ar) = 190 mbar). Co2B crystals have grown on the surface of the wire. An optical micrograph is shown. | ||
Using the hot-wire method, it is therefore possible to obtain Co2B in a single-phase form by controlling the reaction parameters. Even single crystals were grown. Investigations by X-ray diffraction show that the lattice parameters obtained for different preparation conditions agree well with the literature data (a = 5.006–5.024 Å and c = 4.212–4.228 Å (ref. 39)) and are equal within one estimated standard deviation. Thus, Co2B also forms with a constant composition and its crystal structure is not influenced by the preparation conditions in the parameter region studied.
Because the crystal structure of Co2B (space group I4/mcm, structure type Al2Cu40) was investigated before by employing X-ray powder diffraction information34,41 or single-crystal data with film registration of diffraction intensities,40 respectively, here it was re-determined using single-crystal diffraction data (MoKα radiation). The final crystallographic data (Tables 1 and 2) are in agreement with literature information, in particular with ref. 40.
| Atom | Site | x | y | z | B(eq.) /Å2 |
|---|---|---|---|---|---|
a
B(eq) = 1/3·[B11·a*2·a2 + B22·b*2·b2 + B33·c*2·c2 + 2·B12·a*·b*·a·b·cos![[thin space (1/6-em)]](https://www.rsc.org/images/entities/char_2009.gif) γ + 2·B13·a*·c*·a·c·cos γ + 2·B13·a*·c*·a·c·cos![[thin space (1/6-em)]](https://www.rsc.org/images/entities/char_2009.gif) β + 2·B23·b*·c*·b·c·cos β + 2·B23·b*·c*·b·c·cos![[thin space (1/6-em)]](https://www.rsc.org/images/entities/char_2009.gif) α]. α].
|
|||||
| Co1 | 8h | 0.1663(2) | x + 1/2 | 0 | 0.45(3) |
| B1 | 4a | 0 | 0 | 1/4 | 0.56(14) |
The reaction of Co with BBr3 proceeds with the formation of Co2B, CoB and gaseous CoBr2. CoBr2 condenses on the cold reactor walls and is therefore continuously removed from the reaction space i.e. the hot wire. Both reactions (2) and (3) yielding CoB and Co2B run in parallel (Fig. 9). The formation of CoB from Co2B and BBr3 occurs significantly faster than the formation of Co2B from Co and BBr3 most probably due to the lower amounts of boron tribromide available at the front of reaction (2) (diffusion control). For this reason, Co2B was mostly found only as a minority product as long as elemental cobalt is still present. Once the elemental cobalt metal is consumed (reaction (2) does not take place anymore), the remaining Co2B reacts with BBr3 to form CoB, yielding a single-phase product. For longer reaction times, the reaction thus always results in single-phase CoB (Table 1).
Increasing the argon pressure by one or two magnitudes from 1.9 to 19 mbar or to 190 mbar respectively significantly influences the behaviour of the reaction system. The rates of both reactions taking place are notably reduced.
A possible explanation for the drastic decrease of the reaction rate is the dilution of the reactive gas BBr3 by the added argon. A saturation vapour pressure of 94 mbar adjusts itself in the storage vessel of BBr3, whereas on the wire surface the BBr3 pressure is much lower (about 10−2 bar, Fig. 6). Thus, the BBr3 pressure has a gradient of 4 orders of magnitude within the reaction vessel. Consequently, the dilution effect caused by the added argon might be substantial in the zone close to the reaction area.
Another explanation is the formation of a so-called Langmuir layer.42 The observations recall the processes in light bulbs, which have been most extensively studied. In the first light bulbs, a filament in an evacuated glass bulb was heated by electrical current. The material of the filament (C, W) quickly evaporated, causing the filament to burn within a short time and the bulb walls to blacken with the condensed filament material. Only filling the lamps with an inert gas minimized the transport of the material and increased the efficiency and lifespan of light bulbs notably.43 The reduction of the transport of the material is amongst other things a result of the formation of the Langmuir layer.42 This is a quasi-stationary gas layer around the filament resulting from the increasing viscosity of gases with rising temperature. While the Langmuir layer does not influence the sublimation equilibrium of the filament material, it does notably affect the transport of the evaporated material.42,43
The conditions in the hot-wire experiments with increased argon pressure resemble those in gas-filled light bulbs. This allows the assumption that the removal of CoBr2 from the reaction area to the colder regions of the reactor is greatly reduced. This suppresses both reactions (2) and (3).
The reduced rate of the primary reaction (2) supports the single crystal growth at the reaction front 2 (Fig. 8). Larger faces of the crystallites make the Co2B material denser, suppressing the further diffusion of BBr3 into the reaction front which justifies the long reaction time required for the reaction process. On the other hand, the reactivity of intermetallic compounds depends strongly on chemical bonding and may strongly differ for different crystallographic directions, causing complete passivation in some environments. Recently this has been shown for the behaviour of CaAg under epoxidation conditions.44 Thus, the single-crystal microstructure of the Co2B layer at lower BBr3 pressures may also suppress the further reaction toward CoB.
The formation of hollow morphologies in solids was thoroughly examined in the field of nanotechnology (nanotubes and hollow nanoparticles).45 In solid-state reactions, the Kirkendall effect caused by diffusion processes plays a crucial role.46,47 At shorter reaction times the diffusion of BBr3 into the reaction front is not much hindered due to the small thickness and porosity of the reaction product layers. Thus, the reaction front moves inwards. For longer reaction times and at lower concentration of BBr3 in the gas phase (higher partial pressures of argon), the diffusion of BBr3 into the reaction front is suppressed. So the diffusion of cobalt into the reaction front is stronger, and the latter moves outwards (Fig. 9). The size of the final hole is smaller than the initial diameter of the cobalt wire, indicating indeed different movements of the reaction front at different time points and concentrations in the gas phase.
In all experiments described herein as well as a series of other experiments, the formation of Co3B was not observed. Since the experiments performed with the hot-wire method have been conducted at notably short reaction times, the absence of the high-temperature phase Co3B requiring longer isothermal treatments can be understood.26
Conclusions
The cobalt borides Co2B and CoB form in the reaction of elemental cobalt with gaseous boron tribromide using the hot-wire method in a closed reactor. The total behaviour of the system depends on the rates of the sequential formation reaction of Co2B from Co and BBr3 and CoB from Co2B and BBr3, as well as on the diffusion of BBr3 into the reaction fronts and the diffusive removal of the CoBr2 by-product from the fronts. Depending on the reaction parameters (temperature, time and pressure), both phases – Co2B and CoB – were obtained in the form of concentric layers around the Co core. By an appropriate choice of conditions, both compounds are obtained as single-phase and well crystallized bulk materials. In the case of Co2B, even single crystals were obtained. The reaction rates are significantly influenced by the partial pressure of boron tribromide and the presence of an inert gas; they can thus be controlled by the ratio of their partial pressures. This also affects the composition of the formed borides. The slower the precipitated layers are formed, the denser and stronger adhering they are.Conflicts of interest
There are no conflicts to declare.Acknowledgements
The authors would like to thank Dr. H. Borrmann and S. Hückmann for X-ray powder diffraction experiments, S. Kostmann for metallographic preparations, M. Eckert for WDXS measurements and U. Schmidt for chemical analysis (ion chromatography). Open Access funding provided by the Max Planck Society.References
- I. Campos-Silva, D. Bravo-Bárcenas, H. Cimenoglu, U. Figueroa-López, M. Flores-Jiménez and O. Meydanoglu, Surf. Coat. Technol., 2014, 260, 362 CrossRef CAS.
- I. Campos-Silva, D. Bravo-Bárcenas, A. Meneses-Amador, M. Ortiz-Dominguez, H. Cimenoglu, U. Figueroa-López and J. Andraca-Adame, Surf. Coat. Technol., 2013, 237, 402 CrossRef CAS.
- Y. Bai, C. Pang, W. Hu, F. Wu, C. Wu, L. Yang and L. Bao, J. Renewable Sustainable Energy, 2013, 5, 021401 CrossRef.
- Y. Wang, L. Li, Y. Wang, D. Song, G. Liu, Y. Han, L. Jiao and H. Yuan, J. Power Sources, 2011, 196, 5731 CrossRef CAS.
- C. Wu, Y. Bai, X. Wang, F. Wu and C. Zhang, Solid State Ionics, 2008, 179, 924 CrossRef CAS.
- R. Paul, P. Buisson and M. N. Joseph, C. R. Acad. Sci., Ser. Gen. Vie Sci., 1951, 232, 627 CAS.
- T. Satoh, S. Suzuki, Y. Suzuki, Y. Miyagi and Z. Imai, Tetrahedron Lett., 1969, 10, 4555 CrossRef.
- T. Satoh, S. Suzuki, T. Kikuchi and T. Okada, Chem. Ind., 1970, 1626 CAS.
- J. M. Pratt and G. Swinden, J. Chem. Soc. D, 1969, 22, 1321 RSC.
- J. B. Nagy, I. Bodart-Ravet and E. G. Derouane, Faraday Discuss. Chem. Soc., 1989, 87, 189 RSC.
- Y. Z. Chen and K. J. Wu, Appl. Catal., 1991, 78, 185 CrossRef CAS.
- S. E. Skrabalak and K. S. Suslick, Chem. Mater., 2006, 18, 3103 CrossRef CAS.
- N. Kalyon, K. Hofmann, J. Malter, M. Lucas, P. Claus and B. Albert, J. Catal., 2017, 352, 436 CrossRef CAS.
- R. Fernandes, N. Patel, D. C. Kothari and A. Miotello, in Advanced Nanomaterials in Biomedical, Sensor and Energy Applications, ed. J. Chattopadhyay and R. Srivastava, Springer, Heidelberg, 2017 Search PubMed.
- S. Gupta, N. Patel, A. Miotello and D. C. Kothari, J. Power Sources, 2015, 279, 620 CrossRef CAS.
- J. Masa, P. Weide, D. Peeters, I. Sinev, W. Xia, Z. Sun, C. Somsen, M. Muhler and W. Schuhmann, Adv. Energy Mater., 2016, 6, 1502313 CrossRef.
- K. A. Schwetz, K. Reimuth and A. Lipp, Radex Rundsch., 1981, 3, 568 Search PubMed.
- W. G. Fahrenholtz, J. Binner and J. Zou, J. Mater. Res., 2016, 31, 2757 CrossRef CAS.
- B. Albert and H. Hillebrecht, Angew. Chem., Int. Ed., 2009, 48, 8640 CrossRef CAS PubMed.
- G. Gouget, D. P. Debecker, A. Kim, G. Olivieri, J.-J. Gallet, F. Bournel, C. Thomas, O. Ersen, S. Moldovan, C. Sanchez, S. Carenco and D. Portehault, Inorg. Chem., 2017, 56, 9225 CrossRef CAS PubMed.
- X. Wang, J. Liao, H. Li, H. Wang and R. Wang, J. Colloid Interface Sci., 2016, 475, 149 CrossRef CAS PubMed.
- P. R. Jothi, K. Yubuta and B. P. T. Fokwa, Adv. Mater., 2018, 30, 1704181 CrossRef PubMed.
- A. Henschel, M. Binnewies, M. Schmidt, H. Borrmann and Y. Grin, Chem. – Eur. J., 2017, 63, 15869 CrossRef PubMed.
- A. Henschel, M. Binnewies, M. Schmidt, R. Köppe, U. Burkhardt and Y. Grin, Chem. – Eur. J., 2018, 24, 10109 CrossRef CAS PubMed.
- J.-D. Schöbel and H. H. Stadelmaier, Z. Metallkd., 1966, 57, 323 Search PubMed.
- S. Omori and Y. Hashimoto, Mater. Trans., JIM, 1976, 17, 571 CrossRef CAS.
- L. Akselrud and Yu. Grin, J. Appl. Crystallogr., 2014, 47, 803 CrossRef CAS.
- WinXPow Software, Version 2.22, Stoe & Cie GmbH, Darmstadt, 2007 Search PubMed.
- R. H. Blessing, Acta Crystallogr., Sect. A: Found. Crystallogr., 1995, 51, 33 CrossRef PubMed.
- D. J. Dingley and S. I. Wright, J. Appl. Crystallogr., 2009, 42, 234 CrossRef CAS.
- Electron Backscatter Diffraction in Materials Science, ed. A. J. Schwartz, M. Kumar, B. L. Adams and D. P. Field, Springer, Berlin, 2nd edn, 2009 Search PubMed.
- G. Krabbes, W. Bieger, K.-H. Sommer, T. Söhnel and U. Steiner, Programmpaket TRAGMIN, Version 5.1, IFW Dresden, TU Dresden, HTW Dresden, 2014 Search PubMed.
- J. Wind, O. I. Romaniv, G. Schöllhammer, J. Bursik, H. Michor, G. Giester and P. Rogl, J. Phase Equilib. Diffus., 2014, 35, 43 CrossRef CAS.
- T. Bjurstroem, Ark. Kemi, Mineral. Geol., 1933, 11A(5), 1 Search PubMed.
- G. Pradelli, C. Gianoglio and E. Quadrini, Metall. Ital., 1978, 70, 122 CAS.
- K. Traore and J. P. Kappler, Bull. Soc. Chim. Fr., 1979, 1, 419 Search PubMed.
- P. Rogl, J. C. Schuster and H. Nowotny, Boron Steel, Proc. Int. Symp., 1980, 33 CAS.
- C. Gianoglio and E. Quadrini, Atti Accad. Sci. Torino, Cl. Sci. Fis., Mat. Nat., 1980, 114, 125 Search PubMed.
- P. Villars and K. Cenzual, Pearson's Crystal Data. Crystal Structure Data Base for Inorganic Compounds, ASM International, Materials Park, Ohio, USA, Release 2018/2019 Search PubMed.
- B. Aronsson, T. Lundström and I. Engström, Anisotropy Single-Cryst. Refract. Compd., Proc. Int. Symp., 1968, 1, 3 CrossRef CAS.
- E. E. Havinga, H. Damsma and P. Hokkeling, J. Less-Common Met., 1972, 27, 169 CrossRef CAS.
- I. Langmuir, J. Am. Chem. Soc., 1915, 37, 1139 CrossRef CAS.
- H. Schirmer, I. Stober and J. Friedrich, in Technisch-wissenschaftliche Abhandlungen der Osram-Gesellschaft, ed. A. Lompe, Springer, Berlin, Heidelberg, 1967, vol. 9 Search PubMed.
- I. Antonyshyn, O. Sichevych, K. Rasim, A. Ormeci, U. Burkhardt, S. Titlbach, S. A. Schunk, M. Armbrüster and Y. Grin, Inorg. Chem., 2018, 57(17), 10821 CrossRef CAS PubMed.
- H. J. Fan, U. Gösele and M. Zacharias, Small, 2007, 3, 1660 CrossRef CAS PubMed.
- E. O. Kirkendall, Trans. AIME, 1942, 147, 104 Search PubMed.
- A. D. Smigelskas and E. O. Kirkendall, Trans. AIME, 1947, 171, 130 Search PubMed.
Footnotes |
| † Dedicated to Professor Heinrich Oppermann on the occasion of his 85th birthday. |
| ‡ Electronic supplementary information (ESI) available. See DOI: 10.1039/C9DT03249E |
| This journal is © The Royal Society of Chemistry 2019 |

