
 Open Access Article
 This Open Access Article is licensed under a
 Creative Commons Attribution 3.0 Unported Licence
Investigations into the effects of linker length elongation on the behaviour of calcium-responsive MRI probes†
Liam
Connah
a,
Vincent
Truffault
b,
Carlos
Platas-Iglesias
 c and
Goran
Angelovski
*a
c and
Goran
Angelovski
*a
aMR Neuroimaging Agents, Max Planck Institute for Biological Cybernetics, 72076 Tuebingen, Germany. E-mail: goran.angelovski@tuebingen.mpg.de
bMax Planck Institute for Developmental Biology, 72076 Tuebingen, Germany
cCentro de Investigacións Científicas Avanzadas (CICA) and Departamento de Química, Facultade de Ciencias, Universidade da Coruña, 15071 A Coruña, Spain
First published on 25th July 2019
Abstract
Understanding the relationship between chemical structure and the effectiveness of bioresponsive magnetic resonance imaging (MRI) contrast agents can offer help to identify key components required for the future development of such probes. Here, we report the development and characterisation of two novel monomeric bifunctional chelators, L1 and L2, whose paramagnetic metal complexes can serve as calcium-responsive contrast agents. Specifically, relaxometric titrations, luminescence lifetime measurements, high resolution NMR and diffusion experiments, as well as density functional theory (DFT) calculations were carried out to assess the behaviour of each system. Minor structural differences between the probes resulted from the extension of the linker between the macrocyclic lanthanide chelator and the acyclic Ca-binding moiety. Relaxometric titrations of both systems, GdL1 and GdL2, showed an increase in r1 and r2 relaxivity upon Ca2+ addition, with the derivative bearing the longer linker showing a greater overall change. The hydration states of the europium analogues were assessed revealing a higher initial hydration state for EuL2. Diffusion ordered NMR spectroscopy revealed negligible changes in the diffusive properties of both systems upon the addition of Ca2+, while NMR studies of the Y3+, Yb3+ and Eu3+ analogues provided further insights into the structural behaviour of the linker unit in both the unsaturated and Ca-saturated states. DFT calculations supported the different coordination modes of the studied paramagnetic complexes in the presence and absence of Ca2+. Overall, our findings demonstrate the impact of subtle changes to the structure of such probes, affecting a range of properties and their coordination behaviour.
Introduction
Magnetic resonance imaging (MRI) is an essential diagnostic imaging technique used widely in clinics to provide three dimensional soft tissue images at high spatial resolution. In recent years, MRI has been a primary focus in the field of molecular imaging due to attempts to develop methods for the dynamic visualization of biological processes.1–4 The advancement of these so-called functional methods and the ability to monitor such changes can provide crucial information such as the function of tissues or organs in pathological states. Typically, MRI can be performed with or without the addition of a contrast agent (CA) unlike other imaging techniques. The inclusion of such a CA in MRI can provide greater specificity through the shortening of the T1 and T2 relaxation times of the protons in the immediate vicinity of the CA. Differing from conventional CAs, ‘smart’ or bioresponsive smart contrast agents (SCAs) are suitable for functional MRI (fMRI) studies and have been applied to monitor different environmental states as their MR properties fluctuate depending on their microenvironment. Many SCAs have been developed for a variety of functions including the monitoring of pH, specific metal ions (Ca2+, Zn2+) and enzymes.1,5,6 Typically, they are based on cyclen scaffolds complexed with paramagnetic ions, and possess protonable groups (i.e. pH sensors), an additional specific chelator for a desired analyte (e.g. Ca2+, Zn2+) or a moiety which can be affected by enzyme activity.7 As the mechanism of action, usually SCAs are either considered as ‘off–on’ or ‘on–off’ systems, meaning they alter their relaxometric properties to provide a significant difference between two different environmental states.5 One of the preferred targets is Ca2+ due to its significance in biological processes.8,9 These include a substantial involvement in critical cellular signalling events and an association with various pathologies including ischemia, Alzheimer's disease and epilepsy.10,11 Abilities to track Ca2+ fluctuations could prove useful in monitoring and understanding these pathological processes. Furthermore, due to the involvement of Ca2+ in neural activity, the development of Ca2+ sensing MRI probes could lead to the mapping of brain activity in a direct manner. Many attempts to develop Ca-responsive SCAs have been pursued over recent years resulting in the production of a variety of molecules ranging from smaller monomeric compounds to larger nano-sized derivatives.3,12,13 The desire to understand the relationship between SCA structure and relaxometric enhancement has brought about a series of studies investigating such effects, thus providing significant insights into the behaviour of these systems.14,15 Specifically, the interaction of the carboxylates from the Ca-binding chelate with the paramagnetic metal ion or the roles of the two stereoisomers, square antiprismatic (SAP) and twisted square antiprismatic (TSAP), of 1,4,7,10-tetraazacyclododecane-1,4,7-tris(methylenecarboxylic) acid (DO3A) macrocyclic chelators have revealed interesting coordination properties of these responsive systems. Furthermore, the influence of the distance between the MR reporting and bioresponsive units has shown to be significant in determining the relaxometric behaviour. Previous comparisons of bismacrocyclic Ca-responsive SCAs with either an ethyl or propyl linker between the DO3A MR reporting unit and the EGTA-derived Ca2+ chelator revealed such an effect.16 The propyl derivative showed an increased relaxometric enhancement (i.e. increase in longitudinal r1 relaxivity in the presence of Ca2+) versus the ethyl version with slightly different starting relaxivities and hydration states of the lanthanide complex. A more advanced coordination study with ethyl and propyl linker SCA model compounds demonstrated further the significant impact of the linker distance on the coordination properties of the complex.17 Here, it was evaluated that the shorter ethyl linker is likely to be too close to the paramagnetic metal centre hindering the interaction of the carboxylate group with Gd3+.Recently we reported a study where a series of G4 polyamidoamine (PAMAM) dendrimers conjugated to monomeric SCAs exhibited significant differences in the observed relaxometric properties. Amongst the studied nano-sized conjugates with different monomers, those with butyl and pentyl linkers connecting the common DO3A- and EGTA-derived chelators showed the greatest changes and outlook for potential future application.18 Intrigued by these results, we embarked on a detailed structural study of these two newly developed monomeric systems. Firstly, we prepared different pairs of diamagnetic and paramagnetic complexes, which allowed the initiation of different types of coordination chemistry studies. Through the use of a variety of techniques such as 1D and 2D NMR, luminescence lifetime measurements, diffusion ordered NMR spectroscopy (DOSY), density functional theory (DFT) calculations and proton relaxometric titrations, we aimed to characterize the newly developed probes and gain an insight into how subtle structural differences impact on their relaxometric and coordination behaviour.
Results and discussion
Synthesis and complexation of ligands
Protected nitro compounds 1 and 2 were synthesized following previously reported procedures.18 Subsequent deprotection with formic acid at 60 °C overnight yielded ligands L1 and L2 (Scheme 1). Complexation reactions of each ligand with either Yb3+, Eu3+, Gd3+ or Y3+ were all carried out under identical conditions. Specifically, the ligands L1 and L2 were dissolved in water and the pH adjusted to 7 through the addition of a 0.1 M NaOH solution. A slight excess of the required lanthanide chloride hydrate was added while maintaining the pH at 7 through further addition of 0.1 M NaOH. After the final addition, the reaction mixture was stirred overnight at room temperature. The removal of excess lanthanide was achieved by repeated treatment of the solution with Chelex® before filtering and lyophilizing to yield the final complexes, LnL1 and LnL2 (Ln = Gd3+, Yb3+, Eu3+ or Y3+).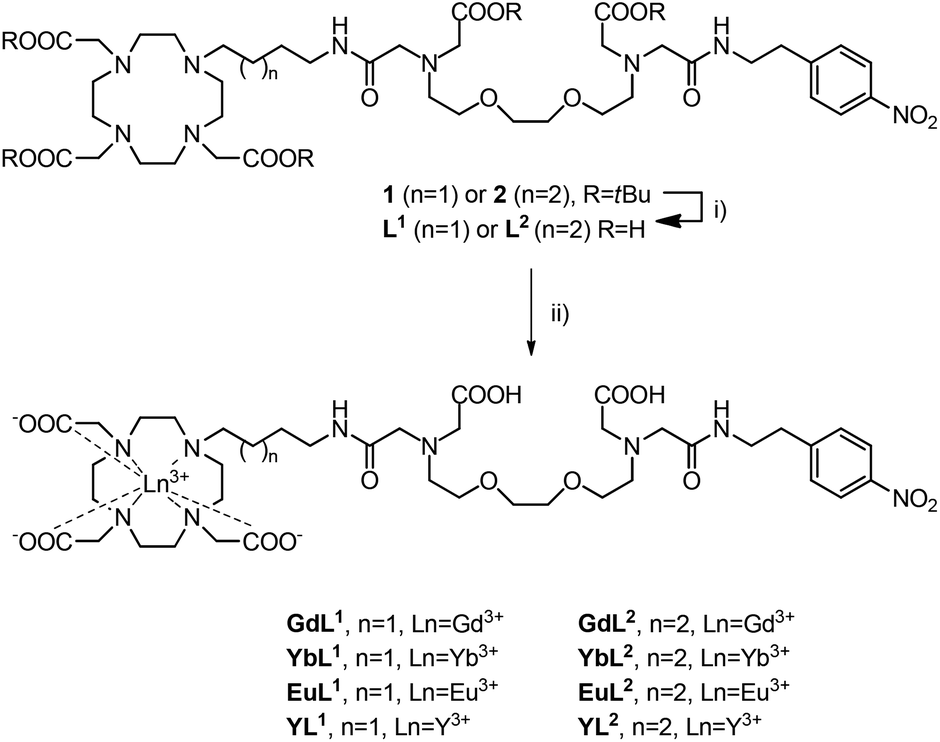 | ||
| Scheme 1 Synthesis of L1, L2 and the subsequent diamagnetic and paramagnetic complexes LnL1,2. Reagents and conditions: (i) HCO2H, 60 °C. (ii) LnCl3 hydrate, H2O, pH 7, RT, followed by Chelex®, RT. | ||
Relaxometric titrations
The relaxometric behaviour of both systems was assessed with proton longitudinal and transverse relaxometric titrations with GdL1 and GdL2. Each measurement was conducted with an identical initial concentration of Gd3+ (2.5 mM) at 25 °C and 7 T. The T1 and T2 relaxation times were recorded and the r1 and r2 relaxivities were calculated as a function of [Ca2+]. For GdL1 with the shorter butyl linker, the starting r1 was found to be 2.49 mM−1 s−1, which is slightly lower than that of the propyl derivative and other SCAs developed by us previously (Fig. 1a).13,19 Upon saturation with Ca2+, r1 increases to 4.96 mM−1 s−1 (99% increase). Concurrently, the change in r2 over the same [Ca2+] range was found to increase to the same relative extent, specifically from 3.19 to 6.62 mM−1 s−1 (Fig. 1b).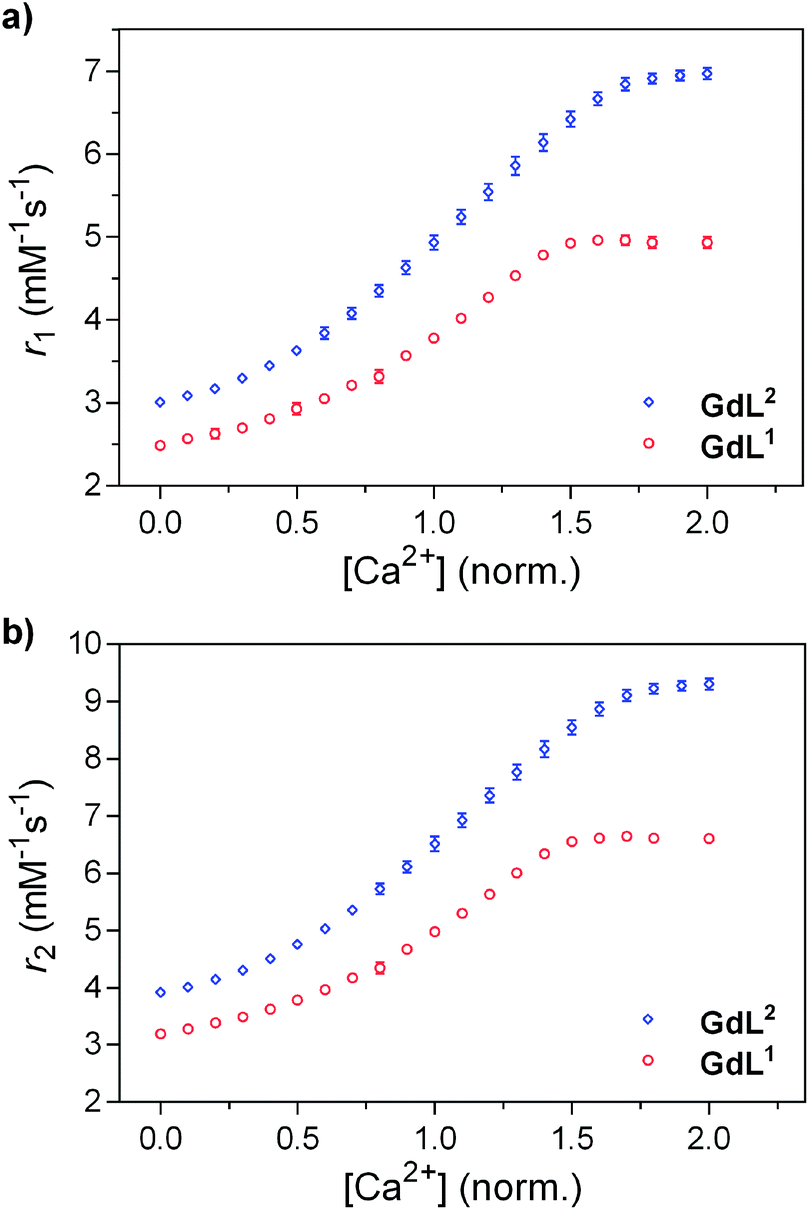 | ||
| Fig. 1 Relaxometric titration curves for GdL1 and GdL2 with Ca2+: (a) longitudinal (r1) and (b) transverse (r2) titrations. Conditions: [Gd3+] = 2.5 mM, pH = 7.4 (50 mM HEPES), 25 °C, 7 T. | ||
In comparison, GdL2 gave an initial r1 of 3.01 mM−1 s−1, which is in line with that of previously investigated SCAs (Fig. 1a).13 However, r1 reached a value of 6.97 mM−1 s−1 (131% increase) upon saturation with Ca2+. The change in r2 was determined to be from 3.92 to 9.31 mM−1 s−1 (138% increase). Concurrently, both r2/r1 ratios remained constant at the studied Ca2+ concentrations, indicating that the formation of the Ca-GdL1,2 complex is likely not followed by any size changes between the paramagnetic species in the absence and presence of Ca2+ (Fig. S1 in ESI†).19 It can also be observed that the initial relaxivity values in the absence of Ca2+ are lower for GdL1 than the other complexes studied, indicating a lower hydration state of the complex (see below) and a changed coordination environment of the carboxylate from the EGTA-derived component. Clearly, the linker length between the MR reporting moiety and the bioresponsive unit has significant effects on the relaxometric behaviour of the SCA.
High resolution 1H NMR studies
In order to understand and observe how the addition of Ca2+ impacts the structure and coordination environment of both derivatives, we conducted a series of high-resolution 1D and 2D NMR experiments at 800 MHz. Specifically, a series of diamagnetic and paramagnetic complexes were synthesised and studied at 20 mM concentration and pD 7.0. 1H-NMR, COSY and 13C-HSQC of the complexes were recorded, the peaks were assigned and the behaviour of specific groups in the absence and presence of Ca2+ was followed.We first assigned the relevant peaks that exhibited changes at different conditions (i.e. absence or presence of Ca2+), excluding the resonances of the methylene groups neighbouring the amines of the EGTA-derived chelator. These were not observable in the recorded spectra, likely due to exchange processes related to the partial deprotonation of the amine groups at the studied pD.15 Furthermore, we noticed that the differences between the two states (without Ca2+/with Ca2+) exist only in the linker between the MR reporting and bioresponsive moiety; hence more detailed analysis followed only for this structural region. The 13C-HSQC spectra of the diamagnetic derivatives (YL1 and YL2) were the most informative, with the obtained results then being compared to the paramagnetic complexes EuL1,2 and YbL1,2. For the butyl derivative, YL1, the closest (A1) and furthest (D1) methylene units to the macrocycle ring show a minor shift upon the addition of Ca2+ (Fig. 2). On the other hand, the ‘inner’ methylene units of the linker (B1 and C1) show significant changes upon Ca2+ binding. Moreover, for both groups a single major signal is observable in the unsaturated state, which splits into two clear signals with equal intensity when saturated with Ca2+. Exchanging Y3+ for paramagnetic ions (Eu3+, Yb3+) shows the same trends. This time, the signal splitting for B1 and C1 methylene groups upon Ca2+ binding is accompanied with the partial or complete signal loss of the A1 methylene in EuL1 and YbL1, respectively (Fig. S2 in ESI†).
 | ||
| Fig. 2 13C-HSQC spectrum of YL1 with the signals of interest assigned pre- (blue) and post-Ca2+ (red) addition (top). Chemical structure of YL1 with the methylene units of interest labelled (bottom). | ||
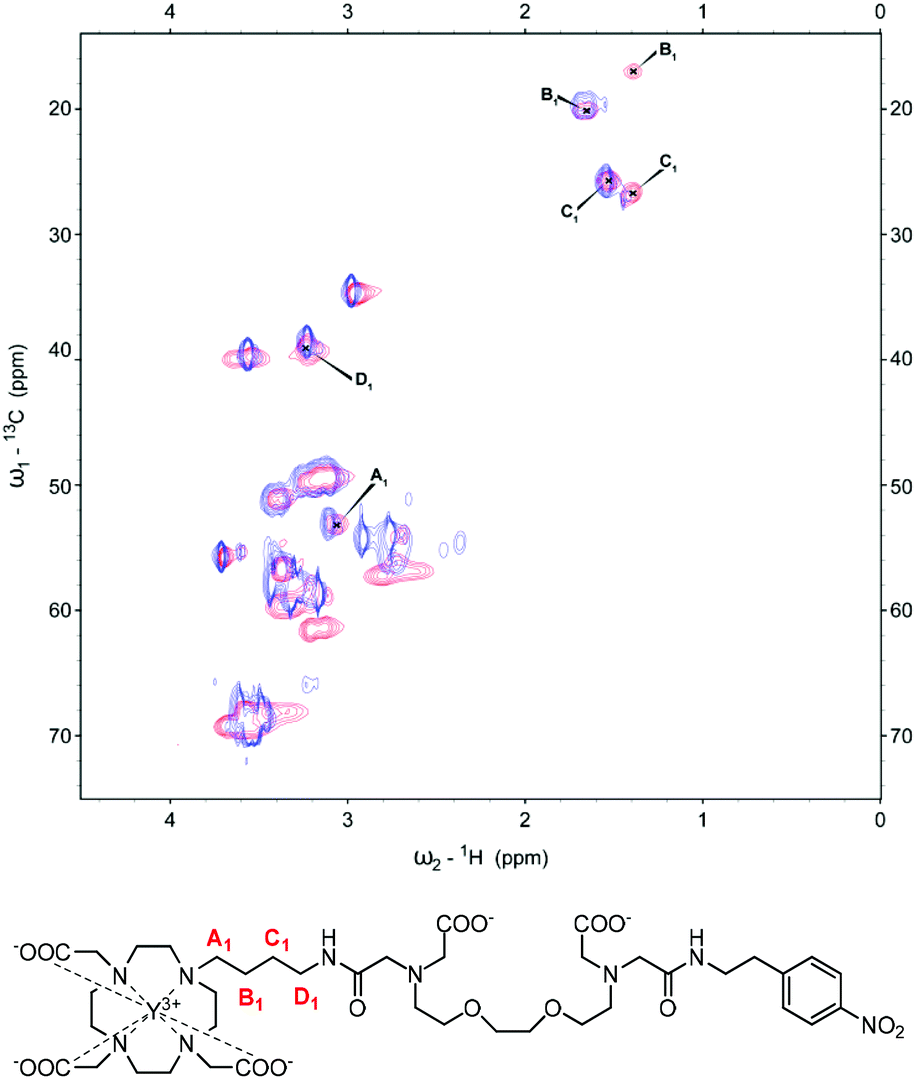
Similarly for YL2, the CH2 unit closest to the macrocyclic ring (A2) shows a minor shift upon the addition of Ca2+ (Fig. 3). Moving further away from the macrocyclic ring, one signal is observable for the B2 methylene group prior to Ca2+ addition, which then splits to form a new additional signal with lower intensity upon Ca2+ binding. C2 methylene shows similar splitting behaviour to B2 when Ca2+ binds, however both new signals are present with similar intensities. Moving towards the amide unit, the D2 methylene group initially presents as two spots which then merge towards one with the addition of Ca2+, while the furthest methylene group in the linker, E2, experiences a minor change. As in the case for the complexes with the butyl linker, analysis of paramagnetic complexes reveals loss of the signal for the A2 methylene group in both EuL2 and YbL2 upon Ca2+ binding (Fig. S2 in ESI†). Obviously, the difference in the observed spectra of the studied peaks across the metals originates from their different paramagnetic effects. For example, the signals for A1/A2 methylene groups, which are observable in YL1–2 after the addition of Ca2+, disappear in the cases of Ca2+ addition to EuL1–2 and YbL1–2. We assume that a combination of the paramagnetic relaxation effect (shortening of T1 and T2 relaxation times) due to the proximity of the A1/A2 groups to the lanthanide and the increased conformational exchange leads to the overall signal loss that cannot be detected via NMR anymore.
 | ||
| Fig. 3 13C-HSQC spectrum of YL2 with the signals of interest assigned pre-(blue) and post-Ca2+ (red) addition (top). Chemical structure of YL2 with the carbon units of interest labelled (bottom). | ||
More importantly, the signal splitting and shifting of peaks seen in the B1,2, C1,2 and D2 methylene groups suggest a substantial change in their environment between both the starting and saturated Ca2+ states. As these units are not in direct contact and should not participate directly in the binding of the added Ca2+, the movement of such signals indicates a change in the coordination behaviour of the complex. The mechanism of action for these Ca2+-responsive SCAs has previously been investigated.15 Specifically, in the absence of Ca2+, the closest carboxylate of the EGTA-derived moiety binds to the metal centre restricting water access. In the presence of Ca2+, this carboxylate preferentially binds to Ca2+ thus increasing the access of water to the complex. The results obtained here are in line with this theory, as it can be envisaged that the ‘off-state’ will present in a conformation which can be considered as a ring-like structure through which the EGTA-derived carboxylate is coordinated to the lanthanide of the macrocycle. Subsequent Ca2+ addition triggers the breaking of this arrangement due to its higher affinity for Ca2+vs. Gd3+ to form a new structure/conformation, which is highlighted through the shifting and splitting of signals in the 13C-HSQC spectra. The observed changes of the signals from the linker methylene units indicate a noteworthy change in the coordination environment around the macrocyclic chelator between the two states and further evidences a conformational change in the responsive mechanism previously described. Moreover, the existence of two signals upon addition of Ca2+ supports the presence of two SAP and TSAP stereoisomers (see below). Since the signals of the C![[double bond, length as m-dash]](https://www.rsc.org/images/entities/char_e001.gif) O group of the amide could not be observed in any of the performed NMR experiments, we could not draw any conclusion on its fate, and whether this carbonyl does or does not coordinate to the metal centre. Indeed, the luminescence lifetime experiments revealed values that suggest an equilibrium of non- and mono-hydrated species (see below). Combined with the absence of NMR signals, our findings suggest that the carbonyl interacts with the metal ion throughout in either of the studied conditions (with or without added Ca2+).
O group of the amide could not be observed in any of the performed NMR experiments, we could not draw any conclusion on its fate, and whether this carbonyl does or does not coordinate to the metal centre. Indeed, the luminescence lifetime experiments revealed values that suggest an equilibrium of non- and mono-hydrated species (see below). Combined with the absence of NMR signals, our findings suggest that the carbonyl interacts with the metal ion throughout in either of the studied conditions (with or without added Ca2+).
The 1H NMR spectra of the EuL1 and EuL2 complexes show paramagnetically shifted signals in the range ∼−20 to 28 ppm (Fig. 4). The signals of the most shifted axial protons are observed between 20 and 28 ppm, a range that is typical of square antiprismatic coordination (SAP) around the metal ion.20–23 The signals due to the axial protons of the twisted square antiprismatic (TSAP) isomers are usually observed around 10–15 ppm. The resonances due to the TSAP isomer are barely visible in the case of EuL2, while for EuL1 the population of the TSAP isomer can be estimated to be 10–15%.
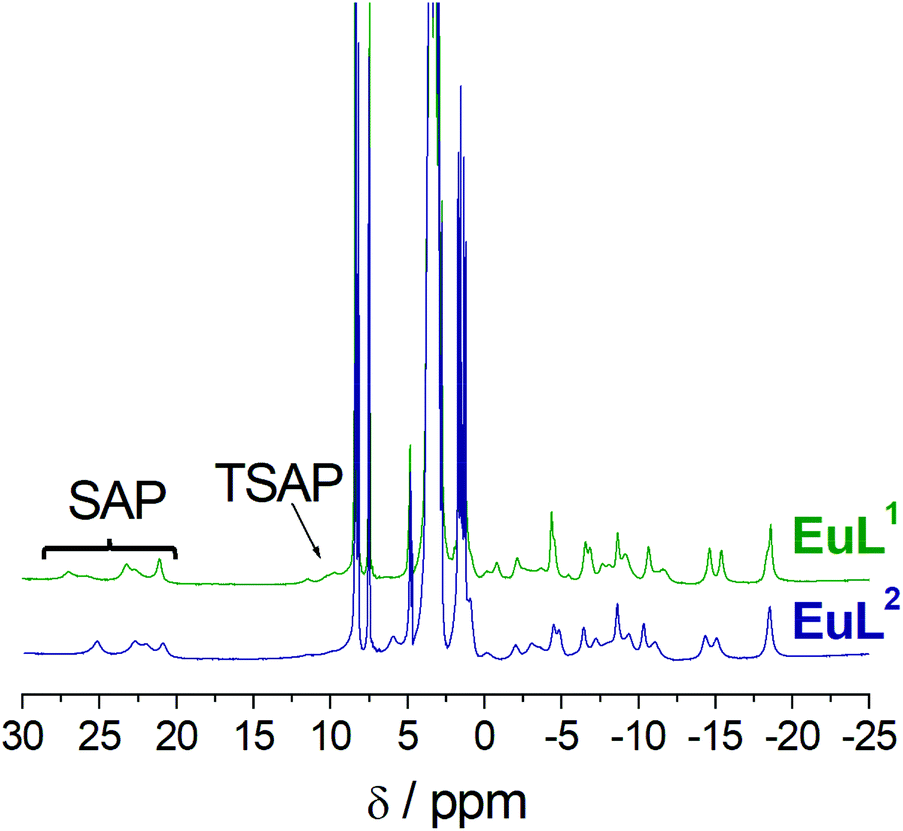 | ||
| Fig. 4 1H NMR spectra of the EuL1 and EuL2 complexes recorded in D2O solution (800 MHz, 25 °C, pD 7). | ||
Interestingly, the NMR spectra of the EuL1 and EuL2 complexes are very similar, which indicates that they possess comparable magnetic anisotropies and thus coordination environments around the metal ion.24 Furthermore, the spectra are characterised by rather well resolved signals, which indicates fairly rigid conformations in the Ca-free conditions and likely coordination of both the carboxyl group and the amide pendant arm to the metal ion. Indeed, Eu3+ complexes of DO3A derivatives generally give 1H NMR spectra with broad signals.25 Obviously, the spectra recorded for EuL1–2 suggest their atypical coordination mode with the paramagnetic metal ions, which supports the hypothesized existence of the coordination of the carboxyl and amide groups in absence of Ca2+. On the other hand, addition of Ca2+ provokes severe broadening of the 1H NMR resonances. This is in line with a more fluxional behaviour of the macrocyclic ring due to expected decoordination of the carboxylate and possibly partial decoordination or elongation of the coordination bond of the amide group (see below and Fig. S3 in ESI†).
NMR diffusion measurements
The diffusion of molecules can significantly describe their behaviour in solution and could potentially show any aggregation present. Diffusion coefficients for each derivative was therefore assessed prior to and after the addition of Ca2+ with DOSY on the Eu3+ analogues (EuL1 and EuL2) at three different concentrations (20, 10 and 5 mM). The diffusion coefficients obtained for the two systems studied here were both in agreement with similar monomeric species previously studied (Table 1).19,26| Diffusion coefficient D (10−10 m2 s−1) | ||||||
|---|---|---|---|---|---|---|
| No Ca2+ | +Ca2+ | |||||
| 20 mM | 10 mM | 5 mM | 20 mM | 10 mM | 5 mM | |
| EuL1 | 1.76 ± 0.06 | 1.97 ± 0.01 | 1.99 ± 0.04 | 1.89 ± 0.02 | 2.01 ± 0.04 | 2.05 ± 0.06 |
| EuL2 | 1.76 ± 0.02 | 1.90 ± 0.04 | 1.95 ± 0.04 | 1.71 ± 0.01 | 1.91 ± 0.01 | 1.96 ± 0.02 |
Generally, decreasing the complex concentration led to a slight increase in diffusion coefficient which is naturally expected. Additionally, the diffusion of EuL2 was slightly slower than that of EuL1, which is logical due to the minor difference in their size and greater linker length in EuL2. When comparing samples of identical concentrations upon Ca2+ addition (2 equiv.), similar, or a slight increase in diffusion coefficient was also observed. This is indicative of a change in conformation expected upon Ca2+ binding and faster diffusion of these complexes in solution. These tiny observed changes in diffusion along with the absolute values indicate systems which interact with Ca2+; however, its addition leads to conformational changes that cause slightly faster diffusion of the species in solution for both studied complexes, while likely excluding the formation of aggregates.
Luminescence experiments
Luminescence emission lifetime and steady-state measurements were performed to assess the hydration states of the complexes and further understand the coordination environment of the lanthanide ion. As previously well established for this class of SCAs, the hydration of the inner sphere of the complex is expected to increase upon addition of the analyte, which is commonly the major cause for the enhancement in the relaxivity.14,27 However, the hydration change must not be the sole reason for the relaxivity enhancement, as the intramolecular hydrogen bonding or the deprotonation of proximate amines and the consequent changes in the prototopic exchange may additionally influence the amplitude of the relaxivity changes.17,28Measurements were carried out with the EuL1–2 (5 mM) analogues in both H2O and D2O and the hydration number (q) was calculated (Table 2) following a previously reported method.29 Consequently, the calculated hydration numbers for both EuL1–2 complexes increase upon Ca2+ binding, complimentary to that previously observed with other DO3A-based Ca-responsive SCAs.15,16 The length of the linker impacts the initial inner sphere hydration state of the complex. The shorter butyl derivative, EuL1, is less hydrated in the initial state compared to that of EuL2, which explains the initial r1 relaxivity value observed in the relaxometric titrations previously discussed (Fig. 1). The increased initial hydration state of EuL2 additionally indicates a lesser interaction between the EGTA-derived carboxylate and Eu3+ compared to EuL1, possibly resulting from an increased distance between these two moieties. Otherwise, reasons involving an altered conformational arrangement or a change in ratio of the SAP and TSAP isomers could provide possible explanations. The luminescence steady-state emission spectra were in line with the determined q values – the initial emission signal intensity was greater for EuL1, due to its lower hydration (Fig. S4 in ESI†); subsequently, the signal intensities for EuL1 and EuL2 equalized upon the addition of Ca2+.
| No Ca2+ | +Ca2+ (2 equiv.) | |||||
|---|---|---|---|---|---|---|
| τ H2O (ms) | τ D2O (ms) | q | τ H2O (ms) | τ D2O (ms) | q | |
| EuL1 | 0.726 | 1.142 | 0.3 | 0.584 | 1.159 | 0.7 |
| EuL2 | 0.652 | 1.140 | 0.5 | 0.539 | 0.982 | 0.7 |
DFT studies
DFT calculations were carried out in an attempt to rationalize the structure of the GdL1–2 complexes and their response to the presence of Ca2+ (see computational details in Experimental section). For the sake of computational simplicity, the structures of the complexes were truncated at the carbon of the ethylene bridge closer to the amide group (Fig. 5 and Fig. S5 in ESI†). The simplified models will be denoted as GdL1′ and GdL2′. Following previous studies,30,31 the optimized structures of the SAP isomers of GdL1′–2′ included three explicit water molecules to improve the description of the Gd–Owater bonds. Geometry optimizations provided two energy minima for each complex in which either a water molecule or a carboxylate group is coordinating at the apical position of the SAP coordination polyhedron. Coordination of the amide oxygen atom takes place regardless of the length of the spacer or the concomitant coordination of the acetate group of the EGTA moiety at the apical position. The calculated Gd–Oamide distances are 2.405 and 2.418 Å for the monohydrated (q = 1) forms of GdL1′ and GdL2′, respectively.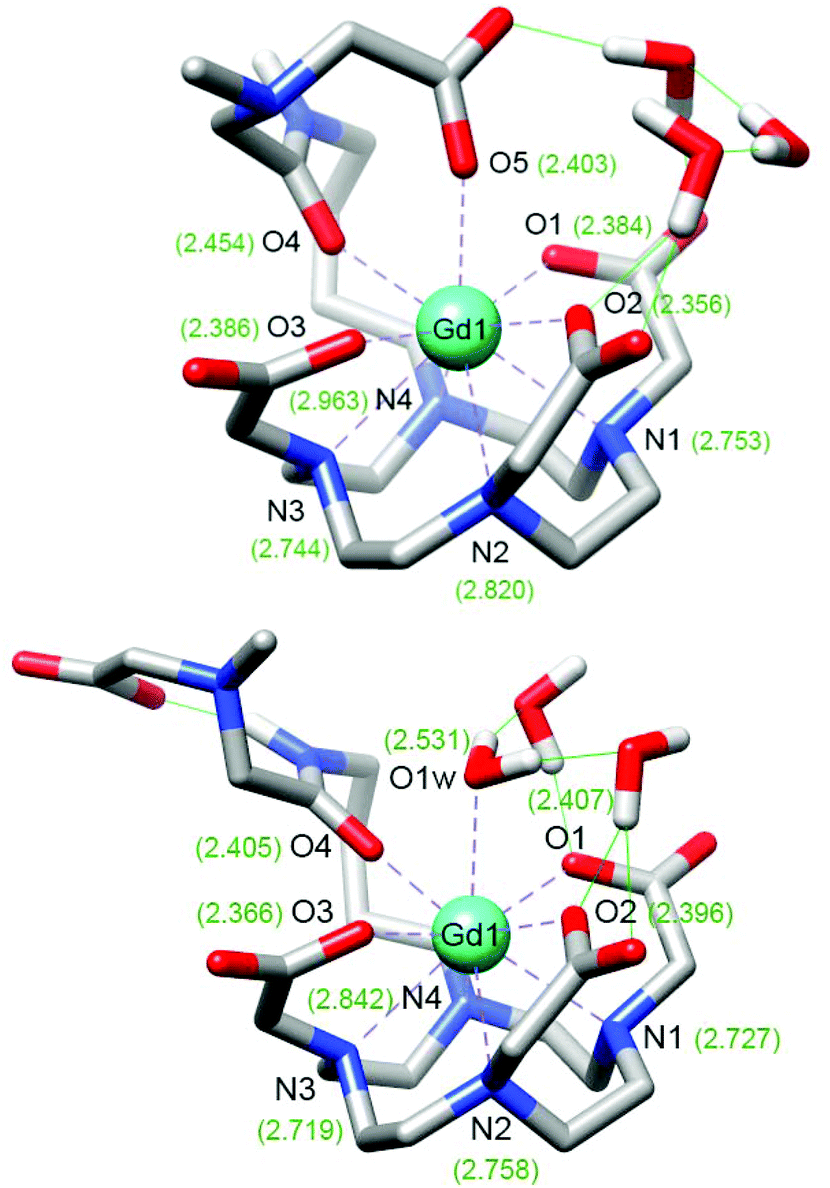 | ||
| Fig. 5 Optimized structures of the GdL1′ system obtained with DFT calculations showing the coordination of the carboxylate group of the side chain (top) or the coordination of a water molecule (bottom). The numbers represent the calculated bond distances (Å) between the metal centre and the ligand donor atoms. | ||
Coordination of the carboxylate group at the apical position results in a significant lengthening of the Gd–Oamide bonds to 2.454 and 2.492 Å for GdL1′ and GdL2′, respectively. The longer Gd–Oamide distances calculated for the GdL2′ complex reflect a weaker coordination of the amide oxygen atom associated to the longer pentyl spacer. The energy differences between the calculated structures with q = 1 and q = 0 favour the apical coordination of the carboxylate group by ΔEZPE = 1.2 and 0.93 kcal mol−1 for GdL1′ and GdL2′, respectively. The slightly smaller energy difference calculated for GdL2′ suggests that the higher relaxivity observed for GdL2 in the absence of Ca2+ might be related to a higher contribution of the hydrated form of the complex. The DFT results are in line with our previous studies that indicated the coordination of a carboxylate group of the EGTA moiety at the apical position in the absence of Ca2+, resulting in a non-hydrated species. Addition of Ca2+ causes the de-coordination of this group, which gets involved in Ca2+ coordination, yielding a q = 1 complex. Thus, our DFT results indicate that extending the length of the spacer connecting the DO3A moiety and the amide group, by introducing butyl or pentyl linkers, does not alter the mechanism for Ca2+ response. Our results also support the coordination of the amide group both in the absence and in the presence of Ca2+, in line with the hydration numbers determined from luminescence lifetime measurements, which point to monohydrated complexes after Ca2+ binding. This was also supported in a number of previous studies by 17O NMR measurements,32–34 which provided hyperfine coupling constants A/ħ that confirmed the formation of mono-hydrated species. The higher relaxivities observed for the Ca2+-bound form of GdL2 compared to GdL1 are therefore not likely related by an increased number of coordinated water molecules, but perhaps to a more important contribution of second-sphere water molecules.
Conclusions
To conclude, we have designed, synthesised and characterised a new pair of Ca-responsive SCAs with altered linker lengths between the MR reporting and bioresponsive moieties. Relaxometric, NMR, DOSY, luminescence lifetime and DFT studies were performed to analyse and evaluate the coordination behaviour of both systems. Throughout the studies, the sensitivity of such molecules to discrete structural changes is apparent. As the linker length increased, the initial hydration state of EuL2 was observed to be higher than in EuL1, resulting in a greater starting relaxivity. The subsequent change in relaxivity upon Ca2+ addition varied significantly depending on the linker length. Specifically, the overall r1 and r2 relaxivity change for GdL2 was found to be 131 and 138% respectively; while for the shorter system, GdL1, changes of 99 and 107% were observed for both r1 and r2 respectively. Results from the DOSY experiments, described a system in which negligible change in the diffusive behaviour of the complex between the initial and Ca2+ saturated states took place. High-resolution NMR studies provided further insights and validations to the responsive mechanism of these types of Ca-responsive probes previously reported. DFT calculations supported the existence of the postulated Ca-triggered coordination changes evidenced in the above described experiments.Overall, here we have evaluated the coordination properties of two DO3A-based Ca-responsive systems with increased spacer distance and compared them to the previously employed derivatives for their suitability as scaffolds in the future development of Ca-responsive SCAs. The results of this study have provided important information into how subtle structural changes can impact the responsivity of such systems, aiding in the design of future monomeric SCAs in the pursuit of more effective Ca-responsive probes. Moreover, the investigated systems exhibited affirmative relaxometric properties that can be further exploited, making them promising candidates for the preparation and utilisation of multifunctional SCAs for fMRI applications.
Experimental section
General remarks
Commercially available reagents and solvents were used without further purification. Compounds 1 and 2 were synthesised following published procedures.18 High resolution mass spectra were recorded on a Bruker Daltonics APEX II (FT-ICR-MS) with an electrospray ionization source. Low resolution mass spectra were recorded on an Agilent ion trap SL 1100 system with an electrospray ionization source. All NMR, diffusion and relaxometric experiments were performed on Bruker Avance III 300 MHz and Avance III 800 MHz spectrometers at 298 K. Processing was performed using TopSpin 2.1 (Bruker GmbH), ACD/SpecManager 9.0 (Advanced Chemistry Development, Inc.) or Sparky 3.115. The NMR spectra were obtained in D2O, using the deuterium lock frequency. The concentration of Gd3+, Eu3+ or Yb3+ in analysed solutions was determined using the bulk magnetic susceptibility shift (BMS).35 The luminescence lifetime measurements were performed on a QuantaMaster™ 3 PH fluorescence spectrometer from Photon Technology International, Inc. (USA).Synthetic procedures
O). ESI-HRMS: (m/z) [M + Ca–H]+ calcd for C40H64CaN9O16+, 966.4091, found: 966.4073.
O). ESI-HRMS: (m/z) [M–3H + Ca]− calcd for C41H64CaN9O16−, 978.4102, found: 978.4113.
NMR
YL1. 1H NMR (300 MHz, D2O): δ (ppm) 1.33–1.83 (br), 2.23–4.08 (br), 7.46 (d), 8.16 (d). 13C NMR (75 MHz, D2O): δ (ppm) 19.7, 25.8, 34.5, 38.5, 39.5, 46.4, 46.8, 49.3, 49.5, 49.7, 51.1, 51.1, 51.2, 53.0, 54.0, 54.3, 54.3, 54.6, 55.2, 55.3, 55.3, 55.7, 56.2, 56.8, 57.9, 58.2, 58.3, 58.7, 58.7, 65.7, 65.8, 65.9, 67.9, 68.1, 69.5, 69.5 (–CH2–), 123.8, 130.1, 147.7 (ArC), 171.1, 173.5, 173.6, 173.8, 178.3, 178.5 (CO).
YL2. 1H NMR (300 MHz, D2O): δ (ppm) 0.95–1.93 (br), 2.22–4.30 (br), 7.45 (d), 8.15 (d). 13C NMR (75 MHz, D2O): δ (ppm) 21.9, 23.3, 28.0, 34.5, 38.7, 39.5, 49.2, 49.2, 49.7, 49.9, 51.2, 51.2, 53.5, 54.0, 54.3, 55.3, 55.6, 56.7, 58.0, 58.2, 58.7, 58.7, 67.9, 68.2, 68.5, 69.5, 69.5 (–CH2–), 123.7, 130.0, 147.7 (ArC), 170.7, 173.2, 173.3, 173.6, 173.7, 177.6, 178.1, 178.3 (CO).
ESI-LRMS
GdL1. (m/z) [M − H]− calcd for C40H61GdN9O16−, 1081.3, found: 1081.3. [M + Na–2H]− calcd for C40H60GdN9NaO16−, 1103.3, found: 1103.3.EuL1. (m/z) [M − H]− calcd for C40H61EuN9O16−, 1076.3, found: 1076.3. [M + Na–2H]− calcd for C40H60EuN9NaO16−, 1098.3, found: 1098.3.
YbL1. (m/z) [M − H]− calcd for C40H61YbN9O16−, 1097.4, found: 1097.3. [M + Na–2H]− calcd for C40H60YbN9NaO16−, 1119.3, found: 1119.3.
YL1. (m/z) [M − H]− calcd for C40H61YN9O16−, 1012.3, found: 1012.4. [M + Na–2H]− calcd for C40H60YN9NaO16−, 1034.3, found: 1034.3.
GdL2. (m/z) [M − H]− calcd for C41H63GdN9O16−, 1095.4, found: 1095.4. [M + Na–2H]− calcd for C41H62GdN9NaO16−, 1117.4, found: 1117.3.
EuL2. (m/z) [M − H]− calcd for C41H63EuN9O16−, 1090.4, found: 1090.4. [M + Na–2H]− calcd for C41H62EuN9NaO16−, 1112.3, found: 1112.3.
YbL2. (m/z) [M − H]− calcd for C41H63YbN9O16−, 1111.4, found: 1111.4. [M + Na–2H]− calcd for C41H62YbN9NaO16−, 1133.4, found: 1133.3.
YL2. (m/z) [M − H]− calcd for C41H63YN9O16−, 1026.3, found: 1026.3. [M + Na–2H]− calcd for C41H62YN9NaO16−, 1048.3, found: 1048.3.
Relaxometric titrations
Proton longitudinal and transverse relaxometric titrations with Ca2+ were performed at 7.0 T, 298 K and pH 7.4 (50 mM HEPES buffer) using inversion recovery (T1) and Car–Purcell–Meiboom–Gill (T2) pulse sequences. To a solution of GdL1–2 (2.5 mM), a CaCl2 solution of known concentration was added stepwise and T1 and T2 measurements were performed after each addition. The longitudinal and transverse relaxivities, r1 and r2, were then calculated using eqn (1), where T1,obs is the measured T1 (i = 1) or T2 (i = 2), Ti,d is the diamagnetic contribution from the solvent and [Gd] is the actual concentration of Gd3+. A total of three independent measurements were recorded for each Gd3+ complex and the results averaged at each point for the titration to give the final relaxivity values.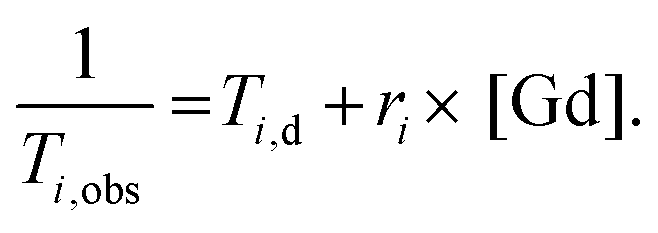 | (1) |
High resolution NMR experiments
All high resolution NMR spectra were acquired on Bruker AVIII-800 spectrometer, processed with TopSpin 2.1 (Bruker GmbH), and analyzed with Sparky 3.115.36 For every sample (20 mM [Ln3+]), a 1H-NMR spectra was measured, as well as a DQF-COSY and a 13C-HSQC. A standard DQF-COSY37 was acquired with 4096 and 128 complex points in t2 and t1, respectively, performing 256 scans per increment.The 13C-HSQC was recorded at a resolution of 1024 (t2) × 128 (t1) complex points, using 64 scans per increment. All experiments were recorded at 298 K, using a relaxation delay of 1.5 s. The water suppression was achieved via pre-saturation for the 1H-NMR and the COSY, while the 13C-HSQC uses gradient selection (echo/anti-echo).
NMR diffusion measurements
Samples of EuL1–2 with and without Ca2+ (2 equiv.) were dissolved in D2O and the pD adjusted to 7.0. Diffusion coefficient determination was performed using 2D – Diffusion Ordered NMR Spectroscopy (DOSY). Measurements were performed at 298 K with 20, 10 and 5 mM [Eu3+] samples (δt = 2 ms, ΔT = 250 ms). Data analysis was conducted with TopSpin 2.1 using 16 linear points with a 5–95% gradient strength. The diffusion coefficients were calculated through the analysis of individual peaks in the aromatic region. Each peak used in the determination provided the diffusion coefficient that was within an error of 0.05 × 10⁻¹⁰ m2 s−1. The reported diffusion coefficients in Table 1 are the averages of each of the peaks from the three independent measurements with their standard deviation.Luminescence lifetime measurements
Luminescence lifetime measurements were performed with EuL1–2 at 5 mM [Eu3+] in D2O and H2O with and without Ca2+ (2 equiv.) (298 K, pH 7.4, HEPES). The Eu3+ ion was directly excited and the emission intensity was recorded with a 10 μs resolution. The excitation and emission slits were set at 5 nm. In total, three independent measurements each with 25 scans were performed to obtain the data set. The obtained curves were fitted with a first order exponential decay with an r2 = 0.99. The resulting q values were then calculated using eqn (2).| q = 1.2 × (τH2O−1 − τD2O−1 − 0.25). | (2) |
Conflicts of interest
There are no conflicts to declare.Acknowledgements
The authors thank Dr Giuseppe Gambino for helpful discussions. The financial support of German Research Foundation (DFG, grant AN 716/7-1) is gratefully acknowledged. C. P.-I. thanks Centro de Supercomputación de Galicia (CESGA) for providing the supercomputer facilities. This work was carried out within the framework of the COST CA15209 Action “European Network on NMR Relaxometry”. Open Access funding provided by the Max Planck Society.Notes and references
- D. V. Hingorani, A. S. Bernstein and M. D. Pagel, Contrast Media Mol. Imaging, 2015, 10, 245–265 CrossRef CAS PubMed.
- M. Carril, J. Mater. Chem. B, 2017, 5, 4332–4347 RSC.
- M. C. Heffern, L. M. Matosziuk and T. J. Meade, Chem. Rev., 2014, 114, 4496–4539 CrossRef CAS PubMed.
- G. L. Davies, I. Kramberger and J. J. Davis, Chem. Commun., 2013, 49, 9704–9721 RSC.
- C. S. Bonnet and E. Toth, Chimia, 2016, 70, 102–108 CrossRef CAS PubMed.
- D. Parrott, W. S. Fernando and A. F. Martins, Inorganics, 2019, 7, 18 CrossRef CAS.
- J. Wahsner, E. M. Gale, A. Rodríguez-Rodríguez and P. Caravan, Chem. Rev., 2019, 119, 957–1057 CrossRef CAS PubMed.
- C. Grienberger and A. Konnerth, Neuron, 2012, 73, 862–885 CrossRef CAS PubMed.
- G. W. Zamponi, ACS Chem. Neurosci., 2017, 8, 2583–2585 CrossRef CAS PubMed.
- G. G. Somjen, Ions in the brain: normal function, seizures, and strokes, Oxford University Press, New York, Oxford, 2004 Search PubMed.
- I. Dal Pra, A. Chiarini, R. Pacchiana, E. Gardenal, B. Chakravarthy, J. F. Whitfield and U. Armato, Curr. Neuropharmacol., 2014, 12, 353–364 CrossRef CAS PubMed.
- E. L. Que and C. J. Chang, Chem. Soc. Rev., 2010, 39, 51–60 RSC.
- G. Angelovski, Acc. Chem. Res., 2017, 50, 2215–2224 CrossRef CAS PubMed.
- J. L. Major, R. M. Boiteau and T. J. Meade, Inorg. Chem., 2008, 47, 10788–10795 CrossRef CAS PubMed.
- P. Kadjane, C. Platas-Iglesias, P. Boehm-Sturm, V. Truffault, G. E. Hagberg, M. Hoehn, N. K. Logothetis and G. Angelovski, Chem. – Eur. J., 2014, 20, 7351–7362 CrossRef CAS PubMed.
- G. Angelovski, P. Fouskova, I. Mamedov, S. Canals, E. Toth and N. K. Logothetis, ChemBioChem, 2008, 9, 1729–1734 CrossRef CAS PubMed.
- S. Gündüz, S. Vibhute, R. Botár, F. K. Kálmán, I. Tóth, G. Tircsó, M. Regueiro-Figueroa, D. Esteban-Gómez, C. Platas-Iglesias and G. Angelovski, Inorg. Chem., 2018, 57, 5973–5986 CrossRef PubMed.
- L. Connah and G. Angelovski, Biomacromolecules, 2018, 19, 4668–4676 CrossRef CAS PubMed.
- S. Gündüz, T. Savić, R. Pohmann, N. K. Logothetis, K. Scheffler and G. Angelovski, ACS Sens., 2016, 1, 483–487 CrossRef PubMed.
- C. Kumas, W. S. Fernando, P. Y. Zhao, M. Regueiro-Figueroa, G. E. Kiefer, A. F. Martins, C. Platas-Iglesias and A. D. Sherry, Inorg. Chem., 2016, 55, 9297–9305 CrossRef CAS PubMed.
- T. Mani, G. Tircso, O. Togao, P. Zhao, T. C. Soesbe, M. Takahashi and A. D. Sherry, Contrast Media Mol. Imaging, 2009, 4, 183–191 CrossRef CAS PubMed.
- C. M. Fisher, E. Fuller, B. P. Burke, V. Mogilireddy, S. J. A. Pope, A. E. Sparke, I. Dechamps-Olivier, C. Cadiou, F. Chuburu, S. Faulkner and S. J. Archibald, Dalton Trans., 2014, 43, 9567–9578 RSC.
- T. Mani, A. C. L. Opina, P. Y. Zhao, O. M. Evbuomwan, N. Milburn, G. Tircso, C. Kumas and A. D. Sherry, J. Biol. Inorg. Chem., 2014, 19, 161–171 CrossRef CAS PubMed.
- A. W. J. Poh, J. A. Aguilar, A. M. Kenwright, K. Mason and D. Parker, Chem. – Eur. J., 2018, 24, 16170–16175 CrossRef CAS PubMed.
- O. A. Blackburn, M. Tropiano, L. S. Natrajan, A. M. Kenwright and S. Faulkner, Chem. Commun., 2016, 52, 6111–6114 RSC.
- J. Henig, I. Mamedov, P. Fouskova, E. Tóth, N. K. Logothetis, G. Angelovski and H. A. Mayer, Inorg. Chem., 2011, 50, 6472–6481 CrossRef CAS PubMed.
- W. H. Li, G. Parigi, M. Fragai, C. Luchinat and T. J. Meade, Inorg. Chem., 2002, 41, 4018–4024 CrossRef CAS PubMed.
- E. Boros, R. Srinivas, H. K. Kim, A. M. Raitsimring, A. V. Astashkin, O. G. Poluektov, J. Niklas, A. D. Horning, B. Tidor and P. Caravan, Angew. Chem., Int. Ed., 2017, 56, 5603–5606 CrossRef CAS PubMed.
- A. Beeby, I. M. Clarkson, R. S. Dickins, S. Faulkner, D. Parker, L. Royle, A. S. de Sousa, J. A. G. Williams and M. Woods, J. Chem. Soc., Perkin Trans. 2, 1999, 493–503 RSC.
- D. Esteban-Gomez, A. de Blas, T. Rodriguez-Blas, L. Helm and C. Platas-Iglesias, ChemPhysChem, 2012, 13, 3640–3650 CrossRef CAS PubMed.
- M. Regueiro-Figueroa and C. Platas-Iglesias, J. Phys. Chem. A, 2015, 119, 6436–6445 CrossRef CAS PubMed.
- K. D. Verma, A. Forgács, H. Uh, M. Beyerlein, M. E. Maier, S. Petoud, M. Botta and N. K. Logothetis, Chem. – Eur. J., 2013, 19, 18011–18026 CrossRef CAS PubMed.
- F. Oukhatar, H. Meudal, C. Landon, N. K. Logothetis, C. Platas-Iglesias, G. Angelovski and É. Tóth, Chem. – Eur. J., 2015, 21, 11226–11237 CrossRef CAS PubMed.
- F. Oukhatar, S. V. Eliseeva, C. S. Bonnet, M. Placidi, N. K. Logothetis, S. Petoud, G. Angelovski and É. Tóth, Inorg. Chem., 2019 DOI:10.1021/acs.inorgchem.1029b00887.
- D. M. Corsi, C. Platas-Iglesias, H. van Bekkum and J. A. Peters, Magn. Reson. Chem., 2001, 39, 723–726 CrossRef CAS.
- T. D. Goddard and D. G. Kneller, SPARKY 3, University of California, San Francisco, ver Search PubMed.
- A. E. Derome and M. P. Williamson, J. Magn. Reson., 1990, 88, 177–185 Search PubMed.
- J. M. Tao, J. P. Perdew, V. N. Staroverov and G. E. Scuseria, Phys. Rev. Lett., 2003, 91, 146401 CrossRef PubMed.
- Gaussian 09, Revision B.01, Gaussian, Inc., Wallingford CT, ver., 2009 Search PubMed.
- M. Dolg, H. Stoll, A. Savin and H. Preuss, Theor. Chim. Acta, 1989, 75, 173–194 CrossRef CAS.
- J. Tomasi, B. Mennucci and R. Cammi, Chem. Rev., 2005, 105, 2999–3093 CrossRef CAS PubMed.
- A. K. Rappe, C. J. Casewit, K. S. Colwell, W. A. Goddard and W. M. Skiff, J. Am. Chem. Soc., 1992, 114, 10024–10035 CrossRef CAS.
Footnote |
| † Electronic supplementary information (ESI) available: NMR, MS and luminescence lifetime experiments, DFT structures. See DOI: 10.1039/c9dt02672j |
| This journal is © The Royal Society of Chemistry 2019 |