
Photoelectrocatalytic oxidation of 3-pyridinemethanol to 3-pyridinemethanal and vitamin B3 by TiO2 nanotubes†
Sedat
Yurdakal
 *a,
Sıdıka
Çetinkaya
a,
Muhsine Beyza
Şarlak
a,
Levent
Özcan
b,
Vittorio
Loddo
c and
Leonardo
Palmisano
c
*a,
Sıdıka
Çetinkaya
a,
Muhsine Beyza
Şarlak
a,
Levent
Özcan
b,
Vittorio
Loddo
c and
Leonardo
Palmisano
c
aKimya Bölümü, Fen-Edebiyat Fakültesi, Afyon Kocatepe Üniversitesi, Ahmet Necdet Sezer Kampüsü, 03200 Afyonkarahisar, Turkey. E-mail: sedatyurdakal@gmail.com
bBiyomedikal Mühendisliği Bölümü, Mühendislik Fakültesi, Afyon Kocatepe Üniversitesi, Ahmet Necdet Sezer Kampüsü, 03200 Afyonkarahisar, Turkey
cSchiavello-Grillone Photocatalysis Group, Università degli Studi di Palermo, Dipartimento di Ingegneria (DI), Viale delle Scienze, 90128 Palermo, Italy
First published on 11th November 2019
Abstract
In this paper, the first photoelectrocatalytic (PEC) 3-pyridinemethanol oxidation to 3-pyridinemethanal and vitamin B3 was investigated. To meet this aim, efficient nanotube structured TiO2 on a Ti plate as a photoanode was prepared by an anodic oxidation method in ethylene glycol and characterized by XRD, SEM, and photocurrent techniques. The effect of nanotube morphology, applied potential, Na2SO4 concentration, stirring speed of solution, and pH on the reaction activity and product selectivities were investigated. The TiO2 phase of all of the anodes was mainly the anatase one. The PEC activity, the intensity of the XRD peak and the photocurrent increased by increasing the nanotube length. The activity decreased by decreasing both the Na2SO4 concentration and the applied potential, whereas 3-pyridinemethanal selectivity increased. By increasing the stirring speed of the solution, both the activity and the 3-pyridinemethanal selectivity increased. A lower or no activity was observed for photocatalytic (PC) and electrocatalytic runs, respectively, which were carried out for the sake of comparison. No PC activity was obtained in the presence of N2, but PEC reactions in the presence of N2 were faster than those in the presence of O2. The produced 3-pyridinemethanal in both N2 and O2 atmosphere was reduced at the cathode in the PEC reaction, but its oxidation appeared to be much more favourable. The PC reactions could not be carried out under acidic conditions, whilst the PEC ones could be performed in the pH range of 2–12. Moreover, the results indicate that the PEC method allows higher conversions and selectivities to vitamin B3 to be obtained at pH 7 with respect to those reported in the literature.
1 Introduction
Annual production of vitamin B3 (nicotinic acid or pyridine-3-carboxylic acid) in the world is very high (ca. 14![[thin space (1/6-em)]](https://www.rsc.org/images/entities/char_2009.gif) 000 ton in 1995)1 and it is most commonly used for prevention of pellagra disease and alcoholism.2,3 Vitamin B3 administration reduces the levels of cholesterol in plasma4 and has a beneficial effect on the long term treatment of coronary heart disease, thus increasing the average life span.5,6
000 ton in 1995)1 and it is most commonly used for prevention of pellagra disease and alcoholism.2,3 Vitamin B3 administration reduces the levels of cholesterol in plasma4 and has a beneficial effect on the long term treatment of coronary heart disease, thus increasing the average life span.5,6
Vitamin B3 is industrially produced through a catalytic process in which 3-picoline is transformed into 3-cyanopyridine, followed by a hydrolysis step. The operative conditions are not mild and not safe as the reaction is carried out over vanadium oxide catalysts at temperatures higher than 300 °C, in the presence of O2 and NH3 (ref. 1, 7–9) and the reagent mixture is highly flammable.10 Moreover, the process suffers from problems related to the existence of undesired competitive oxidation reactions of reagents and intermediates, and to catalyst regeneration.1
To overcome these drawbacks, different processes have been recently proposed to produce vitamin B3. Indeed, it could be obtained by 3-picoline oxidation with air by using vanadia–titania catalysts11,12 or with oxygen using Cr(1−x)AlxVO4 or CrV(1−x)PxO4 mixed catalysts.13,14 The problem of the flammability of the reagent together with the high operative temperatures (ca. 250 °C) still remains, and undesired by-products can be formed.15
Only a few articles have been published on partial photocatalytic (PC) oxidation of 3-pyridinemethanol, but photoelectrocatalytic (PEC) oxidation of this molecule has not been performed to date. Marotta and co-workers published studies on partial PC oxidation of 3-pyridinemethanol in water by using pure anatase commercial TiO2 (Aldrich) and TiO2–graphene-like composite catalysts in the presence of Cu2+ ions in the pH range of 1–4 and under de-aerated conditions.7,16,17 In these studies, the yields of 3-pyridinemethanal and vitamin B3 and the conversion of Cu2+ decreased by increasing the pH up to 4. Moreover, PC partial oxidation of 2, 3 and 4-pyridinemethanol was also performed by our research group in aqueous suspension and under aerated conditions by using Pt loaded home-prepared TiO2 catalysts under different irradiation conditions (UV, vis and UV-vis) in the pH range of 2–12.18 Mainly, amorphous TiO2 or Pt loaded crystalline TiO2 catalysts showed high product selectivity in basic medium under both UV and UV-vis light. Nevertheless, only Pt loaded home-prepared rutile TiO2 (Pt-HPRT-400) showed activity under visible light irradiation, among all the used catalysts.
Photoelectrocatalysis consists of the simultaneous combination of heterogeneous photocatalysis and electrocatalysis.19,20 It is an efficient method for improving the reaction yield as the photo-generated pair (electrons (e−) and holes (h+)) recombination is hindered by applying an external potential under UV, UV-vis or vis irradiation.21–24
Moreover, photoelectrocatalysis can be considered a “green or environmentally friendly process” because it can be carried out in water and by using air from the atmosphere instead of additional toxic oxidants.21,25 A TiO2 catalyst supported on a conductive surface (i.e. ITO or Ti)25–28 is generally used in photoelectrocatalysis as a photoanode, due to its high activity and stability to photocorrosion, inexpensiveness and harmlessness.21,29–31
Bare and doped nanotube structured TiO2 photoanodes have good electron transport characteristics and high surface areas.32,33 Therefore they are generally used in PEC studies for CO2 reduction,34 hydrogen production33,35–38 and degradation of harmful species.39–42 For instance, Gwag and co-workers investigated the effect of C doping on TiO2 nanotubes grown on Ti foil for the water splitting reaction under simulated solar irradiation.38
The electrolyte content and experimental parameters (i.e. potential, temperature and time) influence the quality of self-assembled titanium dioxide nanotube arrays. Self-assembled TiO2 nanotubes in just a few hundred nanometers were prepared by anodization of a Ti plate in H2O/HF electrolyte medium at room temperature.43 However, much longer TiO2 nanotubes (a few micrometers) were also prepared in Na2SO4/NaF or (NH4)2SO4/NH4F neutral electrolyte medium.44,45 In this case, undulatory and ring shaped TiO2 nanotubes were obtained. In contrast, very long and smooth TiO2 nanotubes (a few hundred-micrometers) could be prepared in organic electrolytes (i.e. dimethylsulfoxide or ethylene glycol) containing fluoride.46,47
In the literature, only a few studies on PEC selective oxidations have been reported.21,48–50 For instance, 4-methoxybenzyl alcohol was photoelectrocatalytically oxidized to p-anisaldehyde in water and under UV light by using non-nanotube structured TiO2 films on Ti plate anodes prepared by dip-coating or thermal oxidation.25 The thermally oxidized anodes showed better activity and product selectivity with respect to the dip-coated ones. 5-(Hydroxymethyl)-2-furaldehyde was also transformed into 2,5-furandicarbaldehyde by using Pt loaded Ti/TiO2 photoanodes with a nanotube structure.49 The anodes were prepared by an anodic oxidation method in H2O/HF electrolyte solution.49
In this work, the first PEC 3-pyridinemethanol oxidation was investigated. To this aim, efficient nanotube structured TiO2 on a Ti plate as a photoanode was prepared by an anodic oxidation method by immersing the Ti plates at 32 V for different times (from 10 min to 6 h). The effect of nanotube morphology, applied potential, Na2SO4 concentration, solution stirring speed, and pH on the partial oxidation reaction of the substrate was investigated. In particular, the influence of the Na2SO4 concentration and the solution stirring speed on the reaction rate and product selectivity was studied for the first time in photoelectrocatalysis. A non-nanotube structured Ti/TiO2-500 anode prepared by thermal oxidation was also used, and electrocatalytic (EC) and PC experiments were performed for the sake of comparison with the PEC experiments.
2 Experimental
2.1 Preparation of titanium plates
Pieces of emery paper with 800, 1000, 1200 and 1500 grids were used to obtain smooth Ti plate surfaces (8.0 cm × 5.0 cm × 1.0 mm). All of the plates were sonicated in acetone, ethanol and water, respectively, for 10 min. Ti plates were subsequently treated with a solution of 4% HF, 31% HNO3 and 65% H2O (w/w) for half a minute, washed with water, and then dried.2.2 Preparation of thermally oxidized photoanode (Ti/TiO2)
The anode was prepared by thermally oxidizing a Ti plate in air (temperature increasing rate: 3 °C min−1) at 500 °C for 3 hours in an oven (Protherm, PLF-110/10 model).25 The obtained plate is denoted as Ti/TiO2-500 (shown in Fig. S1†), where 500 indicates the temperature in °C used in the thermal treatment.2.3 Preparation of photoanodes by anodic oxidation (Ti/TiO2NT-X–Y)
The solution used for the anodic oxidation method was described elsewhere.41 The solution was prepared by dissolving NH4F (0.3% (w/w)) in a solution of water and ethylene glycol (1:49, v/v). Carbon felt, used as the cathode, was immersed in a HNO3 (1 M) solution for 24 h to make its surface hydrophilic. Anodic oxidation was performed by immersing the Ti plates at 32 V for different times (from 10 min to 6 h) using a direct current (DC) power supply device (Meili, MCH-305D-II model, MCH Instrument) in a container of high-density polyethylene. The experimental setup of the two electrode system is shown in Fig. S2.† The chosen potential value is lower than those previously used (60 V)51 to obtain stable nanotubes on a titanium plate. Initially, a 60 V potential was used to obtain nanotube structured TiO2 on a Ti plate in the solution described above (section 2.3), but many nanotubes were broken during the preparation and they accumulated at the bottom of the used vessel. Probably, the used high voltage (60 V) did increase the rate of organization of the nanotubes, and consequently the stability of the nanotube structure was adversely affected.
The formed TiO2 nanotubes on the Ti plate were in the amorphous phase. The anodes were calcined at 500 °C (temperature increasing rate: 3 °C min−1) to transform them into the crystalline phase. Some anodes were also calcined at 400 and 600 °C (shown in Fig. S3†). The prepared photoanodes are denoted as Ti/TiO2NT-X–Y, where X refers to the time of the applied potential used for the anodic oxidation and Y to the calcination temperature (°C).
2.4 Characterization of photoanodes
X-ray diffraction patterns of Ti/TiO2 electrodes were recorded with a Shimadzu (XRD-6000 model) diffractometer using Cu Kα radiation (1.544 Å) and a 2θ scan rate of 1.281° min−1.Scanning electron microscopy (SEM) images of sectioned nanotubes (performed by using a micro-spatula) from the Ti plate were obtained by using a Carl Zeiss ULTRA Plus. Nanotubes were covered with a gold thin film before the SEM analysis. In addition, the SEM images in Fig. 4a, 6, and S6† were taken by another instrument (FEI microscope, NanoSEM 650 model, detector: TLC), and in that case, SEM images of the photoanode were obtained without covering it with a gold film.
The chronoamperometric performances of the anodes under dark or UV irradiation were obtained in the same electrolyte medium and experimental system (described in section 2.5 in detail) used for partial PEC oxidation of 3-pyridinemethanol.
2.5 Photoelectrocatalytic reaction system
PEC and EC experiments were carried out with a three-electrode electrochemical system connected to a computer-controlled potentiostat–galvanostat (Ivium, Vertex model). In the above system, the photoanodes were the working electrodes. In addition, the Ti plate (4 cm × 10 cm × 0.1 cm) and Ag/AgCl (3 M KCl) were the counter and the reference electrodes, respectively. The sizes of the immersed part of anodes were 5 cm × 5 cm (for the counter electrode were 4 cm × 5 cm). UV fluorescent lamps (3 tubes, 8 W, Philips) with a maximum wavelength of 365 nm were used as the light sources in the PC and PEC runs. The setups where EC, PC and PEC were carried out together with the spectra of the UV lamp are shown in Fig. S4.† The distance between the light source and the anode was ca. 5 cm. The light intensity impinging on the photoanode surface (ca. 26.8 W m−2) was determined using a radiometer (DO9721, Deltaohm) with a probe measuring in the range of 315–400 nm. Na2SO4 was used as the electrolyte. The solution containing the electrolyte and substrate was in contact with air during the experimental runs. In this way, the concentration of dissolved oxygen could be considered in equilibrium with the oxygen of the atmosphere.The initial concentration of 3-pyridinemethanol was 0.50 mM. A beaker (Pyrex, 150 mL) was used as the reactor for the solution of 3-pyridinemethanol (150 mL). In order to reach the adsorption–desorption and thermodynamic equilibria before switching on the lamp, the solution was stirred for 10 min in the dark without applying any potential. The solution temperature during the experiments was ca. 25 °C (room temperature).
In order to clarify if the oxidation products could be reduced at the cathode, some PEC experiments were performed by using 3-pyridinemethanal (0.5 mM) or vitamin B3 (0.5 mM) as the starting reagents in the same PEC system (applied potential 0.5 V, pH 7, [Na2SO4] = 5 mM, stirring speed: 400 rpm, in the presence of air) used for 3-pyridinemethanol oxidation.
Some EC, PC and PEC experiments were also performed in the absence of O2. To this aim, 0.5 mM 3-pyridinemethanol, 3-pyridinemethanal or vitamin B3 was oxidized in a N2 atmosphere to investigate the role of O2.
2.6 Analytical techniques
Qualitative and quantitative determinations at fixed time intervals of the molecules present in the reacting solution were performed by means of a HPLC (Shimadzu, Prominence LC-20A model and SPD-M20A Photodiode Array Detector). The column (Phenomenex Synergi 4 μm Hydro-RP 80A) temperature was 40 °C and the eluent consisted of deionised water and methanol (60:40, v/v). The flow rate of the eluent was 0.2 cm3 min−1. UV-vis spectra and retention times of the substrate and products were compared with those of the standards supplied by Sigma-Aldrich (≥98%).
The mineralized CO2 values were evaluated using a total organic carbon analyser (TOC-LCPN model, Shimadzu). CO2 selectivity values were divided by 6.
Product selectivity, conversion and C-balance values were calculated as follows:
| Selectivity(%) = ([produced 3-pyridinemethanal or vitamin B3]/converted 3-pyridinemethanol) × 100; |
| Conversion(%) = ([reacted 3-pyridinemethanol]/[initial 3-pyridinemethanol]) × 100 |
C-balance (%) values were calculated by considering the un-reacted 3-pyridinemethanol, the produced 3-pyridinemethanal and vitamin B3, and CO2 derived from mineralization after 50% conversion.
3 Results and discussion
3.1 Characterization results
The XRD patterns of nanotube structured TiO2 on the surface of photoanodes together with the phase of the Ti plate are reported in Fig. 1 and 2. The XRD peaks at 2θ = 25.58°, 38.08°, 48.08°, and 54.58° and at 2θ = 27.5°, 36.5°, 41.0°, 54.1°, and 56.5° can be attributed to the anatase and rutile phases, respectively,52 while those at 2θ = 34.95°, 38.25°, 40.05°, and 52.90° can be attributed to metal Ti.25 Uncalcined nanotube structured TiO2 showed to be amorphous as it did not show any XRD patterns (Fig. S5†). The thermally oxidized photoanode, Ti/TiO2-500, is non-nanotube structured and it was used for the sake of comparison. This electrode surface was covered with a thin film of TiO2 in the rutile phase as indicated by XRD analyses (Fig. S5†).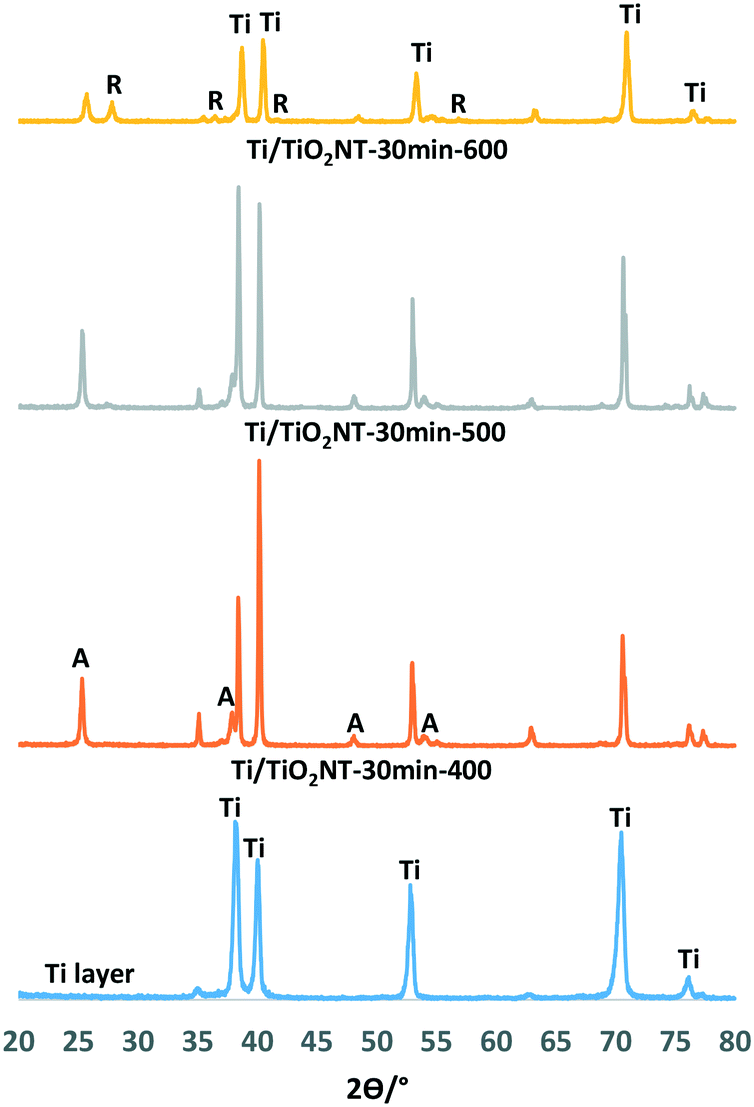 | ||
| Fig. 1 XRD patterns of the Ti/TiO2-NT-30min-Y anodes. | ||
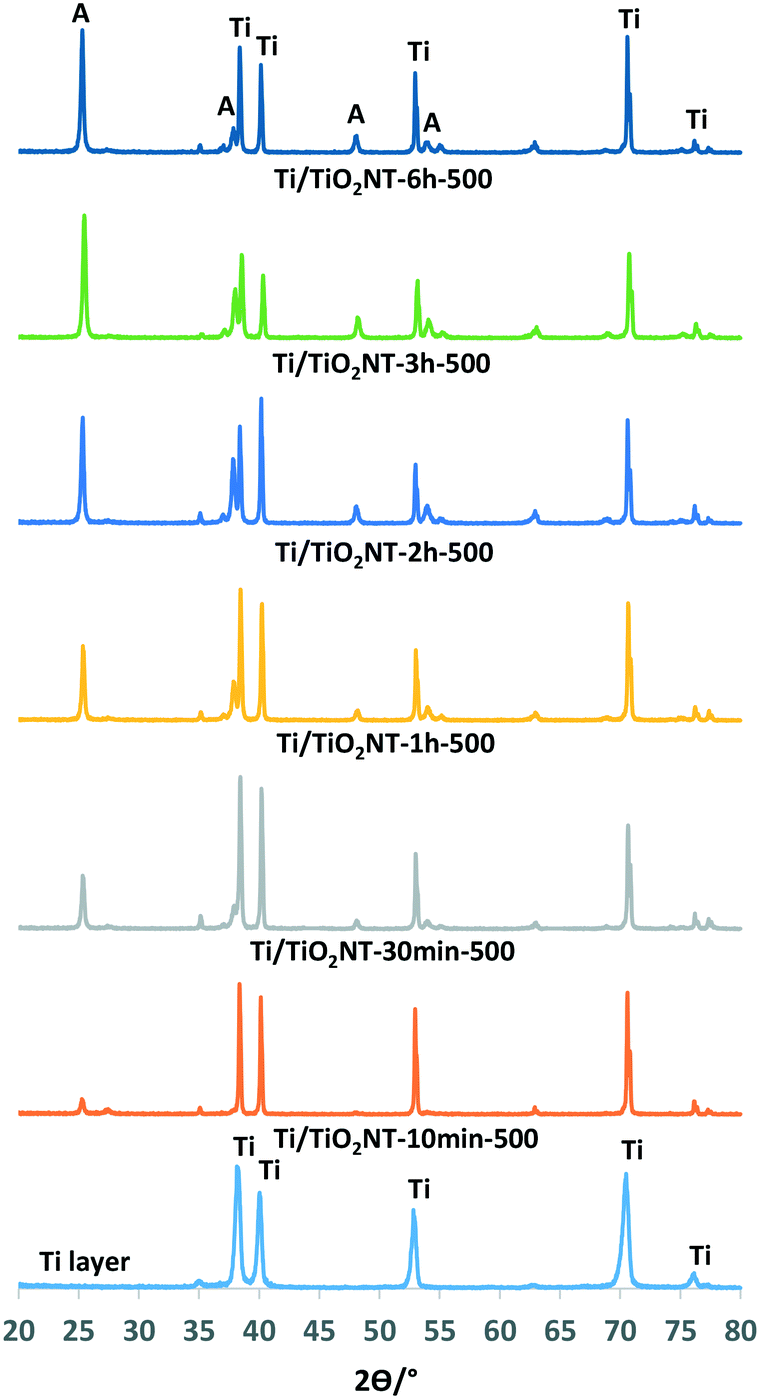 | ||
| Fig. 2 XRD patterns of the Ti/TiO2NT-X-500 photoanodes. | ||
Fig. 1 shows the XRD patterns of Ti/TiO2NT-30min-400, Ti/TiO2NT-30min-500 and Ti/TiO2NT-30min-600 anodes prepared in ethylene glycol and thermally treated at different temperatures together with the diffractogram of the Ti plate. Table 1 shows the TiO2 phases on the anode surfaces, the primary particle size of each TiO2 phase (calculated by the Scherrer equation) and the peak area values of the main peaks (101) of anatase and rutile. XRD analyses show that the Ti/TiO2NT-30min-400 photoanode contains only anatase TiO2, and Ti/TiO2NT-30min-500 mainly anatase with traces of rutile, whilst significant amounts of both phases are in Ti/TiO2NT-30min-600. The rutile peak area (101) of the Ti/TiO2NT-30min-600 plate is close to the anatase peak area. As the most thermodynamically stable TiO2 phase is rutile,53 its XRD peak intensity increases by increasing the calcination temperature, as expected. The average primary particle sizes of the anatase and rutile nanoparticles are quite similar in the range of 21–37 nm and 21–42 nm, respectively. However, reliability of the primary particle sizes of rutile is low due to the very low intensity of the peaks.
| Electrode | Crystalline phase | Anatase peak area (101) | Rutile peak area (101) | Primary particle size of A (nm) | Primary particle size of R (nm) |
|---|---|---|---|---|---|
| Ti/TiO2NT-30min-400 | A | 114 | — | 35 | — |
| Ti/TiO2NT-30min-500 | A + trace R | 139 | 6.2 | 36 | 40 |
| Ti/TiO2NT-30min-600 | A + R | 68.0 | 43 | 21 | 28 |
| Ti/TiO2NT-10min-500 | A + trace R | 34.8 | 12 | 34 | 35 |
| Ti/TiO2NT-1h-500 | A + trace R | 178 | 4.2 | 37 | 42 |
| Ti/TiO2NT-2h-500 | A + trace R | 276 | 7.2 | 36 | 36 |
| Ti/TiO2NT-3h-500 | A + trace R | 337 | 2.8 | 32 | 21 |
| Ti/TiO2NT-6h-500 | A + trace R | 316 | 6.3 | 37 | 30 |
Fig. 2 shows the XRD patterns of the nanotube structured TiO2 photoanodes prepared at different anodic oxidation times (10 min to 6 h) and calcined at 500 °C. The main TiO2 phase on the anode surface is anatase, but also traces of rutile are present. Moreover, the increase in the peak intensity of the anatase phase by the anodic oxidation time (see also Table 1) could be related to the length of the nanotubes on the Ti surface.41 The above hypothesis is valid only if the nanotube morphology and the thermal treatment temperature are very similar for the various samples.
The average thickness, internal diameter and length of the nanotubes on the photoanodes evaluated using the SEM images are reported in Table 2. Tube length values increased by increasing the anodic oxidation time (10 min to 6 h), used for the preparation of the nanotubes, from ca. 460 to 4500 nm. This result is in accord with the peak intensity of the XRD patterns of the photoanodes in which long tubes exhibit high intensity of the XRD peaks. Anatase peak area values increased from the Ti/TiO2NT-10min-500 to the Ti/TiO2NT-3h-500 anode, then they slightly decreased for the Ti/TiO2NT-6h-500 one. Some nanotubes on the Ti/TiO2NT-6h-500 anode surface broke, due to the very long preparation time. For this reason, the peak area value, in this case, showed to be smaller than that of Ti/TiO2NT-3h-500. This finding suggests that the layer on the Ti/TiO2NT-6h-500 anode was not sufficiently thick for PC or PEC applications. An additional explanation for the observed small peak area could be the detection limit of the XRD detector. For tube lengths higher than ca. 2 μm, in fact, the XRD peak area results are not reliable, and a direct correlation between the peak intensity and the tube length cannot be made.
| Electrode | Wall thickness (nm) | Internal diameter (nm) | Tube length (nm) |
|---|---|---|---|
| Ti/TiO2NT-10min-500 | 17 | 23 | 460 |
| Ti/TiO2NT-30min-400 | 18 | 24 | 870 |
| Ti/TiO2NT-1h-500 | 17 | 28 | 2000 |
| Ti/TiO2NT-3h-500 | 22 | 40 | 2500 |
| Ti/TiO2NT-6h-500 | 22 | 45 | 4500 |
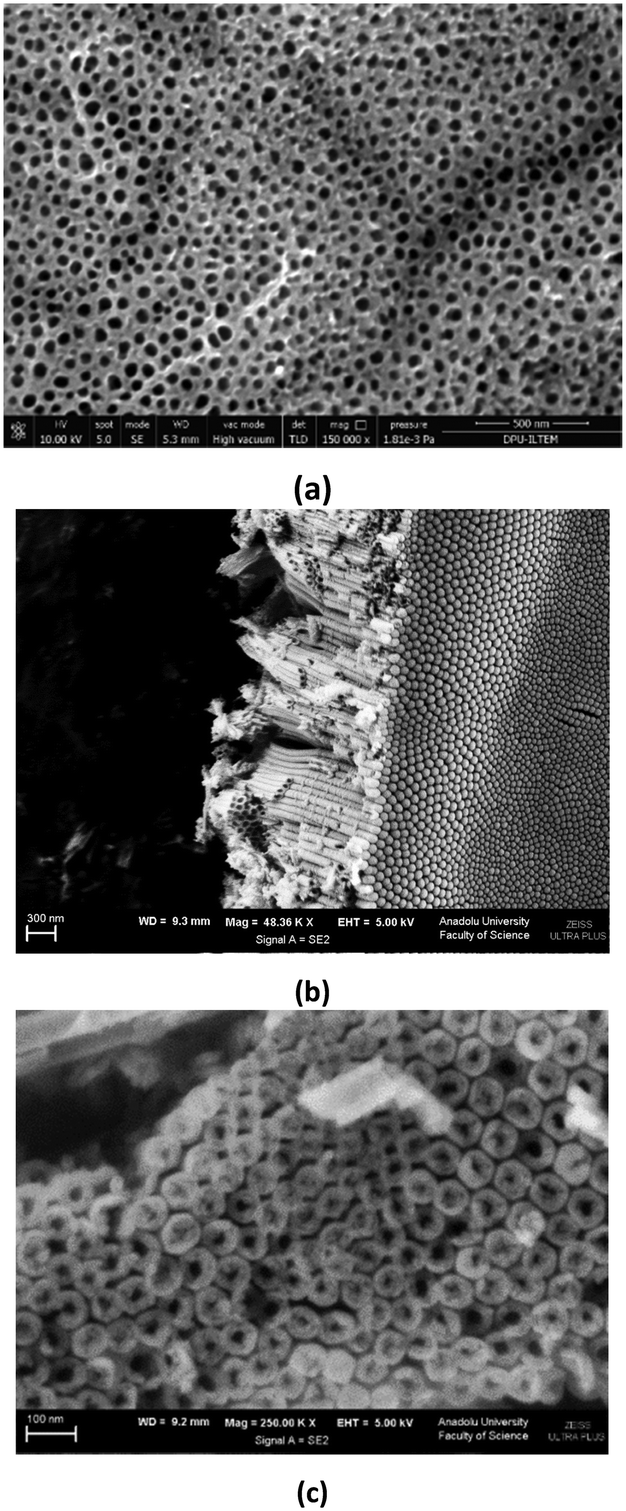
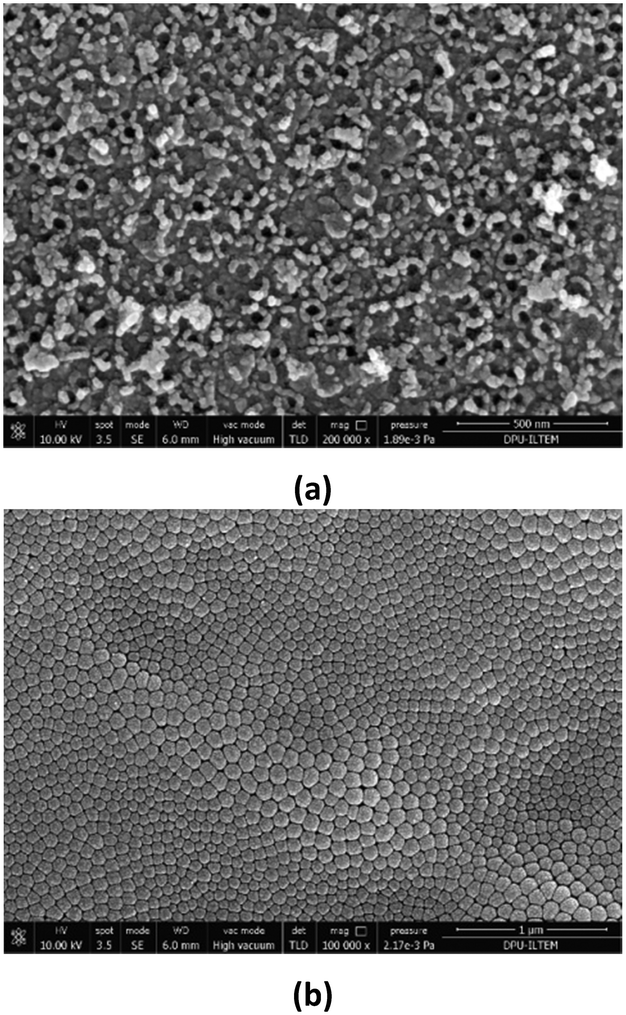
Wall thickness values (ca. 20 nm) of the nanotubes are close to each other. Average internal diameter values increase from ca. 23 to 45 nm by using a longer anodic oxidation time, because the nanotubes form from outside to inside. Fig. S6† shows the SEM image of the Ti/TiO2-500 sample. The TiO2 film on the Ti plate is non-nanotube structured with a slightly rough morphology. Fig. 3–6 and S7–S13† show the SEM images of the nanotube structured photoanodes. Fig. 3 shows the top (3a) and bottom (3b) view SEM images of the nanotubes on the Ti/TiO2NT-2h-500 photoanode. It can be noticed that TiO2 on the plate exists as a nanotube structured material, and notably the nanotubes are homogeneously distributed on the surface of the Ti plate. The bottom parts of the nanotubes are closed, they have different dimensions, and each of them is made up of many TiO2 nanoparticles of a few nanometers.
 | ||
| Fig. 3 SEM images of the Ti/TiO2NT-2h-500 anode: a) top view and b) bottom view. | ||
 | ||
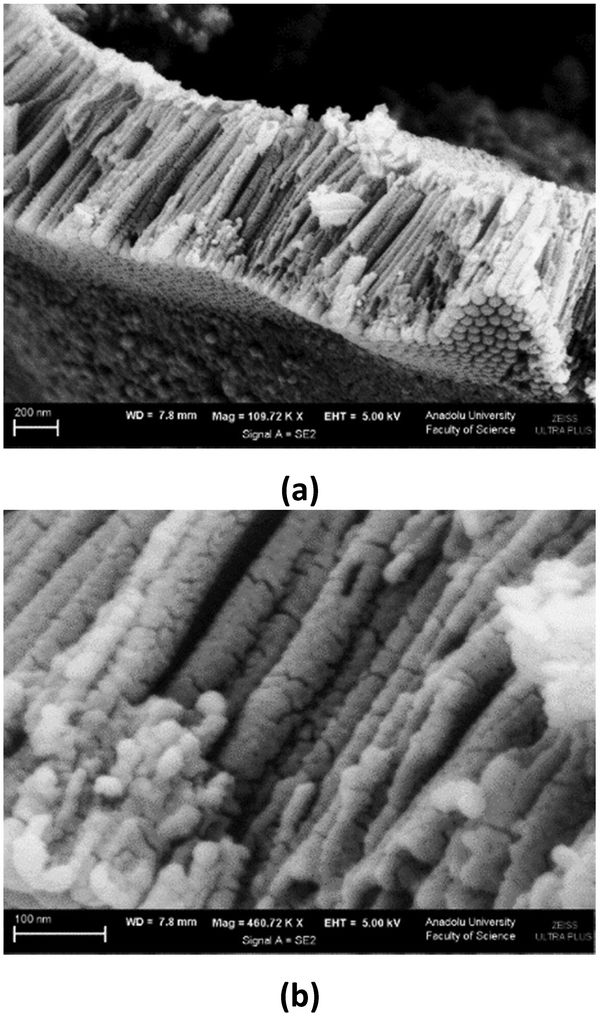
| Fig. 4 SEM images of the Ti/TiO2NT-3h-500 anode. a) Top view, b) cross section-bottom view and c) close to the bottom view. | ||
 | ||
| Fig. 5 Cross section view SEM images of the Ti/TiO2NT-30min-400 anode (magnification: 110000× (a) and 460000× (b)). | ||
 | ||
| Fig. 6 Top (a) and bottom (b) view SEM images of the Ti/TiO2NT-6h-500 anode. | ||
The SEM images of the Ti/TiO2NT-3h-500 anode are shown in Fig. 4. The nanotubes appear to be well ordered. The darker parts on the anode are the weak ones (Fig. 4a). As can be noticed from the observation in Fig. 4b, nanotube formation is from top to bottom, and for this reason, nanotube inner diameters close to the bottom part are very narrow (1–30 nm, see Fig. 4c). The cross-section length of the anode is ca. 2.5 μm. The cross-section view images of the Ti/TiO2NT-30min-400 photoanode and the agglomerated TiO2 nanoparticles are shown in Fig. 5.
Fig. 6 and S13† show some SEM images of the Ti/TiO2NT-6h-500 photoanode. According to the bottom view image of the layer (Fig. 6b), it looks like a honeycomb structure; the Ti surface was completely covered by TiO2 nanotubes in different sizes, mainly in the range of 60–85 nm. In addition, some diameters are very big, i.e. ca. 130 nm. According to the top view image of the anode (Fig. 6a and S13b†), the nanotube order is different from that of the other nanotube structured anodes. Indeed, some nanotubes are closed and this could be due to the long anodic oxidation time.41 For this reason, the effective surface area is low, consequently the PC and PEC activity of the layer was lower than expected (see in the following).
Fig. 7 shows the (photo)current profiles for the photoanodes prepared at different anodic oxidation times and calcined at 500 °C. The reference electrode is Ag/AgCl (3 M KCl), and 0 V represents the potential with respect to that electrode. Consequently, the existing potential versus SHE (standard hydrogen electrode) is 0.210 V. Measurements were carried out in the presence of 0.5 mM 3-pyridinemethanol and 5 mM Na2SO4 or 50 mM Na2SO4 at 0.5 V. Linear relationships between the photocurrent values and the anodic oxidation time exist up to 3 h. However, the electrode with the longest nanotube (Ti/TiO2NT-6h-500) did not show the highest photocurrent value. This unexpected result could be due to Ti/TiO2NT-6h-500's partially closed nanotube structure, as suggested by the top view of the SEM image (see Fig. 6a). Probably, UV light cannot impinge the inner walls of the nanotubes. In the presence of 50 mM Na2SO4, the differences among the photocurrent values for each anode are more significant than those observed when a 5 mM salt solution was used. Probably, this finding is due to the high ion concentration. Indeed, Fig. S14† shows the photocurrent values of the Ti/TiO2NT-30min-500 anode for different Na2SO4 concentrations. The plot of current versus concentration is similar to a Langmuir isotherm (Fig. S14b†); the current values increased up to ca. 5.2 mA in the presence of 25 mM Na2SO4, and then they remained almost constant.
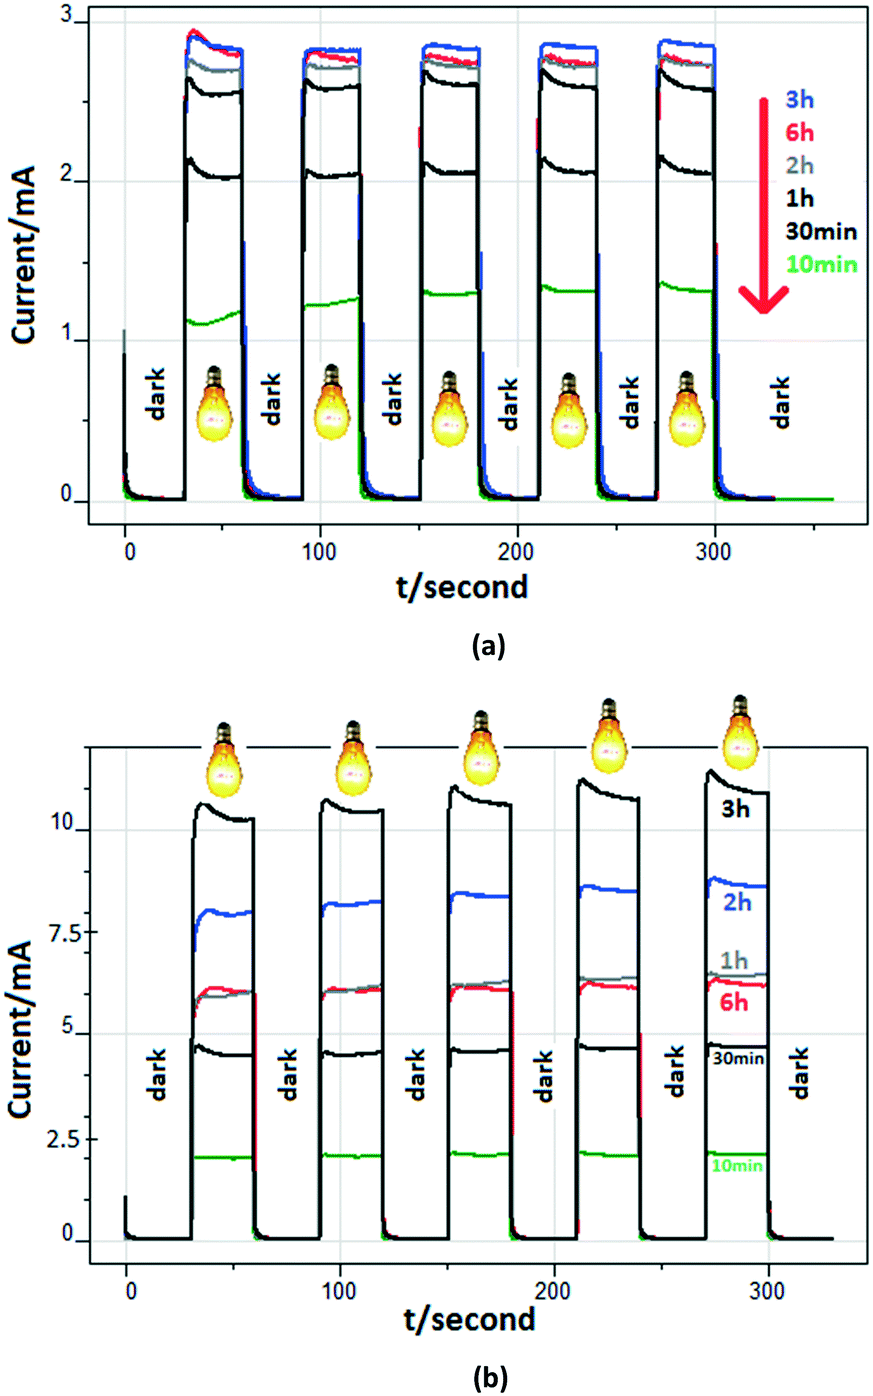 | ||
| Fig. 7 The (photo)current profiles of the anodes prepared at different anodic oxidation times and calcined at 500 °C. Measurements were carried out in the presence of 0.5 mM 3-pyridinemethanol and 5 mM (a) or 50 mM (b) Na2SO4. Applied potential: 0.5 V vs. Ag/AgCl (3 M KCl). pH ∼7. | ||
Fig. S15† shows the photocurrent values obtained for the PEC experiments performed with the Ti/TiO2NT-30min-500 photoanode at different applied potentials. As expected, by increasing the potential values, the current values increased.54
Fig. 8 shows the current–potential profiles of the Ti/TiO2NT-30min-500 and Ti/TiO2NT-3h-500 anodes in the presence and absence of 3-pyridinemethanol in solution. Current values were not observed significantly in the dark, while by increasing the potential under UV irradiation and in the presence of the substrate, the current values increased up to ca. 5 and 7 mA for Ti/TiO2NT-30min-500 and Ti/TiO2NT-3h-500, respectively. Notably, in the presence of 3-pyridinemethanol, higher photocurrent values were obtained with respect to those determined in the absence of the substrate. Moreover, this difference was more significant for the longer nanotube structured anode (Ti/TiO2NT-3h-500).
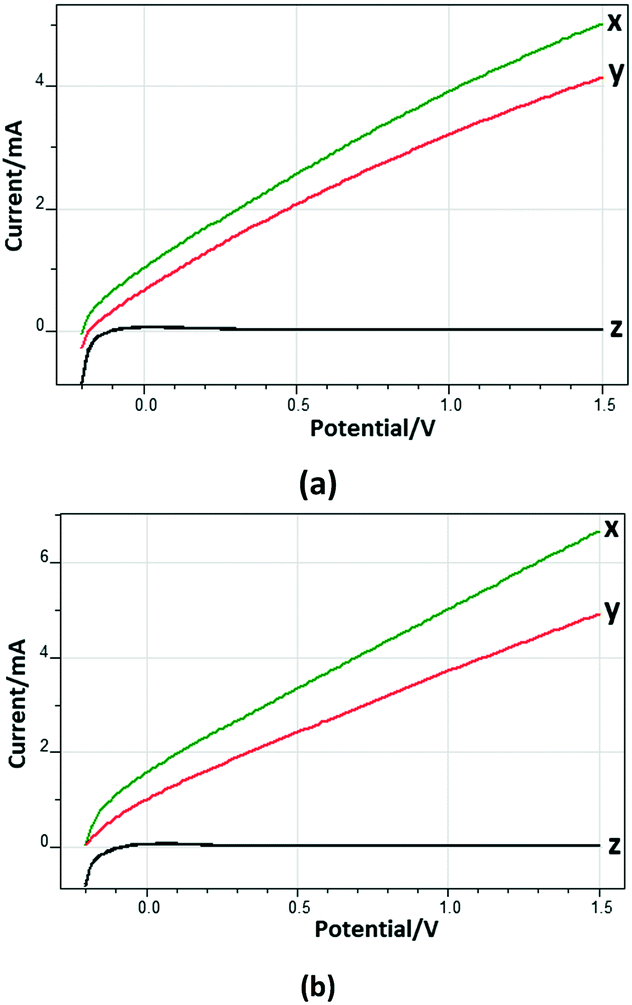 | ||
| Fig. 8 The current–potential profiles of the Ti/TiO2NT-30min-500 (a) and Ti/TiO2NT-3h-500 (b) anodes in the presence (x) and in the absence (y) of 0.5 mM 3-pyridinemethanol. [Na2SO4] = 5 mM. pH ∼7. The curves z were obtained in the dark (EC) and under the same experimental conditions of x and y. Reference electrode: Ag/AgCl (3 M KCl). Scan rate: 10 mV s−1. | ||
Fig. S16† shows the photocurrent values of the Ti/TiO2NT-30min-X anodes prepared at different calcination temperatures (400, 500 and 600 °C). The photocurrent values of the anodes were in the order Ti/TiO2NT-30min-500 > Ti/TiO2NT-30min-400 > Ti/TiO2NT-30min-600, although they appear to be quite similar. Calcination temperature influenced both the crystal phases and the crystallinity of TiO2. The crystallinity increased by increasing the heat treatment temperature. The XRD patterns of Ti/TiO2NT-30min-400, Ti/TiO2NT-30min-500 and Ti/TiO2NT-30min-600 indicate that the first two samples are in the anatase phase, whilst a significant amount of rutile is present in the third one. Therefore, 500 °C was chosen as the optimum calcination temperature to obtain the anatase phase with good crystallinity.
Fig. S17 and S18† show the (photo)current values of the Ti/TiO2-500 and Ti/TiO2NT-3h-500 photoanodes obtained under 400 rpm and without stirring. Under UV irradiation, higher photocurrent values were observed at a 400 rpm stirring speed with respect to that measured without stirring. In the presence of solution with stirring, the electrolyte and substrate adsorption–desorption rate on the catalyst surface increased. The results showed that the solution stirring effect was more efficient on the nanotube structured anode (Ti/TiO2NT-3h-500), due to its higher surface area, with respect to the non-nanotube structured one.
Fig. 9 shows the (photo)current–potential profiles of the Ti/TiO2NT-30min-500 and Ti/TiO2NT-3h-500 anodes at different pH values under UV and dark conditions. The high current values at pH 2 and 12 with respect to the neutral one are probably due to the increase of the contribution to the electrolytic concentration coming from HCl or NaOH (10 mM) (see Fig. S14 and S19†). In other words, only 5 mM Na2SO4 was used in the neutral medium, whilst HCl and NaOH at pH ca. 2 and 12, respectively, were used in addition to Na2SO4 (5 mM).
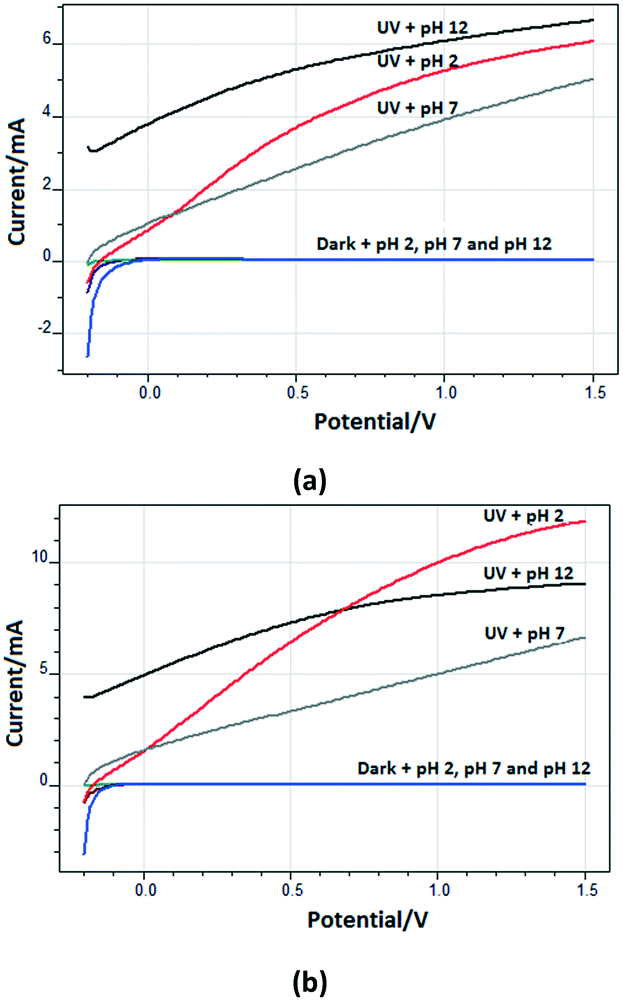 | ||
| Fig. 9 The (photo)current–potential profiles of the Ti/TiO2NT-30min-500 (a) and Ti/TiO2NT-3h-500 (b) anodes at different pH values under UV and dark conditions. [Na2SO4] = 5 mM and [HCl] = 10 mM at pH ∼2 and [Na2SO4] = 5 mM and [NaOH] = 10 mM at pH ∼12. Reference electrode: Ag/AgCl (3 M KCl). Scan rate: 10 mV s−1. | ||
3.2 Activity results
The following tables (Tables 3–5 and S1–S3†) show the PEC experimental results of partial 3-pyridinemethanol oxidation performed in aqueous Na2SO4 electrolyte solution and under UV irradiation. In particular, the initial reaction rate (−r0), the first order rate constant (k), and the half-life time (t1/2) values of the substrate are shown. Moreover, the selectivity values of 3-pyridinemethanal and vitamin B3 production after 15% and 50% conversion, the CO2 selectivity after 3 h of reaction, the conversion values after 1 h and 3 h of reaction, and the pH value after 3 h of reaction are also reported.| Electrode | −r0 × 103 (mM h−1) | k × 103 (h−1) | t 1/2 (h) | S 3-Pyridinemethanal (%) | S Vitamin B3 (%) | S [CO2]/6 X3 h (%) | X 1 h (%) | X 3 h (%) | pH X3 h | C balance (%), X0.5 | |||
|---|---|---|---|---|---|---|---|---|---|---|---|---|---|
| X 0.15 | X 0.5 | X 0.15 | X 0.5 | ||||||||||
| −r0: initial reaction rate, k: first order rate constant, and t1/2: half-life time. a S 3-Pyridinemethanal. b S Vitamin B3: 3-pyridinemethanal and vitamin B3 selectivities after 15% (X0.15) and 50%. (X0.50) conversions. X1 h and X3 h: the conversion values after 1 h and 3 h of reaction, respectively. c CO2 selectivities were considered after 3 h of reaction (X3 h). d C-balance values were calculated after 50% conversion (X0.5). | |||||||||||||
| Ti/TiO2-500 | PEC | 25.9 | 44.3 | 15.6 | Low | 5 | 12 | 6.27 | |||||
| Ti/TiO2NT-10min-500 | PEC | 94.9 | 142 | 4.88 | 38 | 38 | 21 | 17 | 35 | 5.88 | |||
| Ti/TiO2NT-30min-500 | PEC | 109 | 247 | 2.81 | 19 | 8 | 39 | 35 | 39 | 20 | 52 | 5.17 | 82 |
| Ti/TiO2NT-1h-500 | PEC | 110 | 246 | 2.82 | 18 | 7 | 31 | 26 | 38 | 20 | 52 | 5.32 | 71 |
| Ti/TiO2NT-2h-500 | PEC | 155 | 395 | 1.75 | 16 | 7 | 36 | 30 | 48 | 31 | 69 | 5.21 | |
| Ti/TiO2NT-3h-500 | PEC | 160 | 357 | 1.94 | 16 | 7 | 25 | 22 | 51 | 29 | 66 | 5.41 | |
| Ti/TiO2NT-6h-500 | PEC | 112 | 252 | 2.75 | 23 | 7 | 31 | 27 | 49 | 20 | 53 | 5.61 | 83 |
| Ti/TiO2NT-3h-500 | EC | — | — | 0 | |||||||||
| Ti/TiO2NT-3h-500 | PC | 45.8 | 104 | 6.66 | 51 | 35 | 8.4 | 10 | 27 | 6.04 | |||
| Electrode | Stirring speed (rpm) | −r0 × 103 (mM h−1) | k × 103 (h−1) | t 1/2 (h) | S 3-Pyridinemethanal (%) | S Vitamin B3 (%) | S [CO2]/6 X3 h (%) | X 1 h (%) | X 3 h (%) | pH X3 h | |||||
|---|---|---|---|---|---|---|---|---|---|---|---|---|---|---|---|
| X 0.10 | X 0.15 | X 0.50 | X 0.10 | X 0.15 | X 0.50 | ||||||||||
| −r0: initial reaction rate, k: first order rate constant, and t1/2: half life time. a S 3-Pyridinemethanal. b S Vitamin B3: 3-pyridinemethanal and vitamin B3 selectivities after 10% (X0.10), 15% (X0.15) and 50% (X0.50) conversions. X1 h and X3 h: conversion values after 1 h and 3 h of reaction, respectively. c CO2 selectivities were considered after 3 h of reaction (X3 h). | |||||||||||||||
| Ti/TiO2-500 | PEC | 0 | 19.6 | low | 2 | 6 | |||||||||
| Ti/TiO2-500 | PEC | 200 | 13.3 | 34.1 | 55 | 22 | low | 3 | 10 | 6.92 | |||||
| Ti/TiO2-500 | PEC | 400 | 14.4 | 30.0 | 24.5 | 56 | 21 | low | 3 | 9 | 6.87 | ||||
| Ti/TiO2-500 | PEC | 600 | 19.0 | 37.0 | 18.8 | 54 | 21 | low | 4 | 10 | 6.22 | ||||
| Ti/TiO2NT-3h-500 | PC | 0 | 31.4 | 56.3 | 49 | 18 | low | 16 | 7 | ||||||
| Ti/TiO2NT-3h-500 | PC | 200 | 60.4 | 116 | 51 | 18 | low | 11 | 29 | 7 | |||||
| Ti/TiO2NT-3h-500 | PC | 400 | 93.8 | 198 | 56 | 19 | 3.8 | 19 | 44 | 6.83 | |||||
| Ti/TiO2NT-3h-500 | PC | 600 | 110 | 192 | 51 | 19 | low | 19 | 44 | 7 | |||||
| Ti/TiO2NT-3h-500 | PEC | 0 | 133 | 8 | 9 | 32 | 5.82 | ||||||||
| Ti/TiO2NT-3h-500 | PEC | 200 | 127 | 238 | 2.91 | 34 | 18 | 40 | 37 | 24 | 23 | 51 | 6.16 | ||
| Ti/TiO2NT-3h-500 | PEC | 400 | 134 | 271 | 2.50 | 42 | 27 | 45 | 36 | 21 | 25 | 55 | 6.24 | ||
| Ti/TiO2NT-3h-500 | PEC | 600 | 154 | 336 | 2.06 | 39 | 32 | 44 | 34 | 24 | 31 | 64 | 6.20 | ||
Table 3 shows the PEC 3-pyridinemethanol oxidation results of the photoanodes prepared at different anodic oxidation times (10 min to 6 h). The non-nanotube structured Ti/TiO2-500 anode prepared by thermal oxidation was used for comparison. The conversion, −r0, and k values are correlated with the activity; therefore k values were generally used to compare the activities. All the nanotube structured anodes showed higher PEC activity than Ti/TiO2-500, because of the higher surface area of the nanotube structured TiO2. For instance, the k value of the Ti/TiO2NT-10min-500 anode was 3.2 times higher than that of Ti/TiO2-500 (0.142 vs. 0.0443 h−1).
The nanotube length increased by increasing the anodic oxidation time (see the SEM images). Therefore, the PEC activity increased up to 3 h of anodic oxidation. However, the activity of Ti/TiO2NT-6h-500 was lower than that of Ti/TiO2NT-3h-500, and this finding could be mainly due to the presence of partially closed nanotube entrances (see Fig. 6). This unexpected result is compatible with the photocurrent values of the photoanodes (see Fig. 7). In addition, broken nanotubes were observed on the Ti/TiO2NT-6h-500 surface because of their very long length which can be attributed to the very long anodic oxidation time (6 h). The relationship between the nanotube length and the activity is not linear; for instance, the tube length of Ti/TiO2NT-2h-500 is ca. 10 times higher than that of Ti/TiO2NT-10min-500, but their activity ratio is only ca. 3. Photons were more efficient on the outside surface of the nanotubes, and the efficiency decreased due to absorption, transmission and reflection of them inside the TiO2 nanotubes. Table 3 also shows the experimental results of PC and EC partial oxidation of 3-pyridinemethanol on the Ti/TiO2NT-3h-500 anode. No activity was observed in the EC run, while 27% conversion was observed in the PC experiment. However, synergy was achieved (66% conversion) by combining EC and PC (PEC). Indeed, the used potential in the PEC experiments allowed the electrons to migrate across the electrode and the separation of the e− and h+ pairs was improved, thereby increasing the possibility of the reaction to occur on the surface of the working electrode (photoanode).25,49
C-balance (%) values of some runs were calculated for 50% conversion (see Table 3). The obtained values (71–83%) showed that the main products are 3-pyridinemethanal, vitamin B3 and CO2. The others could be mainly aliphatic species coming from open-ring products. Eqn (1)–(6) show the production of radical species during PEC reactions occurring on the anode and cathode in the presence of oxygen.21 The roles of these species are shown in Scheme 1.
| TiO2 + hν → e− (anode) + h+ (anode) | (1) |
| e− (anode) → e− (cathode) | (2) |
| O2 + e− (cathode) → ˙O2− | (3) |
| ˙O2− + H+ → HO2˙ | (4) |
| 2HO2˙ → O2 + H2O2 | (5) |
| H2O + h+ (anode) → H+ + ˙OH | (6) |
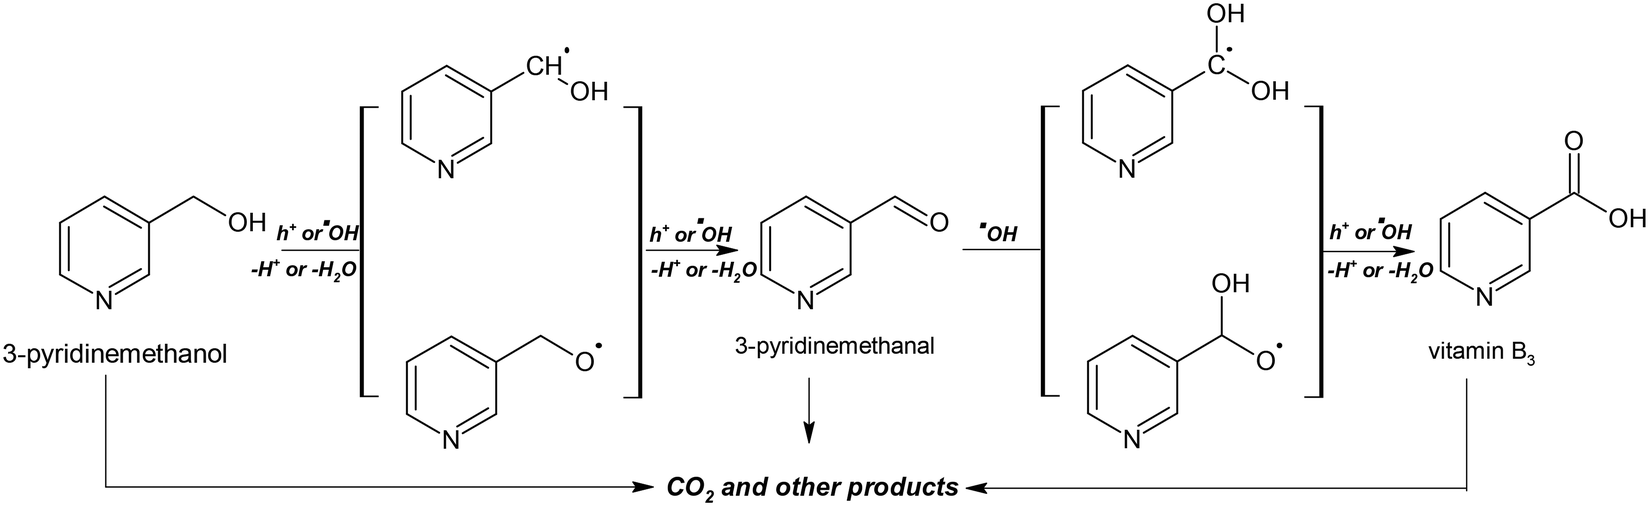 | ||
| Scheme 1 The proposed mechanism for PC and PEC oxidation of 3-pyridinemethanol. | ||
In order to clarify if the oxidation products could be reduced at the cathode, a PEC experiment was performed by using 3-pyridinemethanal as the starting reagent in the same PEC system used for 3-pyridinemethanol oxidation, and the results are shown in Fig. S20, S21 and Table S4.† After the PEC experiment (the first 90 min), the reaction was continued as a PC experiment for additional 90 min. The concentrations of vitamin B3 (its oxidation product), and 3-pyridinemethanol (its reduction product) were followed. During the PEC experiment (the conversion was ca. 54%), a significant amount of vitamin B3 (ca. 50% selectivity after 50% conversion) was obtained, whilst 3-pyridinemethanol was detected in a very small amount (ca. 10% selectivity after 50% conversion). After 90 min, during the further PC experiment, no reduction of the aldehyde was achieved, as expected. To the same aim, PEC vitamin B3 oxidation was also performed and no reduction products (3-pyridinemethanol and 3-pyridinemethanal) were detected throughout the run. These results show that the other product, vitamin B3, cannot be reduced at the cathode under the experimental conditions used, probably due to its high reduction potential with respect to the aldehyde. The vitamin B3 conversion was also very low (12% for 90 min). Another PC reaction starting from 3-pyridinemethanal was also performed and no 3-pyridinemethanol was obtained. The conversion and vitamin B3 selectivity for a 90 min reaction time were 24% and 71%, respectively (Table S4†).
Some PEC experiments were also performed in the absence of O2 and the results are shown in Table S4.† 3-Pyridinemethanol, 3-pyridinemethanal or vitamin B3 was oxidized (and reduced) in a N2 atmosphere to investigate the role played by O2. The PEC conversions of 3-pyridinemethanol in the presence and in the absence of O2 were similar to each other (55 and 59% after 3 h, respectively), whilst product selectivities after 3 h were different: in the presence of O2versus in the absence of O2 23 vs. 11% for the aldehyde and 37 vs. 45% for vitamin B3. The total selectivities towards the aldehyde and the acid (vitamin B3) were slightly higher in the presence of O2 (60 vs. 56%). These results show that the selective 3-pyridinemethanol oxidation is more favourable under atmospheric conditions which are much more economic with respect to N2.
Fig. S21† shows that results of PEC (the first 90 min), EC (the subsequent 90 min) and PC (the subsequent 90 min) reactions of 3-pyridinemethanal to 3-pyridinemethanol and vitamin B3 in a N2 atmosphere. Under PEC conditions, the reduction product (3-pyridinemethanol) was also obtained (16% selectivity after 77% conversion). This run was faster (77 vs. 54% conversion for 90 min) than that in the presence of O2. After the PEC experiment, EC and PC experiments in N2 medium were continued and no conversion was achieved. These runs show that O2 must be present in the system for PC oxidation, whilst it is not necessary in the PEC system. Probably, O2 that can be used for the substrate oxidation was supplied by water oxidation at the anode of the PEC system.
Vitamin B3 oxidation was also performed in a N2 atmosphere and similar results in the presence of O2 were obtained. The reduction products were not found and the oxidation rate was slow (16% conversion after 90 min). The last experiments were performed also at pH 4.3 that is the pH value of the 0.5 mM vitamin B3 solution. However, virtually the same results were found (Table S4†).
Scheme 1 shows the proposed mechanism for PC and PEC oxidation of 3-pyridinemethanol. The initial steps could be the interaction of h+ or hydroxyl radicals with 3-pyridinemethanol producing 3-pyridinemethanal that is subsequently oxidized to vitamin B3. The over-oxidation products of these valuable molecules are mainly aliphatic species and CO2. For these reasons, by increasing the conversion, 3-pyridinemethanal selectivity decreased, while the CO2 amount increased. The Ti/TiO2NT-30min-500 anode showed the highest total 3-pyridinemethanal and vitamin B3 selectivity (Table 3).
The pH of the initial 3-pyridinemethanol solution in the presence of Na2SO4 was ca. 7; therefore the experiments were performed without adjusting the pH. The pH values at the end of the reaction were also reported and it was noticed that they decreased by increasing the quantity of acidic products, i.e. vitamin B3.
Fig. 10 shows the experimental results of PC and PEC oxidation of 3-pyridinemethanol concentrations versus irradiation time by using the Ti/TiO2NT-3h-500 anode. The conversion in the PC experiment was lower with respect to the PEC one, whereas the amounts of both products increased continuously (Fig. 10a). In the PEC run, the 3-pyridinemethanal amount reached a maximum and then decreased due to its transformation into vitamin B3. Contrary, vitamin B3 concentration increased continuously during the run (at least for 3 h).
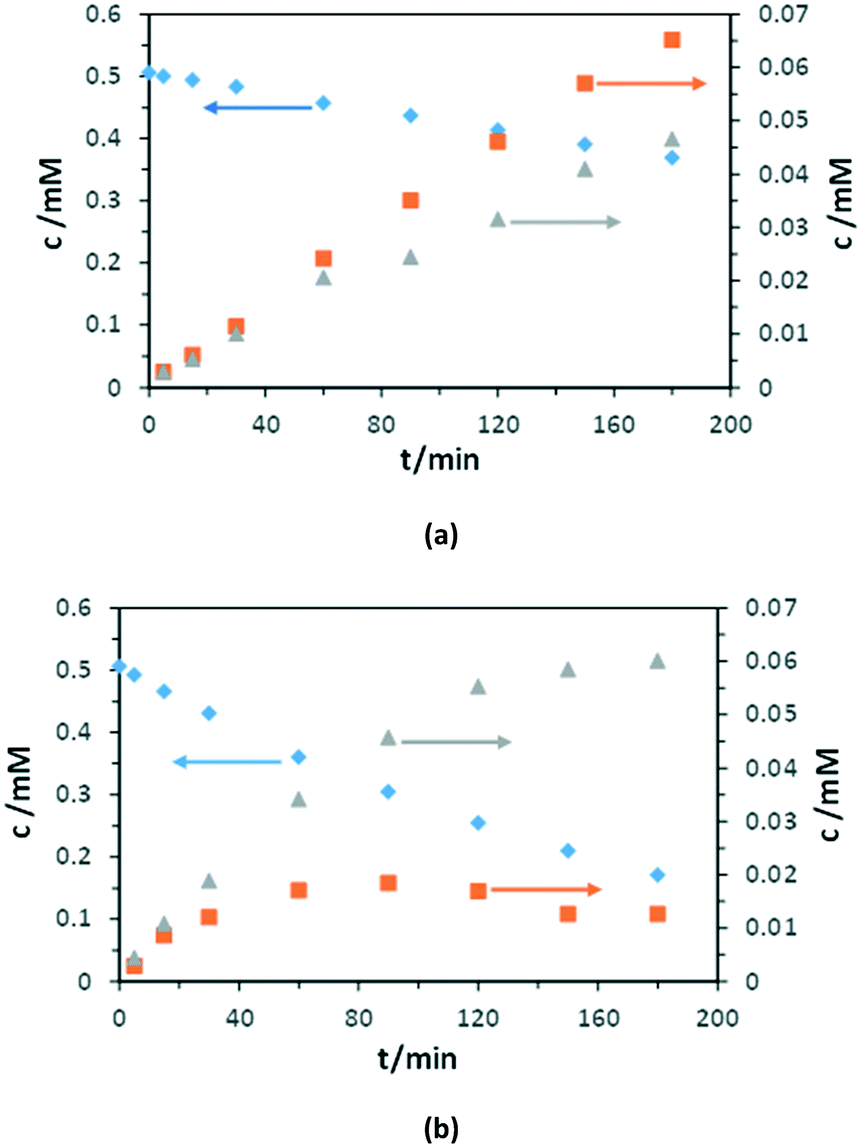 | ||
| Fig. 10 Results of PC (a) and PEC (b) oxidation of 3-pyridinemethanol (♦) to 3-pyridinemethanal (■) and vitamin B3 (▲) vs. time by using the Ti/TiO2NT-3h-500 anode under UV irradiation. [Na2SO4] = 50 mM, stirring speed: 200 rpm, pH ∼7. Applied potential for the PEC experiment: 0.5 V vs. Ag/AgCl (3 M KCl). | ||
Table S1† shows the experimental result of the Ti/TiO2NT-30min-Y photoanodes calcined at different temperatures (400–600 °C) for the PEC reaction. TiO2 of the uncalcined anode was amorphous and no EC, PC or PEC activity was observed. As discussed in the Characterization section, the calcination temperature influenced both the type of crystal phase formed and the crystallinity of TiO2.53 The Ti/TiO2NT-30min-500 electrode showed the highest activity and photocurrent value (see Fig. S16†). Consequently, the photoanodes showed to be more efficient in the PEC experiments with the anatase phase being more crystalline.
Table S2† shows the PEC experimental results of 3-pyridinemethanol oxidation by using the Ti/TiO2NT-30min-500 electrode at different Na2SO4 concentrations (1 to 50 mM). Fig. 11 shows the k and −r0 values evaluated from Table S2.† The k values did not increase significantly for salt concentrations higher than 5 mM. However, 3-pyridinemethanal selectivity decreased by increasing the salt concentration. Therefore, 5 mM Na2SO4 was chosen as the optimum electrolyte concentration by considering not only the product selectivity but also the environmental point of view.
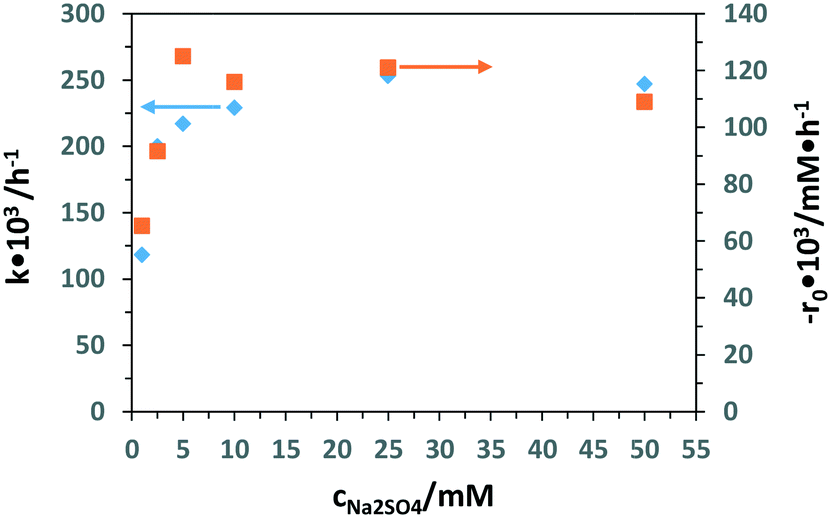 | ||
| Fig. 11 Results of the k (■) and −r0 (♦) values of PEC 3-pyridinemethanol (0.5 mM) oxidation at different Na2SO4 concentrations by using the Ti/TiO2NT-30min-500 electrode. Stirring speed: 200 rpm. pH ∼7. Applied potential: 0.5 V vs. Ag/AgCl (3 M KCl). | ||
Table S3† shows the experimental results of partial PEC oxidation of 3-pyridinemethanol by using the Ti/TiO2NT-30min-500 photoanode at different potential values (−0.1 to 0.9 V). Both −r0 and k values increased linearly up to 0.1 V, and then they virtually achieved a plateau (see Fig. 12). However, the aldehyde selectivity values decreased whilst vitamin B3 selectivities remained almost constant at potential values higher than 0.1 V. The same behaviour was also observed at high electrolyte concentration. Both high salt concentration and applied potential values favoured the oxidation of 3-pyridinemethanol, whilst no significant change of the vitamin B3 occurred. In other words, not only the aldehyde was transformed more easily into vitamin B3 under these conditions, but also the over-oxidation of intermediates occurred, and this behaviour can explain the low total selectivity observed. A PC run was also performed (Table S3†) under the same experimental conditions, and a much lower activity was observed, even lower than that of the PEC oxidation performed at −0.1 V (0.0915 vs. 0.133 h−1).
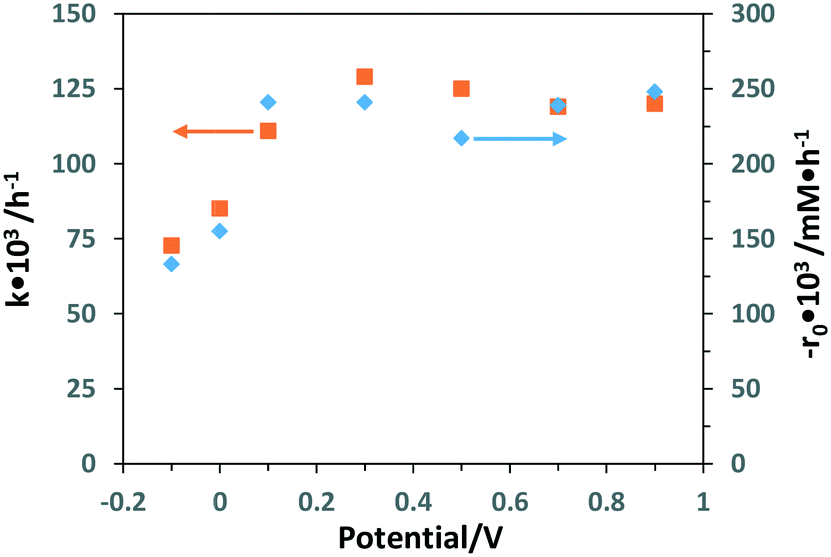 | ||
| Fig. 12 Results of k (■) and −r0 (♦) versus applied potential values of PEC oxidation of 3-pyridinemethanol (0.5 mM) by using the Ti/TiO2NT-30min-500 photoanode. [Na2SO4] = 5 mM. Stirring speed: 200 rpm. pH ∼7. Reference electrode: Ag/AgCl (3 M KCl). | ||
Table 4 shows the PC and PEC oxidation results of 3-pyridinemethanol at different stirring speeds by using the Ti/TiO2-500 and Ti/TiO2NT-3h-500 photoanodes. Fig. 13 also shows the plots of stirring speed vs. k values evaluated from Table 4. Notably, PC or PEC activities were observed even without stirring. By increasing the stirring speed, both PEC reaction rate and 3-pyridinemethanal selectivities increased significantly for the Ti/TiO2NT-3h-500 anode. The stirring speed increased the mass transfer of the substrate from the bulk of the solution, both on the surface and inside the nanotubes, therefore both adsorption and desorption rates of the substrate increased and a high reaction rate was observed. Probably, the increase of the desorption rate prevented the over-oxidation of the products, responsible for the decrease of selectivity. On the other hand, a medium stirring speed (ca. 200 rpm) was enough to obtain the maximum rate for the non-nanotube structured anode (Ti/TiO2-500) in which the mass transfer step occurred from the bulk of the solution to the anode external surface where there were a limited number of catalytic active sites. Photocurrent analyses also support this result; higher photocurrent differences were observed between stirring and no stirring conditions for the nanotube structured anode with respect to that observed in the presence of Ti/TiO2-500 (see Fig. S17 and S18†). PC runs of the Ti/TiO2NT-3h-500 anode were also carried out and no activity increase was observed for a stirring speed higher than 400 rpm. This last result could be due to more active sites on the TiO2 surface available during the PEC runs that need significant stirring speeds with respect to the PC ones. Different from the PEC experiments, the aldehyde and acid (vitamin B3) selectivities for PC runs were not influenced by the stirring speed. As in the PEC runs, the e− and h+ recombination rate was lower than that in the PC ones and stirring speed was more important for PEC runs to avoid over-oxidation of the products by fast desorption.
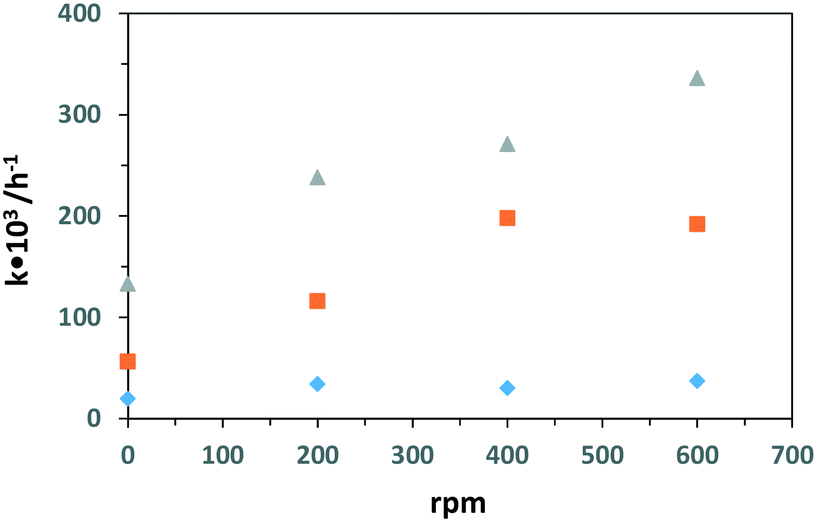 | ||
| Fig. 13 Results of k values vs. stirring speed (rpm) for the PEC runs by using Ti/TiO2-500 (♦), and Ti/TiO2NT-3h-500 (▲) and PC runs by Ti/TiO2NT-3h-500 (■) photoanodes. [Na2SO4] = 5 mM. pH ∼7. Applied potential for PEC runs: 0.5 V vs. Ag/AgCl (3 M KCl). | ||
Table 5 shows the effect of pH values on the PC and PEC oxidation of 3-pyridinemethanol by using the Ti/TiO2NT-3h-500 photoanode. In addition, Fig. 14 shows the plot of the pH vs. k values evaluated from the same table. The pH effect was very different for PC and PEC experiments. For instance, at ca. pH = 2.3 ([H3O+] = 10−2 M), almost no PC activity was observed and k values increased linearly by increasing the pH. Indeed, at pH ca. 12, the PC activity value was close to the PEC one. However, the PEC activity was very high at all pH values, especially under acidic conditions at which no or low PC activities were observed. The PC results are similar to our previous work18 in which Pt loaded home-prepared TiO2 and commercial TiO2 (Degussa P25) powdered catalysts were used and no or very low activity, respectively, was observed at very low pH (ca. 2.3). Probably, the stability of 3-pyridinemethanol increased significantly due to protonation of the nitrogen atom in the pyridine ring, and consequently its PC oxidation became very difficult (see Scheme 2). However, this difficulty can be overcome by photoelectrocatalysis.
| pH | −r0 × 103 (mM h−1) | k × 103 (h−1) | t 1/2 (h) | S 3-Pyridinemethanal (%) | S Vitamin B3 (%) | S [CO2]/6 X3 h (%) | X 1 h (%) | X 3 h (%) | pH X3 h | |||
|---|---|---|---|---|---|---|---|---|---|---|---|---|
| X 0.15 | X 0.50 | X 0.15 | X 0.50 | |||||||||
| a For this run, Na2SO4 was not used. −r0: initial reaction rate, k: first order rate constant, and t1/2: half-life time. b S 3-Pyridinemethanal. c S Vitamin B3: 3-pyridinemethanal and vitamin B3 selectivities after 15% (X0.15) and 50% (X0.50) conversions. X1 h and X3 h: the conversion values after 1 h and 3 h of reaction, respectively. d CO2 selectivities were considered after 3 h of reaction (X3 h). | ||||||||||||
| 2.31 | PC | 3.78 | 7.80 | 0 | 2 | 2.10 | ||||||
| 4.03 | PC | 34.7 | 59.5 | 11.6 | 45 | 9 | 6 | 16 | 4.02 | |||
| 7 | PC | 93.8 | 198 | 3.55 | 56 | 19 | 8.6 | 19 | 44 | 6.83 | ||
| 10.4 | PC | 120 | 218 | 3.18 | 27 | 33 | 49 | 35 | 1.0 | 22 | 48 | 8.12 |
| 12.4 | PC | 140 | 286 | 2.42 | 25 | 23 | 55 | 59 | 16 | 25 | 58 | |
| 2.38 | PEC | 153 | 415 | 1.67 | 54 | 48 | 29 | 36 | 5.3 | 30 | 71 | 2.21 |
| 4.04 | PEC | 179 | 375 | 1.85 | 44 | 31 | 32 | 37 | 22 | 31 | 68 | 3.61 |
| 7 | PEC | 134 | 271 | 2.50 | 42 | 27 | 45 | 36 | 21 | 25 | 55 | 6.24 |
| 10.1 | PEC | 167 | 320 | 2.16 | 40 | 24 | 32 | 35 | 21 | 31 | 63 | 7.91 |
| 12.4 | PEC | 125 | 307 | 2.26 | 22 | 6 | 45 | 38 | 31 | 25 | 60 | 11.9 |
| 12.4 | a PEC | 185 | 414 | 1.67 | 13 | 7 | 61 | 52 | 23 | 32 | 71 | 11.9 |
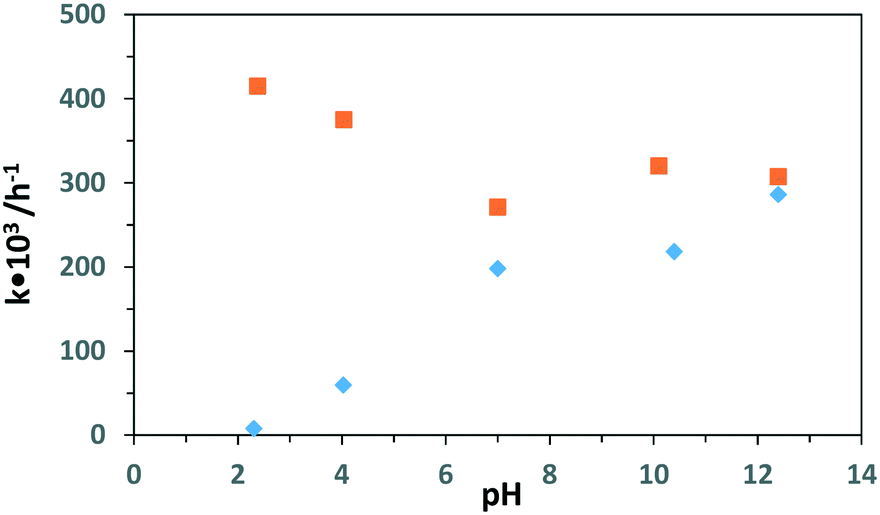 | ||
| Fig. 14 Results of k values vs. pH for the PC (♦) and PEC (■) runs by using the Ti/TiO2NT-3h-500 photoanode. [Na2SO4] = 5 mM. Stirring speed: 400 rpm. Applied potential for PEC runs: 0.5 V vs. Ag/AgCl (3 M KCl). | ||
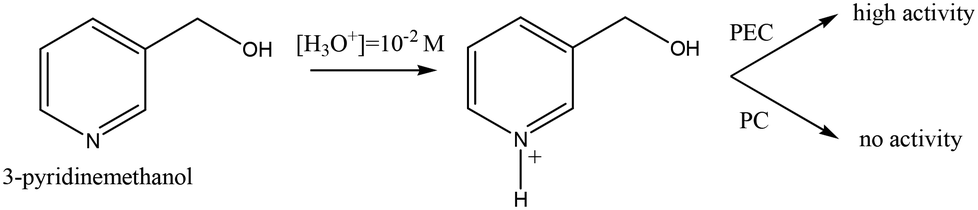 | ||
| Scheme 2 The protonation of 3-pyridinemethanol at pH 2.3 ([H3O+] = 10−2 M). | ||
Another important point is that 3-pyridinemethanal selectivities under basic conditions were low, while vitamin B3 selectivities were high both for PC and PEC runs. The transformation of 3-pyridinemethanal into vitamin B3 was more easy under basic conditions.55
A PEC run as shown in Table 5 was performed in the absence of Na2SO4 and in that case, the conductivity was due to hydroxyl ions. This run was faster than that in the presence of Na2SO4. Moreover, high vitamin B3 selectivity (52%) was observed after 50% conversion compared to all other PEC experiments. The negative effect of Na2SO4 on the selectivity was already examined above (see Table S2†).
4 Conclusions
In this work, nanotube structured TiO2 on a Ti plate as a photoanode was prepared by an anodic oxidation method in ethylene glycol medium and used for partial photoelectrocatalytic (PEC) oxidation of 3-pyridinemethanol to 3-pyridinemethanal and vitamin B3. The effect of nanotube morphology, applied potential, Na2SO4 concentration, solution stirring speed and pH on the partial oxidation rate and product selectivity was investigated. XRD analysis results show that all of the TiO2 anodes were in the anatase phase with trace amounts of rutile. By increasing the oxidation time for the anode preparation, nanotube length, intensity of XRD peaks and photocurrent increased. The activity results showed that (i) no photocatalytic (PC) reaction occurred under a N2 atmosphere, (ii) PEC reactions in the presence N2 were faster than those in the presence of O2, (iii) 3-pyridinemethanal, a product of the reaction, could be reduced in the presence of both N2 and O2 at the cathode in the PEC reaction, although its oxidation showed to be much more favourable, (iv) activities of electrocatalytic and PC reactions were negligible and low, respectively, whilst those of PEC were high due to a synergistic effect, (v) both low Na2SO4 concentration and applied potential increased the selectivity towards the product, but decreased the PEC activity, (vi) PEC activity and selectivity values increased due to the stirring speed, and (vii) PEC reactions could be performed in the 2–12 pH range, different from the PC ones that did not work under very acidic conditions (pH values lower than 4).In conclusion this work shows that green PEC synthesis of 3-pyridinemethanal and vitamin B3 can be performed at a low applied potential by using efficient nanotube structured TiO2 anodes in oxygenated aqueous solution and in the presence of a very low amount of Na2SO4. Moreover, a future development of this work to obtain a more effective PEC oxidation could be the use of a suitable membrane system to separate the anodic compartment from the cathodic one, thus avoiding a possible further reduction of the products at the cathode surface.
Conflicts of interest
There are no conflicts to declare.Acknowledgements
The authors thank the Scientific and Technological Research Council of Turkey (TÜBİTAK, Project no: 216Z049) for financial support, Prof. Dr. Murat Erdem (Eskişehir Teknik Üniversitesi, Turkey) and Eng. Mehmet Akkaş (ILTEM, Dumlupınar Üniversitesi, Turkey) for the SEM observations and Eng. Hakan Şahin (TUAM, Afyon Kocatepe Üniversitesi, Turkey) for the XRD analyses.References
- R. Chuck, Appl. Catal., A, 2005, 280, 75–82 CrossRef CAS.
- J. D. Stratigos and A. Katsambas, Br. J. Dermatol., 1977, 96, 99–106 CrossRef CAS.
- A. A. Badawy, Alcohol Alcohol., 2014, 49, 238–250 CrossRef CAS.
- R. Altschul, A. Hoffer and J. D. Stephen, Arch. Biochem. Biophys., 1955, 54, 558–559 CrossRef CAS.
- L. A. Carlson, J. Intern. Med., 2005, 258, 94–114 CrossRef CAS PubMed.
- N. Sinthupoom, V. Prachayasittikul, S. Prachayasittikul, S. Ruchirawat and V. Prachayasittikul, Eur. Food Res. Technol., 2014, 240, 1–17 CrossRef.
- D. Spasiano, L. Raspolini, S. Satyro, G. Mancini, F. Pirozzi and R. Marotta, Chem. Eng. J., 2016, 283, 1176–1186 CrossRef CAS.
- A. Martin, C. Janke and V. N. Kalevaru, Appl. Catal., A, 2010, 376, 13–18 CrossRef CAS.
- A. Andersson and S. T. Lundin, J. Catal., 1979, 58, 383–395 CrossRef CAS.
- R. L. Yun, Y. M. Chang, C. H. Lin, K. H. Hu and C. M. Shu, J. Therm. Anal. Calorim., 2006, 85, 107–113 CrossRef CAS.
- E. V. Ovchinnikova, T. V. Andrushkevich and L. A. Shadrina, React. Kinet. Catal. Lett., 2004, 82, 191–197 CrossRef CAS.
- E. V. Ovchinnikova, T. V. Andrushkevich, G. Y. A. Popova, V. D. Meshcheryakov and V. A. Chumachenko, Chem. Eng. J., 2009, 154, 60–68 CrossRef CAS.
- T. Shishido, Z. Song, E. Kadowaki, Y. Wang and K. Takehira, Appl. Catal., A, 2003, 239, 287–296 CrossRef CAS.
- Z. Song, T. Matsushita, T. Shishido and K. Takehira, J. Catal., 2003, 218, 32–41 CrossRef CAS.
- A. R. Katritzky, R. A. Lapucha, R. Murugan and F. J. Luxem, Energy Fuels, 1990, 4, 493–498 CrossRef CAS.
- M. Alfe, D. Spasiano, V. Gargiulo, G. Vitiello, R. Di Capua and R. Marotta, Appl. Catal., A, 2014, 487, 91–99 CrossRef CAS.
- D. Spasiano, R. Marotta, I. Di Somma and G. Mancini, Appl. Catal., B, 2015, 163, 248–257 CrossRef CAS.
- S. Yurdakal, Ş. Ö. Yanar, S. Çetinkaya, O. Alagöz, P. Yalçın and L. Özcan, Appl. Catal., B, 2017, 202, 500–508 CrossRef CAS.
- I. Sirés, E. Brillas, M. A. Oturan, M. A. Rodrigo and M. Panizza, Environ. Sci. Pollut. Res., 2014, 21, 8336–8367 CrossRef.
- S. Garcia-Segura and E. Brillas, J. Photochem. Photobiol., C, 2017, 31, 1–35 CrossRef CAS.
- V. Augugliaro, G. Camera-Roda, V. Loddo, G. Palmisano, L. Palmisano, J. Soria and S. Yurdakal, J. Phys. Chem. Lett., 2015, 6, 1968–1981 CrossRef CAS.
- K. Rajeshwar, J. Appl. Electrochem., 1995, 25, 1067–1082 CrossRef CAS.
- G. Palmisano, V. Loddo, H. H. El Nazer, S. Yurdakal, V. Augugliaro, R. Ciriminna and M. Pagliaro, Chem. Eng. J., 2009, 155, 339–346 CrossRef CAS.
- D. Liu, T. Yang, J. Chen, K. C. Chou and X. Hou, Materials, 2017, 10, 955 CrossRef.
- L. Özcan, S. Yurdakal, V. Augugliaro, V. Loddo, S. Palmas, G. Palmisano and L. Palmisano, Appl. Catal., B, 2013, 132, 535–542 CrossRef.
- C. He, X. Z. Li, N. Graham and Y. Wang, Appl. Catal., A, 2006, 305, 54–63 CrossRef CAS.
- L.-C. Chen, Y.-C. Ho, W.-S. Guo, C.-M. Huang and T.-C. Pan, Electrochim. Acta, 2009, 54, 3884–3891 CrossRef CAS.
- R. B. Domínguez-Espíndola, C. Bruguera-Casamada, S. Silva-Martínez, R. M. Araujo, E. Brillas and I. Sirés, Sep. Purif. Technol., 2019, 208, 83–91 CrossRef.
- N. Serpone and E. Pelizzetti, Photocatalysis: Fundamentals and applications, Wiley, New York, USA, 1989, ISBN 9780471967545-20160527 Search PubMed.
- A. Fujishima, X. Zhang and D. A. Tryk, Surf. Sci. Rep., 2008, 63, 515–582 CrossRef CAS.
- M. Stylidi, D. I. Kondarides and X. E. Verykios, Appl. Catal., B, 2003, 40, 271–286 CrossRef CAS.
- Y. Jia, L. Ye, X. Kang, H. You, S. Wang and J. Yao, J. Photochem. Photobiol., A, 2016, 328, 225–232 CrossRef CAS.
- S. Kment, F. Riboni, S. Pausova, L. Wang, L. Wang, H. Han, Z. Hubicka, J. Krysa, P. Schmuki and R. Zboril, Chem. Soc. Rev., 2017, 46, 3716–3769 RSC.
- P. Li, J. Zhang, H. Wang, H. Jing, J. Xu, X. Sui, H. Hu and H. Yin, Catal. Sci. Technol., 2014, 4, 1070–1077 RSC.
- S. K. Mohapatra, M. Misra, V. K. Mahajan and K. S. Raja, J. Catal., 2007, 246, 362–369 CrossRef CAS.
- J. Su, P. Geng, X. Li, Q. Zhao, X. Quan and G. Chen, Nanoscale, 2015, 7, 16282–16289 RSC.
- S. Palmas, A. M. Polcaro, J. Rodriguez Ruiz, A. Da Pozzo, M. Mascia and A. Vacca, Int. J. Hydrogen Energy, 2010, 35, 6561–6570 CrossRef CAS.
- E. H. Gwag, S. Y. Moon, I. Mondal and J. Y. Park, Catal. Sci. Technol., 2019, 9, 688–694 RSC.
- D. Zhang, B. Wang, J. Wang, H. Wang, S. Zhang and D. Gu, RSC Adv., 2019, 9, 2784–2791 RSC.
- S. Chai, G. Zhao, P. Li, Y. Lei, Y. N. Zhang and D. Li, J. Phys. Chem. C, 2011, 115, 18261–18269 CrossRef CAS.
- L. Özcan, T. Mutlu and S. Yurdakal, Materials, 2018, 11, 1715 CrossRef PubMed.
- M. Tian, G. Wu, B. Adams, J. Wen and A. Chen, J. Phys. Chem. C, 2008, 112, 825–831 CrossRef CAS.
- D. Gong, C. A. Grimes, O. K. Varghese, W. C. Hu, R. S. Singh, Z. Chen and E. C. Dickey, J. Mater. Res., 2001, 16, 3331–3334 CrossRef CAS.
- J. M. Macak, K. Sirotna and P. Schmuki, Electrochim. Acta, 2005, 50, 3679–3684 CrossRef CAS.
- K. Yasuda and P. Schmuki, Electrochim. Acta, 2007, 52, 4053–4061 CrossRef CAS.
- M. Paulose, H. E. Prakasam, O. K. Varghese, L. Peng, K. C. Popat, G. K. Mor, T. A. Desai and C. A. Grimes, J. Phys. Chem. C, 2007, 111, 14992–14997 CrossRef CAS.
- S. Yoriya and C. A. Grimes, Langmuir, 2010, 26, 417–420 CrossRef CAS.
- M. Bettoni, C. Rol and G. V. Sebastiani, J. Phys. Org. Chem., 2008, 21, 219–224 CrossRef CAS.
- L. Özcan, P. Yalçın, O. Alagöz and S. Yurdakal, Catal. Today, 2017, 281, 205–213 CrossRef.
- D. Liu, J.-C. Liu, W. Cai, J. Ma, H. B. Yang, H. Xiao, J. Li, Y. Xiong, Y. Huang and B. Liu, Nat. Commun., 2019, 1779 CrossRef.
- K. Shankar, G. K. Mor, H. E. Prakasam, S. Yoriya, M. Paulose, O. K. Varghese and C. A. Grimes, Nanotechnology, 2007, 18, 065707 CrossRef.
- S. Yurdakal, V. Augugliaro, V. Loddo, G. Palmisano and L. Palmisano, New J. Chem., 2012, 36, 1762–1768 RSC.
- M. Schiavello, Heterogeneous photocatalysis, Wiley, Chichester, UK, 1997 Search PubMed.
- S. Yurdakal, C. Garlisi, L. Özcan, M. Bellardita and G. Palmisano, Catalyst and photocatalyst characterization techniques: Adsorption isotherms and BET, SEM, FT-IR, UV-Vis and Electrochemical characterization, in Heterogeneous Photocatalysis: Relationships with Heterogeneous Catalysis and Perspectives ed. L. Palmisano and G. Marci, Elsevier, Netherlands, 2019, pp. 87–152 Search PubMed.
- A. Katritzky, C. A. Ramsden and J. Joule, Handbook of Heterocyclic Chemistry, 3rd edn, Elsevier, Amsterdam, 2010 Search PubMed.
Footnote |
| † Electronic supplementary information (ESI) available. See DOI: 10.1039/c9cy01583c |
| This journal is © The Royal Society of Chemistry 2020 |