
Mechanistic insight into the selective catalytic reduction of NO by NH3 over α-Fe2O3 (001): a density functional theory study†
Qilong
Fang
b,
Baozhong
Zhu
*ab,
Yunlan
Sun
 *ab,
Zicheng
Zhu
b,
Minggao
Xu
c and
Tingting
Ge
b
*ab,
Zicheng
Zhu
b,
Minggao
Xu
c and
Tingting
Ge
b
aSchool of Petroleum Engineering, Changzhou University, Changzhou, Jiangsu 213164, China. E-mail: baozhongzhu@163.com; yunlansun@163.com
bSchool of Energy and Environment, Anhui University of Technology, Maanshan, Anhui, China
cCenter for Advanced Combustion and Energy, University of Science and Technology of China, Hefei, Anhui 230026, PR China
First published on 16th November 2018
Abstract
The adsorption properties and the selective catalytic reduction mechanism of NO, NH3 and O2 molecules over the α-Fe2O3 (001) surface were studied by density functional theory. The SCR reaction on the α-Fe2O3 (001) surface mainly followed the Eley–Rideal-type mechanism and three detailed reaction routes were proposed. The reaction of NO and NH3 consists of seven consecutive steps: (1) NH3 adsorption, (2) NH3 oxidation, (3) NH2NO formation, (4) NH2NO oxidation, (5) ONNH rearrangement, (2) ONNH dissociation and (7) H2O formation. –NHNO undergoes rearrangement before it dissociates to form a N2 molecule. NH3 dissociation and H2O generation are the rate-determining steps. NO oxidation has two reaction paths, NO2 generation and –NO3 formation. The reaction of NH3, NO and O2 mainly consists of three consecutive steps: (1) –NO2NH2 formation, (2) –NO2NH formation, and (3) –NO2NH dissociation. The combination of free NH2 and –NO2 forms a –NH2NO2 group, which releases an energy of 288 kJ mol−1 and plays an important role in the overall reaction as it provides energy in the following reactions. The formation and dissociation of H2O determine the SCR deNOx reaction rate and the adsorbed oxygen promotes the SCR deNOx reaction on the α-Fe2O3 (001) surface.
1. Introduction
Nitrogen oxides (NOx) generated during the combustion of fossil fuels are the main sources of air pollution such as acid rain, smog, and photochemical smog. About 95% of NOx emissions in the atmosphere come from automobile exhaust and coal-fired power plants.1,2 At present, most power plants adopt the selective catalytic reduction (SCR) of NOx with NH3 in which a V2O5/TiO2 catalyst is promoted by WO3 or MoO3.3 Although the V2O5/TiO2–WO3 or V2O5/TiO2–MoO3 catalyst has high deNOx efficiency, quite a few problems still exist; for example, they easily oxidize SO2 to SO3 and form N2O at high temperature, and the post-processing of the deactivated catalyst is also a challenge owing to the toxicity of vanadium. Therefore, it is imperative to discover and develop nontoxic and efficient catalysts for the reduction of NOx.Fe-based catalysts have shown good deNOx performance. As early as the 1980s, Bosch and Janssen4 have tested the feasibility of unsupported Fe2O3 and several kinds of iron ore in the catalytic oxidation of NOx. Ramis et al.5 studied the transformation and interaction of NO, NH3, N2H4 and NH2OH on Fe2O3/TiO2 catalysts and found that the lattice structure of Fe2O3 had a great influence on the adsorption mode of molecules and deNOx efficiency. Zhao et al.6 prepared different crystal Fe2O3 catalysts by a co-precipitation method and investigated their deNOx properties at 250–450 °C. The results showed that the crystal shape of Fe2O3 had a marked effect on the deNOx performance and the α-Fe2O3 catalyst had excellent NH3-SCR activity. In recent years, the deNOx performance of Fe2O3-based catalysts has been further enhanced with the improvement of the preparation method. Han et al.7 prepared carbon nanotube-supported Fe2O3 nanoparticles (Fe2O3/CNTs) and found that this catalyst had an excellent deNOx performance owing to its high dispersibility, more powerful reducibility, strong acidity and high chemical adsorption oxygen content. They synthesized Fe2O3/CeO2 nanorods and also obtained higher NO conversion.8 A H3PW12O40·6H2O-modified ring-like Fe2O3 catalyst exhibited not only excellent NH3-SCR activity at 250–500 °C but also outstanding resistance against SO2 and H2O.9 Moreover, the α-Fe2O3 catalyst has higher strength and better heat resistance than the γ-Fe2O3 catalyst. Hence, the α-Fe2O3 catalyst has great potential as an nontoxic SCR deNOx catalyst.
Density functional theory (DFT) has been proved to be a good method to study the SCR of NOx with NH3. Liu et al.10 investigated the facet–activity relationship of Fe2O3/TiO2 nanocatalysts in the NH3-SCR reaction using the DFT method. Maitarad et al.11 confirmed the possibility of using metal–purine catalysts for direct decomposition of N2O by DFT calculations. Yan et al.12 demonstrated that the adsorption behavior of NH3 and NO on the surface of the 0.5 μm MnOx–FeOy nanocage was different from that of other scales by DFT calculations and experimental studies. Esrafili13 studied the reduction of NO molecules on Si-doped boron nitride nanosheets using dispersion-corrected DFT calculations. Many previous studies have been devoted to examining the activity of the Fe2O3 catalyst by experiment and theoretical calculation.14–19 However, the mechanism of NOx removal from flue gas using the Fe2O3 catalyst as a SCR catalyst has been ignored. Although studies of the SCR deNOx mechanism using density functional theory (DFT) have achieved excellent results,20–22 most of them focused on commercial catalysts based on titanium,23–30 and few studies concentrated on the reaction route of nontoxic SCR catalysts, especially Fe-based catalysts. In this paper, DFT was introduced to study the adsorption properties of NO, NH3, and O2 molecules over the α-Fe2O3 catalyst, and then the potential energy surface (PES) of formation and decomposition of complexes was systematically studied to investigate the reaction route and the rate-determining step (RDS) of the SCR of NOx with NH3 for the α-Fe2O3 catalyst.
2. Computational methods
DFT calculations were carried out with the Vienna Ab initio Simulation Package (VASP) version 5.3.31–33 For exchange-correlation functional, the projector augmented wave (PAW) method and the Perdew–Burke–Ernzerhof (PBE)34 functional were used for all calculations. The electron wave function is expanded by a plane wave whose kinetic energy cutoff is 500 eV. The DFT+U method is used to solve the strong electron correlation in atoms of transition metals and their oxide systems.35–37 Hence, in this paper, a value of U = 4.0 eV was used on the d orbital of Fe, which is in excellent agreement with experimental data.38 The atomic force and convergence accuracy of energy values were set as 0.03 eV A−1 and 1 × 10⁻⁴ a.u., respectively. As shown in Fig. 1(a), the crystal structure of α-Fe2O3 has hexagonal close packing with the space group R![[3 with combining macron]](https://www.rsc.org/images/entities/char_0033_0304.gif) c; the lattice parameters are a = b = 5.035 Å, c = 13.74 Å and the distance between adjacent Fe–O atoms is 1.960 Å.39 For the α-Fe2O3 bulk calculations, the energies are converged with (5 × 5 × 3) K points in a Monkhorst–Pack grid. The optimized unit cell parameters (a = b = 5.065 Å, c = 13.843 Å) are within +0.60% and +0.75% error compared with the experimental values, indicating that the calculation is reliable.
c; the lattice parameters are a = b = 5.035 Å, c = 13.74 Å and the distance between adjacent Fe–O atoms is 1.960 Å.39 For the α-Fe2O3 bulk calculations, the energies are converged with (5 × 5 × 3) K points in a Monkhorst–Pack grid. The optimized unit cell parameters (a = b = 5.065 Å, c = 13.843 Å) are within +0.60% and +0.75% error compared with the experimental values, indicating that the calculation is reliable.
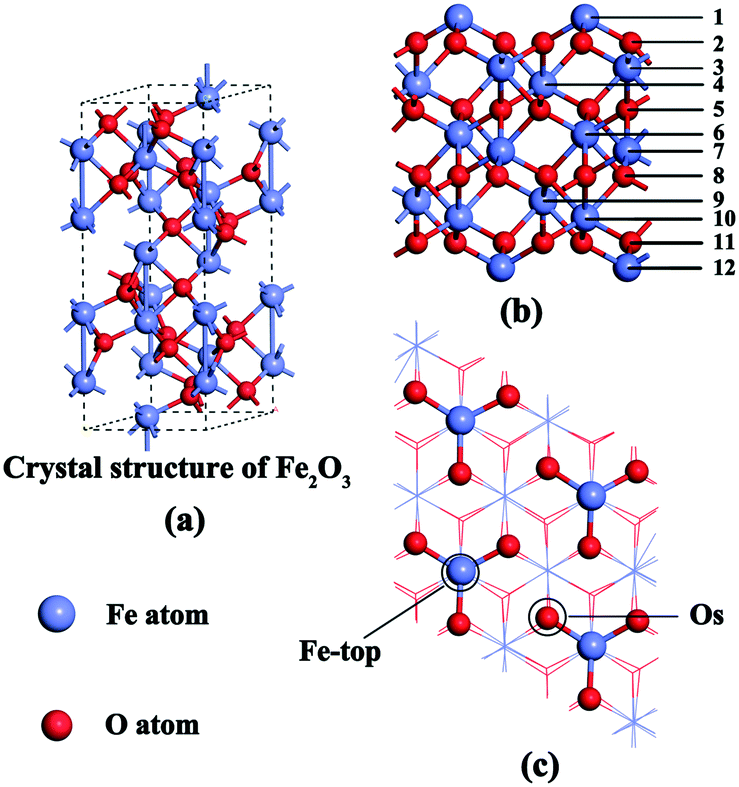 | ||
| Fig. 1 Slab models of the α-Fe2O3 (001) surface. (a) α-Fe2O3 unit cell, (b) side view of the α-Fe2O3 (001) surface, and (c) top view of the α-Fe2O3 (001) surface with two different adsorption sites. | ||
Weiss and Ranke found that the α-Fe2O3 (001) surface is catalytically active.40 Moreover, the Fe–O3–Fe termination of the (001) surface was proved to be the most stable among a series of terminations.39,41,42 Hence, the α-Fe2O3 (001) surface was chosen to calculate the adsorption energies and reactive routes of NH3, NO and O2. A periodic slab with a 2 × 2 surface unit cell was chosen and spin-polarized calculations were used in all DFT computations.
According to the twelve-layer periodic slab model that we used, the top six surface layers and the adsorbed gas molecules were completely relaxed, and the six bottom layers were fixed (Fig. 1b). As shown in Fig. 1c, two different adsorption sites (Fe-top and Os) were distributed on the surface. A 15 Å vacuum gap in the z-direction was introduced to simulate the surfaces. A Monkhorst pack 1 × 1 × 1 mesh was used for the Brillouin zone integration because of the large size of the slab model (10.13 Å × 10.13 Å × 25.12 Å).21 Because adsorption was allowed on only one side of the exposed surfaces, the accordingly corrected dipole moment was introduced in the z–direction.43 The gas molecules (NH3, NO and O2) can be optimized by putting them in a crystal lattice of 10 Å. The total adsorption energy of gas molecules on the α-Fe2O3 (001) surface (Eabs) was calculated using eqn (1):
| Eabs = Egas+α-Fe2O3 (001) surface − (Egas + Eα-Fe2O3 (001) surface) | (1) |
3. Results and discussion
3.1 Adsorption of NH3, NO and O2 on the α-Fe2O3 (001) surface
The gas molecules are placed about 3.5 Å above the α-Fe2O3 (001) surface and then their structures are optimized. The optimized configurations of single molecules adsorbed on the α-Fe2O3 (001) surface are shown in Fig. 2. The gas molecules of NO, O2 and NH3 tend to adsorb on the Fe-top site and are not sensitive to other adsorption sites. Compared with the previous position (3.5 Å), the distance between the gas molecule and the catalyst surface becomes shorter, and the distance between the atoms within the molecule also changes accordingly. The bond lengths of NH3, NO and O2 molecules increase from 1.021 to 1.023 Å, 1.169 to 1.180 Å and 1.23 to 1.266 Å, respectively. The change of bond length of NH3 is small, demonstrating that the N–H bond is difficult to activate, while the change of O–O bond length is large, indicating that the O2 molecule is activated and participates in the reaction. To further understand the bond characteristics and charge transfer of NO, O2 and NH3 on the α-Fe2O3 (001) surface, the adsorption energy, Bader charge change and projected density of states (PDOS) of the single-molecule adsorption were calculated. The results are shown in Table 1 and Fig. 3.
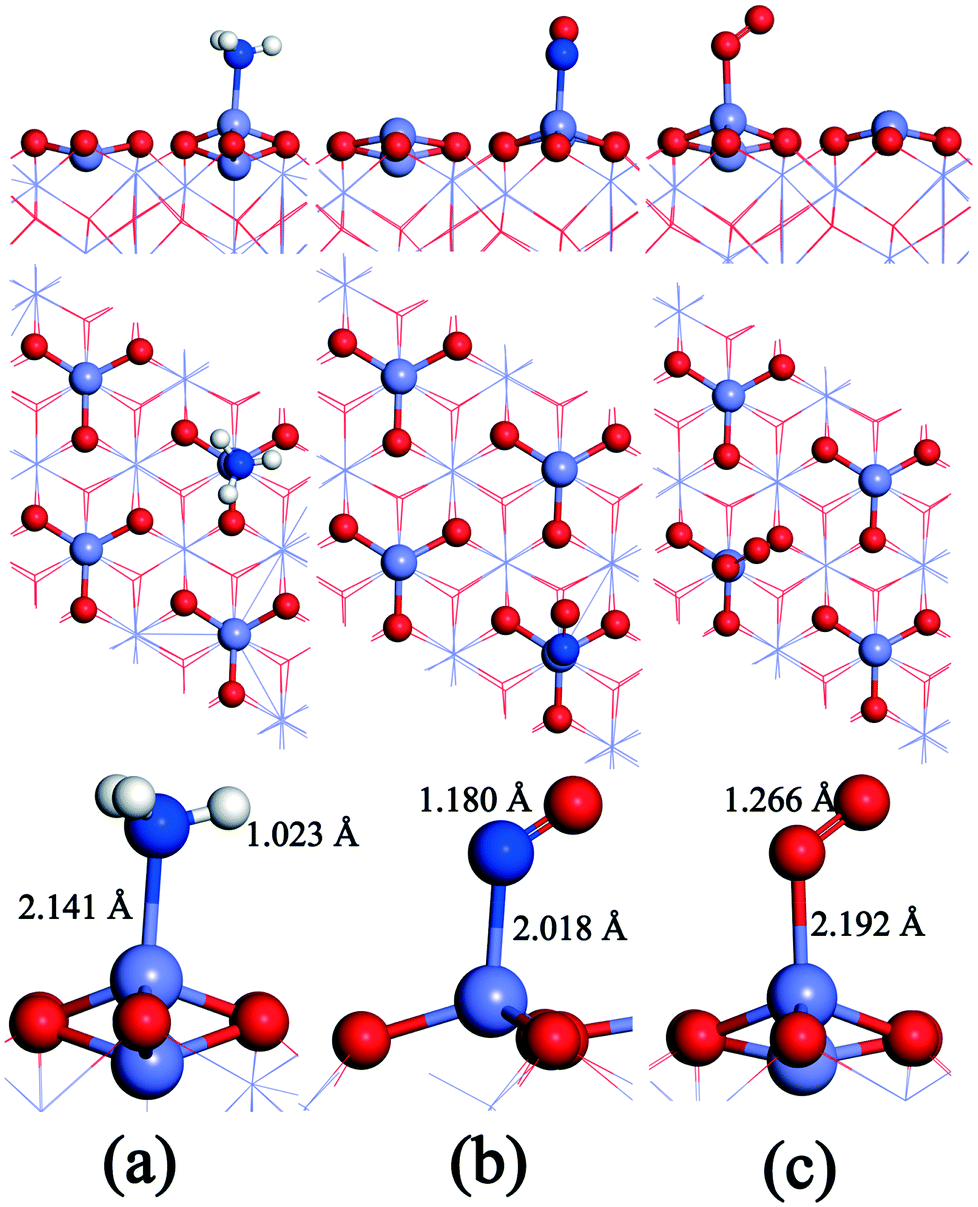 | ||
| Fig. 2 Configurations of the single molecule adsorbed on the α-Fe2O3 (001) surface: (a) NH3, (b) NO, and (c) O2. O: red, Mn: gray, H: white, and N: blue. | ||
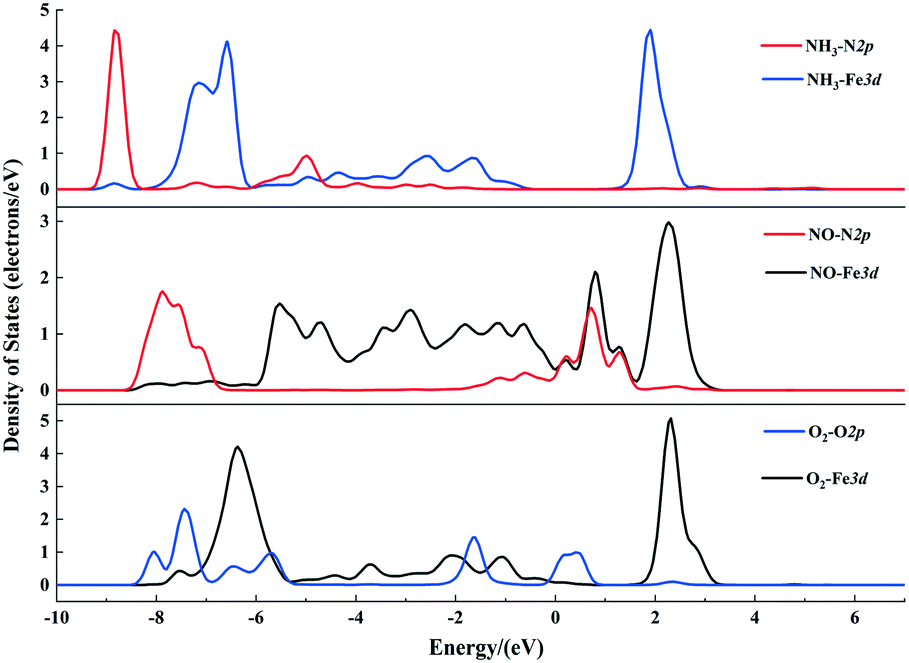 | ||
| Fig. 3 Projected density of states (PDOS) of NH3, NO and O2 molecules adsorbed on the α-Fe2O3 (001) surface. | ||
As can be seen from Table 1, the adsorption energies of NH3, NO and O2 are −115, −104, and −123 kJ mol−1, respectively, indicating that all of them are chemical adsorption energies. The amount of charge transfer of the three gas molecules can be obtained according to the Bader charges of NO, NH3, and O2 molecules. For the NH3 molecule, the total charge increases after adsorption and the electrons in the N atoms transfer to Fe and H atoms, indicating that the bond between N and Fe is strengthened. Charge variation of the NO molecule shows that electrons transfer from Fe to N atoms and some of the electrons transfer from N to O atoms after adsorption, which leads to a strengthening of the N–O bond, implying that the adsorbed NO molecule is not conducive to the activation of the next step. The charges of the 1O and 2O atoms increase, while the increase in charge of the O2 molecule is obviously different from the decrease in charge of the Fe atom, suggesting that the increased charges come from the other atoms of the catalyst. PDOS shows that the density peaks for p orbitals of the N atom and d orbitals of the Fe atom of the α-Fe2O3 (001) surface are in resonance (shown in Fig. 3), indicating that orbital hybridization occurs between N and Fe atoms after NH3 adsorption. As for the NO and O2 molecules, some peaks of p orbitals of the N atom (NO) as well as the O atom (O2) and d orbitals of the Fe atom overlap due to orbital hybridization. From these results, it can be concluded that NO, O2 and NH3 molecules adsorb on the Fe-top site with strong chemical adsorption.
 | ||
| Fig. 4 Configurations of double molecules adsorbed on the α-Fe2O3 (001) surface. O: red, Mn: gray, H: white, and N: blue. | ||
3.2 Reaction mechanism of NH3-SCR
Although the basic reaction mechanisms of NH3-SCR of NO have been studied,21,46–49 different catalysts have different reaction mechanisms, especially for the α-Fe2O3 catalyst, for which the deNOx mechanism is still unclear. Our proposed reaction mechanism for NH3-SCR of NO over α-Fe2O3 (001) comprises three elementary schemes: Scheme 1, reaction of NO and NH3; Scheme 2, NO oxidation; and Scheme 3, reaction of NH3, NO and O2.Scheme 1 Reaction of NO and NH3
NH3 adsorption → NH3 oxidation → NH2NO formation → NH2NO oxidation → ONNH rearrangement → ONNH dissociation → H2O formation
Scheme 2 NO oxidation
Path 1: NO2 generation and adsorption
Path 2: –NO3 formation
Scheme 3 Reaction of NH3, NO and O2
–NO2NH2 formation → –NO2NH formation → –NO2NH dissociation.
 of 85 kJ mol−1, and the energy of the final state in this reaction is higher than that of the initial state of 46 kJ mol−1, suggesting that the first step in NH3 dehydrogenation needs to consume more energy, which is consistent with the above adsorption performance analyses. Moreover, Li et al.,50 Liu et al.51 and Zhang et al.52 detected –NH2 species by in situ DRIFTs experiments. NH2 dissociation into NH and the formation of the second hydroxyl were further studied. The high barrier energy calculated for the endothermic step causes the difficulty of N–H bond dissociation, indicating that further dissociation of NH2 cannot take place. Song et al.21 studied the deNOx mechanism of the MnCe1−xO2 (111) surface and also found that the dissociation of NH2 is highly improbable.
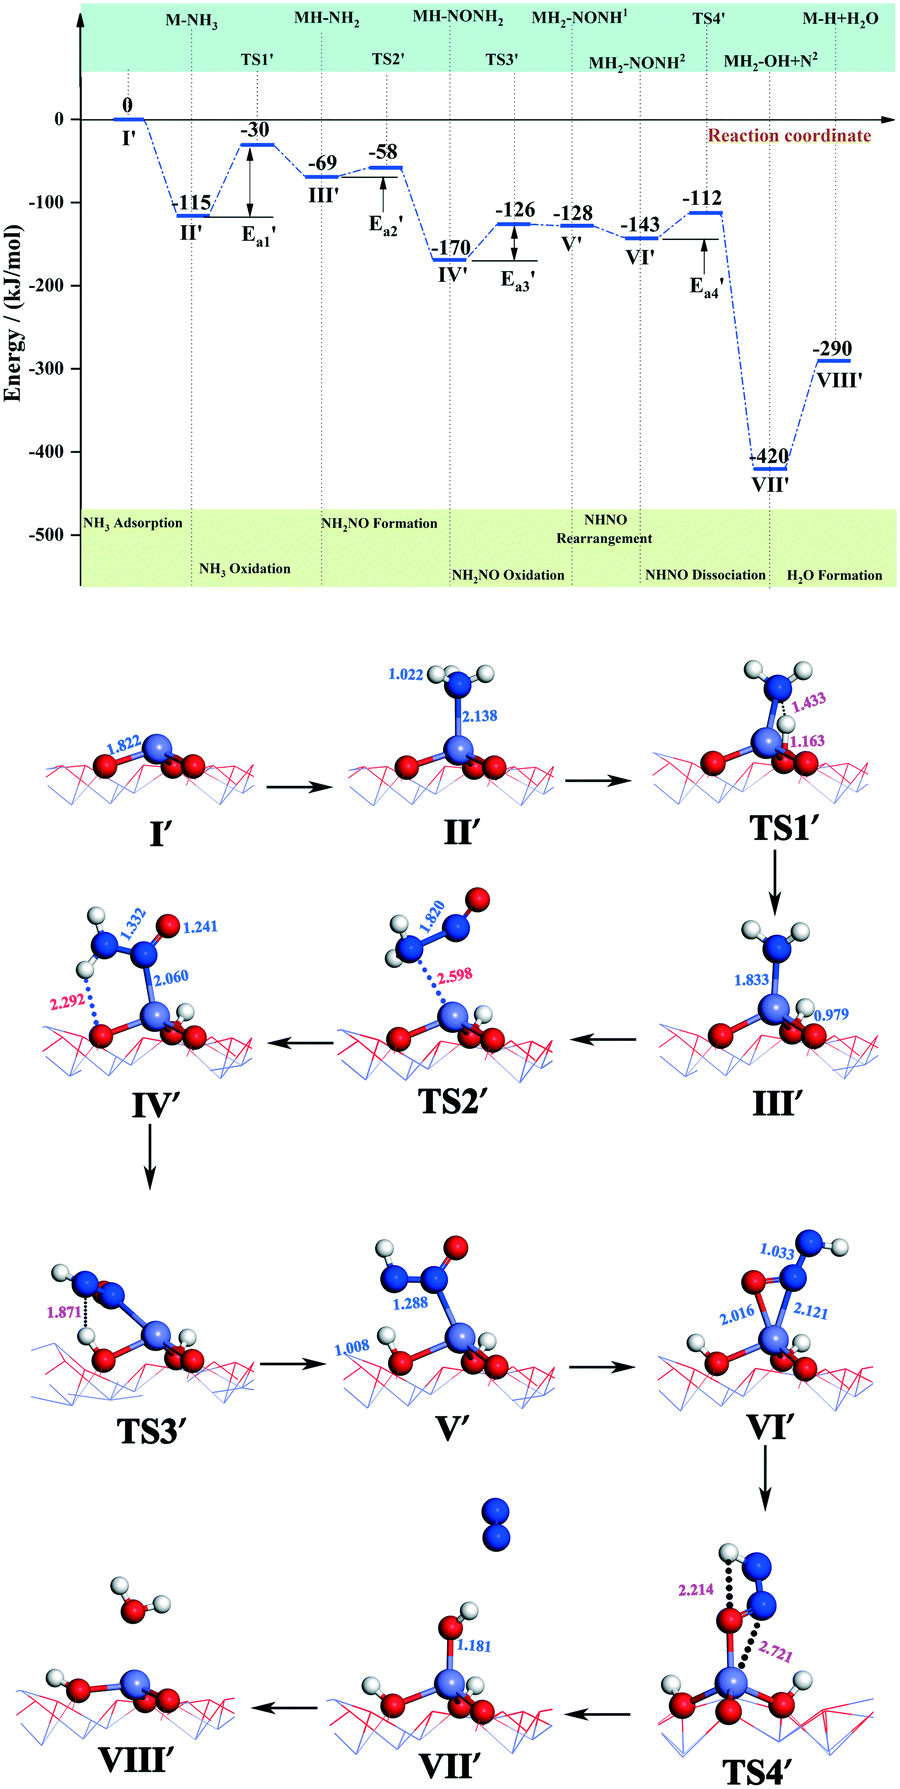 | ||
| Fig. 5 Energy and configuration profiles for the reaction route in Scheme 1. O: red, Mn: gray, H: white, and N: blue. | ||
During the NH3-SCR of NO, the Fe–N bond of FeH–NH2 is broken and the intermediate interacts with a gaseous NO molecule to form the key intermediate, FeH–NH2NO (state IV′). In this step, the Fe–N bond breakage has an activation energy  of 11 kJ mol−1, implying that the formation of this intermediate was relatively undemanding. In the transition state TS2′, the distances between N in NH2 species and Fe and N of NO were 2.598 and 1.820 Å, respectively. NO adsorbs on FeH–NH2 and a new N–N bond forms in the H2N–NO intermediate with an N–N bond distance of 1.332 Å. In addition, it can be found by observing the geometric shape of the configuration that the structure of –NONH2 is a planar structure, that is, the five atoms are on the same plane, and this reaction releases 101 kJ mol−1 of energy with a minuscule energy barrier, indicating that the reaction easily occurs. In the transition state TS3′, a hydrogen atom from the adsorbed NH2NO approaches an oxygen atom to a distance of 1.871 Å. In the final product of the second dehydrogenation, one H atom of NH2NO dissociates and binds to the O atom on the surface to form the second hydroxyl species, and the Fe–ONNH1 adduct has a N–N bond distance of 1.288 Å (state V′). The NH2NO oxidation has an activation energy
  of 44 kJ mol−1. We carried out rotation change and structural optimization on the –ONNH1 structure because of its poor stability and found that the energy of structure VI′ is the lowest, −143 kJ mol−1. In the NHNO rearrangement, there is no energy barrier for the change from structural V′ to ONNH2 and the reaction is exothermic (ΔE = 15 kJ mol−1). In a previous study, the NH2NO intermediate rearranged to NHNOH before its decomposition has been found.53 However, the NHNO rearrangement is absent. In the transition state TS4′, a hydrogen atom from the adsorbed ONNH2 approaches an oxygen atom to a distance of 2.214 Å. In the final product of –ONNH2 decomposition to N2, H and O atoms connect to generate OH after –NONH (state V′) rotated and N2 formed (state VII′). N2 molecule generation and the subsequent desorption reaction energy barrier is smaller, which is 29 kJ mol−1
 . The formation of N2 is an exothermic process, which releases a large amount of energy (ΔE = 277 kJ mol−1), suggesting that the reaction is a relatively stable process and the product is not easily converted back to the reactants.
In the following step, the bonds between H atoms and lattice oxygen on the surface of α-Fe2O3 (001) are broken and H bonds with –OH groups to form –H2O species after N2 desorption (state VIII′). This step is an endothermic reaction (ΔE = 130 kJ mol−1). A large amount of energy generated by N2 generation and dissociation can provide the energy to activate O–H bonds and generate H2O. According to the path and the energy variation of the reaction of NH3 with NO, it can be found that the active energy of NH3 dissociation and the required energy of H2O formation are relatively high; hence the two reactions are the rate-determining step (RDS) for the reaction of NH3 with NO (Scheme 1).
 | ||
| Fig. 6 Energy and configuration profiles for the reaction route in Scheme 2. O: red, Mn: gray and N: blue. | ||
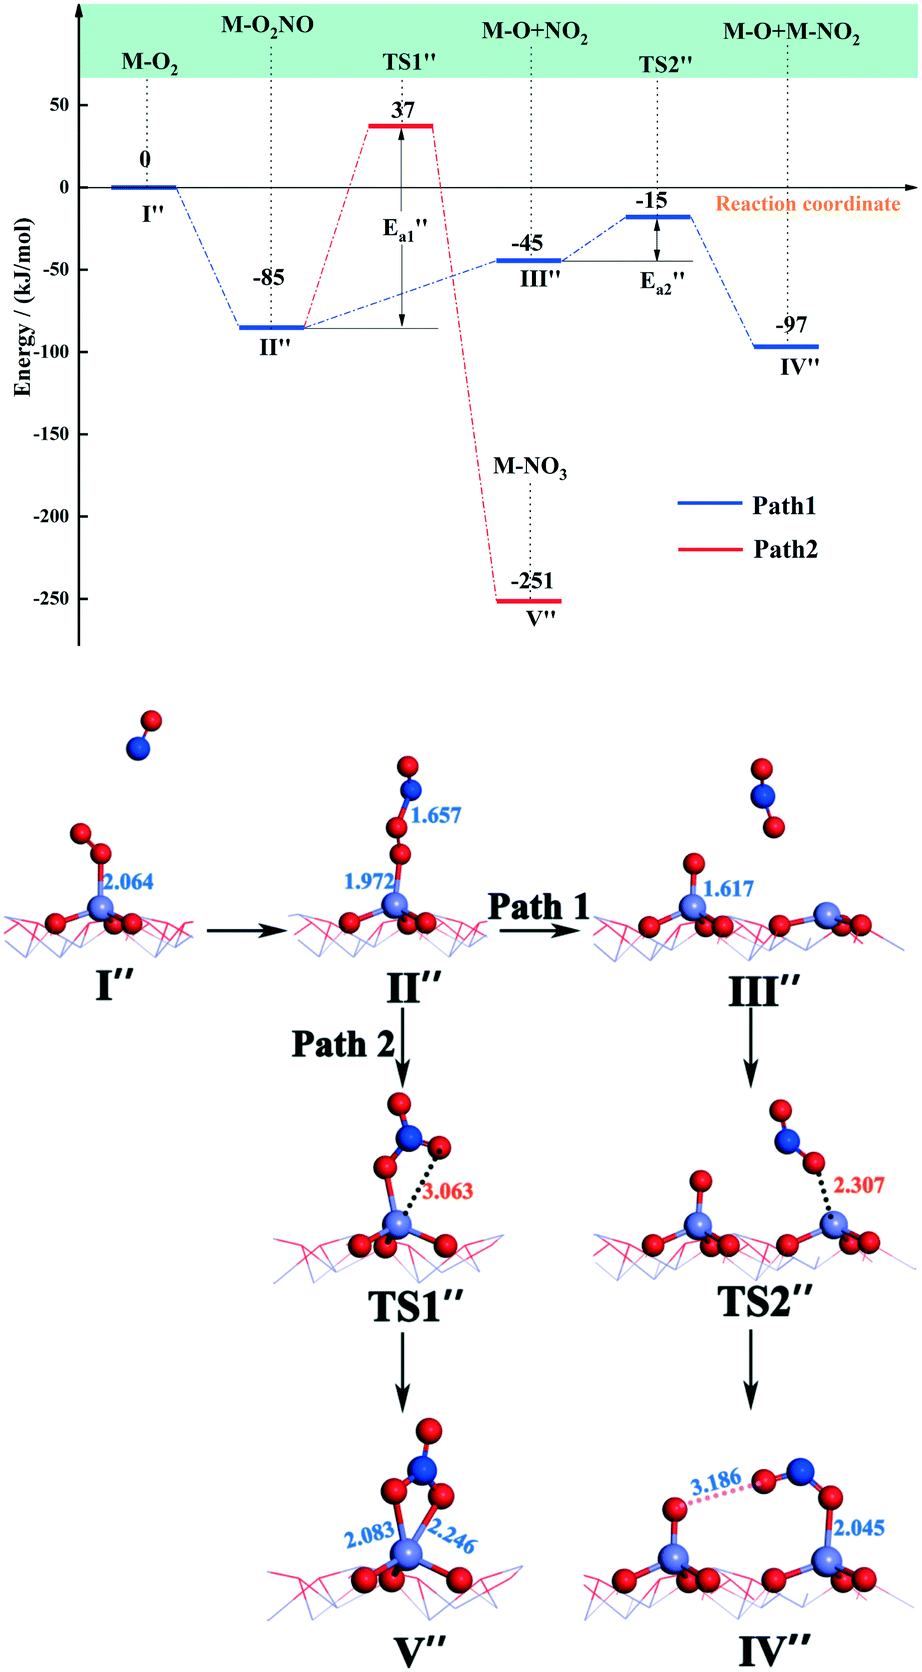
The N atom of the NO molecule can naturally bind to the top O atom on Fe–O2 to form Fe–O2NO, with Fe–N and O–N bond lengths of 1.972 and 1.657 Å, respectively (state II′′). The released energy of the NO molecule adsorbing on Fe–O2 is 85 kJ mol−1, suggesting that this step is a facile reaction. In the following step, the long strip structure of Fe–O2NO may be dissociated to produce a NO2 molecule (path 1) or may be transformed to Fe–NO3 (path 2). The Fe–NO3 configuration, known as bidentate coordination nitrate, is one of the nitrogen oxides that is difficult to eliminate in nitrates. Although it has been detected during the experiment,56 it was not found in a previous theoretical study. It can be seen from path 1 in Fig. 6 that the Fe–O2NO group absorbs energy (ΔE = 45 kJ mol−1) and the O–O bond breaks to form the NO2 molecule. In the following step, the NO2 molecule adsorbs at an adjacent Fe-top site to form a half-bridge nitrite (state IV′′), which has an energy barrier of 30 kJ mol−1 and is associated with energy release (ΔE = 52 kJ mol−1). In the transition state TS2′′, an oxygen atom from the NO2 molecule approaches an adjacent iron atom to a distance of 2.307 Å.
For path 2, the transformation from Fe–O2NO (state II′′) to Fe–NO3 (state V′′) had an energy barrier of 122 kJ mol−1 and released a large amount of heat (ΔE = 166 kJ mol−1). From the comparison of the energy of structure II′′ and that of structure V′′, it can be found that Fe–NO3 is more stable. As to the transition state TS1′′, the O–O bond breaks and an O atom approaches the Fe atom to a distance of 3.063 Å. Arnarson et al.57 proposed a complete reaction mechanism for standard and fast NH3-SCR on the low coverage VOx/TiO2 (001) surface and found that the energy barrier of NO reacting with adsorbed O2 to form NO2 was about −123 kJ mol, indicating that the generation of NO2 requires relatively more energy compared to that of the α-Fe2O3 (001) surface. This may be due to the different adsorption behaviors of the O2 molecule. According to the reaction paths and the energy changes of NO and O2, it can be seen that the reaction of NO with O2 to form NO2 is easier than the formation of Fe–NO3. Zhang et al.58 studied the adsorption of related small gases for the NH3-SCR reaction on the Mn-MOF-74 surface and also found NO2 formation via NO oxidation with little barrier. In addition, bidentate ligand nitrates have good stability and can cover the catalyst surface in the SCR deNOx reaction and decrease the efficiency of NOx removal, so it is important to note that the formation of bidentate ligand nitrates should be avoided to the utmost extent in the SCR deNOx reaction. In the NO oxidation reaction (Scheme 2), the O2 molecule is adsorbed vertically on the catalyst surface before Fe–O2NO formation. However, in our recent theoretical study of β-MnO2,37 the O2 molecule was adsorbed horizontally on the β-MnO2 surface and then bidentate ligand nitrates were directly generated when NO was added, so we speculate that the adsorption patterns of the O2 molecule will have, to a certain extent, an influence on the formation of bidentate ligand nitrates. Li et al.50 studied the adsorption of NO + O2 on Fe2O3 using in situ DRIFTs and found the bands of linear nitrites, monodentate nitrite and nitro compound, which was consistent with our DFT calculations.
 ) = 9 kJ mol−1) in the transformation from structure IV′′′ to structure V′′′, indicating that this reaction is relatively likely to occur. In the transition state TS2′′′, a H atom from the –NHNO2 approaches an oxygen atom to a distance of 1.738 Å, and at the end of this step (state VI′′′), the N–O bond breaks and the N2O dissociates out. As for the active energy, this reaction involves the fracture of two bonds, resulting in a higher reaction energy barrier (ΔE = 65 kJ mol−1), and the energy of the final state is lower (91 kJ mol−1) than that of the initial state. The desorption energy of N2O in structure VI′′′ is relatively small, so its desorption from the system is easy and this mechanism tends to produce N2O. However, the situation can be different from that of other catalytic systems. For example, N2O formation over the V2O5/AC catalyst during SCR of NO by NH3 is generally low.60 As the reaction progresses, the adsorbed H2O on the surface of the catalyst dissociates out to form a molecule with energy adsorption (ΔE = 91 kJ mol−1).
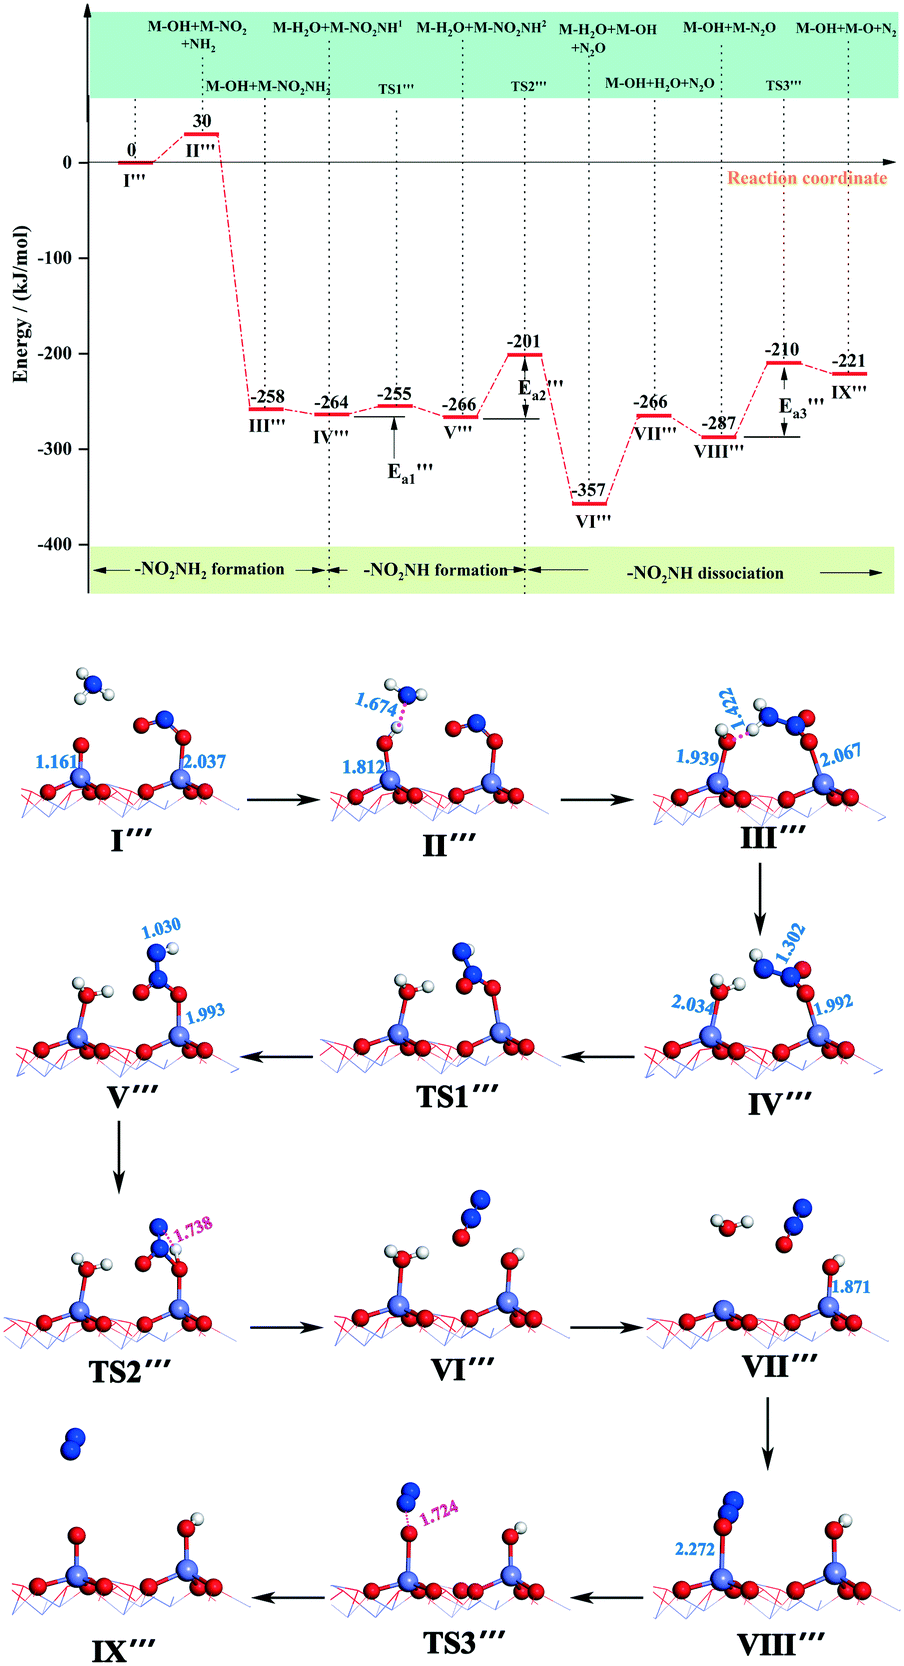 | ||
| Fig. 7 Energy and configuration profiles for the reaction route in Scheme 3. O: red, Mn: gray, H: white, and N: blue. | ||
The N2O molecule is one of the products of the SCR deNOx reaction, which can be released into the atmosphere along with the flue gas or be adsorbed on the catalyst surface for further reaction.61,62 Hence, we calculated the adsorption energy of N2O adsorbed on the Fe-top site of the α-Fe2O3 (001) surface and the energy required for N2O decomposition to produce N2. It can be seen from Fig. 7 that the adsorption energy of the N2O molecule is −21 kJ mol−1, followed by the absorption energy of 66 kJ mol−1 to generate an N2 molecule (state IX′′′). The activation energy required to break the O–NN bond was 77 kJ mol−1. In the transition state TS3′′′, the distance between N and O was 1.724 Å. By comparison, the adsorption energy of H2O is much higher than that of N2O; thus N2O is unable to compete with H2O for adsorption at that site. On the basis of CI-NEB results of Scheme 3, we found that N2 and H2O molecular dissociation requires a lot of energy, so the rates of both reactions have a great influence on the whole reaction rate, that is to say, the generation of N2 and H2O molecules is the RDS of the whole reaction (Scheme 3). The remaining adsorbed O atom can further oxidize NO or combine with the H atoms dissociated from NH3 to form H2O, and hydroxyl can also be combined with H atoms to generate H2O, which can promote the SCR deNOx reaction. When NH2 and –NO2 combine to form the –NH2NO2 group, a large amount of energy released can make up for the energy demand of N2O, N2 and H2O generation and dissociation. In this study, we only calculated the reaction route of NH2 with NO2(ad) to form H2O and N2O. There are other pathways. For instance, NO2(ad) reacts with OH(ad) to form HNO2(ad), and then HNO2(ad) reacts with NH3(g) to form two H2O molecules and N2.63 However, we cannot completely rule out the possibility of other reactions on the surface of α-Fe2O3 (001), which requires further study in the future.
4. Conclusions
The adsorption properties and reaction mechanism of NH3-SCR of NO over α-Fe2O3 (001) were explored by DFT calculations. NH3, NO and O2 molecules tend to adsorb on the Fe-top site, and the reaction mechanism of NH3-SCR of NO on the α-Fe2O3 (001) surface mainly follows the E–R mechanism. Three elementary reaction schemes were proposed. Scheme 1 is an energetically favourable process, which comprises seven consecutive elementary steps as follows. NH3 molecule dissociation had an activation barrier of 85 kJ mol−1, and then –NH2 species interacts with gaseous NO molecule to form FeH–NH2NO. One H atom of –NH2NO group dissociates and binds to the O atom on the α-Fe2O3 (001) surface to form the second hydroxyl species, and the activation barrier for NH2NO oxidation is 44 kJ mol−1. Then, –NHNO is rearranged with little energy released. The formation of N2 releases a large amount of energy. Finally, a H2O molecule forms and desorbs through recombination of the hydroxyl group and a H atom. The NH3 dissociation and H2O generation are the rate-determining step for the reaction of NH3 with NO (Scheme 1).NO oxidation (Scheme 2) included two reaction paths. A NO molecule facilely combines with adsorbed O2. In the following step, Fe–O2NO may be dissociated to produce a NO2 molecule (path 1), or may be transformed to Fe–NO3 (path 2). The Fe–O2NO group absorbs energy to form a NO2 molecule, and the NO2 molecule may adsorb on the α-Fe2O3 (001) surface to form a half-bridge nitrite, which has an energy barrier of 30 kJ mol−1. For path 2, the transformation from Fe–O2NO to Fe–NO3 has an energy barrier of 122 kJ mol−1. The reaction of NO and O2 to form a NO2 molecule is easier than that of Fe–NO3.
For the reaction of NH3, NO and O2 (Scheme 3), the combination of free NH2 and –NO2 to form a –NH2NO2 group releases a large amount of energy. Dissociation of a H atom and rearrangement of –NHNO21 take place. Then, –NHNO2 dissociates to form N2O, which has an energy barrier of 65 kJ mol−1. The adsorbed H2O on the surface of the catalyst dissociates out to form a H2O molecule with energy adsorption. The N2O molecule is dissociated to form a N2 molecule and an adsorbed O atom. The generation of N2 and H2O molecules is the rate-determining step of the reaction (Scheme 3). In addition, the promoting effect of the superficial adsorbed oxygen in the SCR deNOx reaction was well illustrated.
Conflicts of interest
There are no conflicts to declare.Acknowledgements
We greatly appreciate the financial support provided by the National Natural Science Foundation of China (No. 51676001 and 51376007), the Anhui Provincial Natural Science Foundation (No. 1608085ME104), the Key Projects of Anhui Province University Outstanding Youth Talent (No. gxyqZD2016074 and gxyqZD2017038), and the Funding Projects of Back-up Candidates (No. 2017H131).References
- P. H. Abelson, Science, 1985, 230, 617 CrossRef CAS PubMed.
- K. Taylor, Catal. Rev.: Sci. Eng., 1994, 35, 457–481 CrossRef.
- P. Granger and V. I. Parvulescu, Chem. Rev., 2011, 111, 3155–3207 CrossRef CAS PubMed.
- H. Bosch and F. Janssen, ChemInform, 1988, 19, 369–532 Search PubMed.
- M. A. Larrubia, G. Ramis and G. Busca, Appl. Catal., B, 2001, 30, 101–110 CrossRef CAS.
- Z. L. Zhao, J. W. Li and B. H. Chen, Xiandai Huagong, 2006, 26, 143–146 CAS.
- J. Han, D. S. Zhang, P. Maitarad, L. Y. Shi, S. X. Cai, H. R. Li, L. Huang and J. P. Zhang, Catal. Sci. Technol., 2015, 5, 438–446 RSC.
- J. Han, J. Meeprasert, P. Maitarad, S. Namuangruk, L. Y. Shi and D. S. Zhang, J. Phys. Chem. C, 2016, 120, 1523–1533 CrossRef CAS.
- Z. Y. Ren, H. Fan and R. Wang, Catal. Commun., 2017, 100, 71–75 CrossRef CAS.
- J. Liu, J. Meeprasert, S. Namuangruk, K. W. Zha, H. R. Li, L. Huang, P. Maitarad, L. Y. Shi and D. S. Zhang, J. Phys. Chem. C, 2017, 121, 4970–4979 CrossRef CAS.
- P. Maitarad, S. Namuangruk, D. S. Zhang, L. Y. Shi, H. R. Li, L. Huang, B. Boekfa and M. Ehara, Environ. Sci. Technol., 2014, 48, 7101–7110 CrossRef CAS PubMed.
- L. J. Yan, Y. Y. Liu, K. W. Zha, H. R. Liu, L. Y. Shi and D. S. Zhang, ACS Appl. Mater. Interfaces, 2017, 9, 2581–2593 CrossRef CAS PubMed.
- M. D. Esrafili, Chem. Phys. Lett., 2018, 695, 131–137 CrossRef CAS.
- H. B. Liu, Z. X. Zhang, Q. Li, T. H. Chen, C. G. Zhang, D. Chen, C. Z. Zhu and Y. Jiang, Aerosol Air Qual. Res., 2017, 17, 1798–1808 CrossRef.
- X. L. Mou, B. S. Zhang, Y. Li, L. D. Yao, X. J. Wei, D. S. Su and W. J. Shen, Angew. Chem., Int. Ed., 2012, 51, 2989–2993 CrossRef CAS PubMed.
- S. J. Yang, H. Z. Chang, L. Ma, Z. Qu, N. Q. Yan, C. Z. Wang and J. H. Li, Ind. Eng. Chem. Res., 2013, 52, 5601–5610 CrossRef CAS.
- K. L. Howard and D. J. Willock, Faraday Discuss., 2011, 152, 135–151 RSC.
- Y. Li, Y. Wan, Y. P. Li, S. H. Zhan, Q. X. Guan and Y. Tian, ACS Appl. Mater. Interfaces, 2016, 8, 5224–5233 CrossRef CAS PubMed.
- S. X. Cai, H. Hu, H. R. Li, L. Y. Shi and D. S. Zhang, Nanoscale, 2016, 8, 3588–3598 RSC.
- Z. F. Yan, S. Shi, Z. Li, Z. J. Zuo, S. Li and X. G. Chen, Catal. Lett., 2017, 147, 1006–1018 CrossRef CAS.
- W. Y. Song, J. Liu, H. L. Zheng, S. C. Ma, Y. C. Wei, A. J. Duan, G. Y. Jiang, Z. Zhao and E. J. M. Hensen, Catal. Sci. Technol., 2016, 6, 2120–2128 RSC.
- P. Maitarad, J. Meeprasert, L. Y. Shi, J. Limtrakul, D. S. Zhang and S. Namuangruk, Catal. Sci. Technol., 2016, 6, 3878–3885 RSC.
- A. S. Negreira and J. Wilcox, J. Phys. Chem. C, 2016, 117, 24397–24406 CrossRef.
- L. Arnarson, H. Falsig, S. B. Rasmussen, J. V. Lauritsen and P. G. Moses, J. Catal., 2017, 346, 188–197 CrossRef CAS.
- R. Wanbayor and V. Ruangpornvisuti, Mater. Chem. Phys., 2010, 124, 720–725 CrossRef CAS.
- M. Takagi, T. Kawai, M. Soma, T. Onishi and K. Tamaru, J. Catal., 1977, 50, 441–446 CrossRef CAS.
- M. Inomata, A. Miyamoto and Y. Murakami, J. Catal., 1980, 62, 140–148 CrossRef CAS.
- F. J. J. G. Janssen, F. M. G. Van den Kerkhof, H. Bosch and J. R. H. Ross, J. Phys. Chem., 1987, 91, 5921–5927 CrossRef CAS.
- G. Ramis, G. Busca, V. Lorenzelli and P. Forzatti, Appl. Catal., 1990, 64, 243–257 CrossRef CAS.
- G. T. Went, L. Leu and A. T. Bell, J. Catal., 1992, 134, 479–491 CrossRef CAS.
- G. Kresse and J. Furthmüller, Comput. Mater. Sci., 1996, 6, 15–50 CrossRef CAS.
- W. Dong, G. Kresse, J. Furthmüller and J. Hafner, Phys. Rev. B: Condens. Matter Mater. Phys., 2005, 54, 2157–2166 CrossRef.
- A. Rohrbach, J. Hafner and G. Kresse, J. Phys.: Condens. Matter, 2003, 15, 979–996 CrossRef CAS.
- J. P. Perdew, K. Burke and M. Ernzerhof, Phys. Rev. Lett., 1996, 77, 3865–3868 CrossRef CAS PubMed.
- S. L. Dudarev, G. A. Botton, S. Y. Savrasov, C. J. Humphreys and A. P. Sutton, Phys. Rev. B: Condens. Matter Mater. Phys., 1998, 57, 1505–1509 CrossRef CAS.
- O. Bengone, M. Alouani, P. Bloechl and J. Hugel, Phys. Rev. B: Condens. Matter Mater. Phys., 2000, 62, 16392–16401 CrossRef CAS.
- B. Z. Zhu, Q. L. Fang, Y. L. Sun, S. L. Yin, G. B. Li, Z. H. Zi, T. T. Ge, Z. C. Zhu, M. X. Zhang and J. X. Li, J. Mater. Sci., 2018, 53, 11500–11511 CrossRef CAS.
- A. Rohrbach, J. Hafner and G. Kresse, Phys. Rev. B: Condens. Matter Mater. Phys., 2004, 70, 125426.1–125426.17 CrossRef.
- L. W. Finger and R. M. Hazen, J. Appl. Phys., 1980, 51, 5362–5367 CrossRef CAS.
- W. Weiss and W. Ranke, Prog. Surf. Sci., 2002, 70, 1–151 CrossRef CAS.
- W. Weiss, S. K. Shaikhutdinov, M. Ritter, M. Petersen, F. Wagner, R. Schlögl, M. Scheffler and X. G. Wang, Phys. Rev. Lett., 1998, 81, 1038–1041 CrossRef.
- R. B. Wang and A. Hellman, J. Chem. Phys., 2018, 148, 094705 CrossRef.
- L. Bengtsson, Phys. Rev. B: Condens. Matter Mater. Phys., 1999, 59, 12301–12304 CrossRef CAS.
- G. Henkelman, B. Uberuaga and H. Jonsson, J. Chem. Phys., 2000, 113, 9901–9904 CrossRef CAS.
- C. X. Liu, S. J. Yang, L. Ma, Y. Peng, A. Hamidreza, H. Z. Chang and J. H. Li, Catal. Lett., 2013, 143, 697–704 CrossRef CAS.
- G. Marbán, T. Valdés-SolíS and A. B. Fuertes, Phys. Chem. Chem. Phys., 2004, 226, 138–155 Search PubMed.
- G. Qi, R. T. Yang and R. Chang, Appl. Catal., B, 2004, 51, 93–106 CrossRef CAS.
- R. M. Yuan, G. Fu, X. Xu and H. L. Wan, J. Phys. Chem. C, 2014, 115, 21218–21229 CrossRef.
- A. Vittadini, M. Casarin and A. Selloni, ChemInform, 2005, 36, 1652–1655 CrossRef.
- Y. Li, Y. Wan, Y. P. Li, S. H. Zhan, Q. X. Guan and Y. Tian, ACS Appl. Mater. Interfaces, 2016, 8, 5224–5233 CrossRef CAS PubMed.
- Z. M. Liu, H. Su, B. H. Chen, J. H. Li and S. I. Woo, Chem. Eng. J., 2016, 299, 255–262 CrossRef CAS.
- Q. L. Zhang, H. M. Wang, P. Ning, Z. X. Song, X. Liu and Y. K. Duan, Appl. Surf. Sci., 2017, 419, 733–743 CrossRef CAS.
- D. H. Sun, W. F. Schneider, J. B. Adams and D. Sengupta, J. Phys. Chem. A, 2015, 108, 9365–9374 CrossRef.
- F. Cao, S. Su, J. Xiang, P. Y. Wang, S. Hu, L. S. Sun and A. C. Zhang, Fuel, 2015, 139, 232–239 CrossRef CAS.
- F. Cao, J. Xiang, S. Su, P. Y. Wang, L. S. Sun, S. Hu and S. Y. Lei, Chem. Eng. J., 2014, 243, 347–354 CrossRef CAS.
- J. Xiang, L. L. Wang, F. Cao, K. Qian, S. Su, S. Hu, Y. Wang and L. J. Liu, Chem. Eng. J., 2016, 302, 570–576 CrossRef CAS.
- L. Arnarson, H. Falsig, S. B. Rasmussen, J. V. Lauritsen and P. G. Moses, J. Catal., 2017, 346, 188–197 CrossRef CAS.
- M. H. Zhang, X. W. Huang and Y. F. Chen, Phys. Chem. Chem. Phys., 2016, 18, 28854–28863 RSC.
- M. Iwasaki and H. Shinjoh, Appl. Catal., A, 2010, 390, 71–77 CrossRef CAS.
- P. Li, Q. Y. Liu and Z. Y. Liu, Ind. Eng. Chem. Res., 2011, 50, 1906–1910 CrossRef CAS.
- Y. Geng, W. P. Shan, S. C. Xiong and F. D. Liu, Catal. Sci. Technol., 2015, 6, 3149–3155 RSC.
- G. Delahay, B. Coq, S. Kieger and B. Neveu, Catal. Today, 1999, 54, 431–438 CrossRef CAS.
- L. K. Zhao, C. T. Li, Y. Wang, H. Y. Wu, L. Gao, J. Zhang and G. M. Zeng, Catal. Sci. Technol., 2016, 6, 6076–6086 RSC.
Footnote |
| † Electronic supplementary information (ESI) available. See DOI: 10.1039/c8cy02080a |
| This journal is © The Royal Society of Chemistry 2019 |