
Fe(CN)5@PIL-derived N-doped porous carbon with FeCxNy active sites as a robust electrocatalyst for the oxygen reduction reaction†
Shao-hua
Zhang‡
,
Yi-jing
Gao‡
,
Shan
Cheng
,
Yi-long
Yan
,
Shi-Jie
Zhang
,
Gui-lin
Zhuang
 *,
Sheng-wei
Deng
,
Zhong-zhe
Wei
,
Xing
Zhong
and
Jian-guo
Wang
*
*,
Sheng-wei
Deng
,
Zhong-zhe
Wei
,
Xing
Zhong
and
Jian-guo
Wang
*
Institute of Industrial Catalysis, State Key Laboratory Breeding Base of Green-Chemical Synthesis Technology, College of Chemical Engineering, Zhejiang University of Technology, Hangzhou 310032, P.R. China. E-mail: glzhuang@zjut.edu.cn; jgw@zjut.edu.cn
First published on 7th November 2018
Abstract
The synthesis and catalytic mechanism of new-type Fe–N co-doping catalysts are important topics for the research on fuel cells. Herein, we report the synthesis and oxygen reduction reaction (ORR) properties of a new Fe–N co-doping carbon composite using poly(ionic liquid)s and ferric salt as precursors. The structural characterizations revealed that the as-prepared material features ordered porous properties with a specific surface area of 719.1 m2 g−1, corresponding to FeCxNy/N-doped porous carbons (FeCxNy/N-PC). The electrochemical measurements indicated they show superior catalytic activity (Tafel slope of 70.8 mV dec−1 and E1/2 of 0.84 V), stability and high methanol tolerance compared to the commercial Pt/C catalyst. Furthermore, density functional theory calculations uncovered that the FeCxNy/N-PC composite catalyzes the ORR according to the four-electron associative mechanism with the free-energy barrier of 0.51 eV in the rate-determining formation of H2O. Interestingly, the electronic structure analysis demonstrated the FeCxNy particles serve as active sites and the synergistic effect of the Fe and N atoms of N-PC can promote the ORR performance.
Introduction
In the latest decade, there has been a surge of research activity regarding proton exchange membrane fuel cells (PEMFC), which have been attracting increasing interests due to their wide application in new-type energy.1–4 However, as one critical factor of fuel cells, the ORR at the cathode involves sluggish kinetics in comparison with six-magnitude velocity of the oxidation reaction at the anode.5,6 This greatly hinders the large-scale application of this technology. Stimulated by these facts, pure or hybrid precious-metal catalysts (PMCs) are regarded as effective solutions;6–16 however, they suffer from high cost, low stability and susceptibility to methanol crossover.17–19 Consequently, it is highly desirable to investigate effective substitute catalysts to overcome these disadvantages. Recently, much effort has been devoted to the exploitation of high-performance non-precious-metal catalysts (NPMCs), such as single-doped or multivariant-doped carbons.3,20–30Accordingly, iron–nitrogen co-doped carbon composites, featuring high-performance for the ORR, have attracted significant attention.31–42 Experimental results have shown that the ORR activity of Fe–N/C catalysts results extensively from the enhancing effect of the Fe–Nx active sites embedded in the graphitized carbon matrix.31,33,43–48 From a theoretical viewpoint, it is found that the geometrical structure (such as coordination number and configuration) and electronic structure (such as odd-electron pyridine N) of Fe–Nx can manipulate the chemical environment of the Fe active site to further alter the binging interaction between the reaction species and catalyst, resulting in the high ORR performance of these catalysts.49–52 Consequently, a variety of synthetic methods consisting of high temperature calcination using a mixture of ferric salt and nitrogen source, e.g. polyaniline–Fe has been reported.53 However, the two species in the precursor have different physical properties (e.g. melting point and boiling point), and therefore, doping of nitrogen and iron atoms with a uniform distribution on the whole carbon matrix is difficult using these methods. Thus, the development of new synthetic methods is critical. Poly(ionic liquid)s (PILs), integrating the properties of nitrogen-rich ILs and organic polymers,26,54 feature porous characteristics and wide solubility and ionic conductivity of their monomer. Moreover, PILs with imidazole groups have coordination ability with transition metals. Also, PILs can serve as good confining agents for the preparation of nano-size composites.55–57 However, to date, the synthesis of Fe–N/C composites using PILs has never been reported.
Herein, we report the synthesis and ORR properties of a new FeCxNy/N-PC catalyst, which is prepared using Fe-complex enveloped PILs as the precursor. The structural characterizations revealed the obtained catalysts feature a high N content. The electrochemical measurement results indicated that the prepared FeCxNy/N-PC catalysts show excellent ORR performances. Furthermore, density functional theory calculations revealed the free-energy profile of the catalytic reaction, shedding light on the rate-determining step. Also, the electronic structure analysis revealed the synergistic effect of Fe and N atoms on the high-performance ORR properties.
Experimental section
Materials
1-Vinyl-3-methylimidazolium dicyanamide ((VMIm)DCA) was obtained from YuLu Fine Chemical Co., Ltd. 2,2′-Azobisisobutyronitrile (AIBN), sodium pentacyanoamminoferroate(II) hydrate and N,N-dimethylformamide (DMF) were purchased from TCI Development Co., Ltd. SBA-15 was purchased from XFNANO. Commercial Pt/C (20% Pt loading) was purchased from Alfa-Aesar. All chemical reagents were of analytical grade and used without any further purification.Synthesis
Electrochemical measurements
All electrochemical measurements were performed on a CHI760E electrochemical workstation (Chenhua Instruments Co., Shanghai) with a three-electrode system. A glassy carbon electrode (GCE, 4.0 mm), platinum wire and Ag/AgCl (3 M KCl) served as the working electrode, counter electrode and reference electrode, respectively. The potentials versus the reference electrode were converted into potentials of the reversible hydrogen electrode (RHE) using the equation: E(RHE) = E(Ag/AgCl) + 0.197 V + 0.059 × pH. All the working electrodes were prepared as follows: a mixture of 4 mg catalyst, 100 μL 5 wt% Nafion and 900 μL absolute ethanol was sonicated for 30 min to obtain a uniform catalyst ink. Then, 5 μL homogeneous catalyst ink was deposited on a polished GCE. The loading mass of all the samples on the GCE was 160 μg cm−2. The commercial Pt/C catalyst was deposited on the polished GCE via the same method for comparison. Cyclic voltammetry (CV) measurement of the samples in both N2- and O2-saturated 0.1 M KOH solution was conducted in the potential range of 0 to 1.2 V versus RHE at a scan rate of 50 mV s−1. Linear sweep voltammograms (LSV) were obtained from the rotating disk electrode (RDE) in O2-saturated 0.1 M KOH at a scan rate of 10 mV s−1 under the rotation speed of 400 to 2025 rpm. Electrochemical impedance spectroscopy (EIS) was conducted in the frequency range of 106 to 1 Hz and at 5 mV amplitude. The electron transfer number (n) of the ORR tests was calculated using the Koutecky–Levich (K–L) equation:| 1/J = 1/JL + 1/JK = 1/Bω1/2 + 1/JK |
| B = 0.62nFC0D02/3V−1/6 |
![[thin space (1/6-em)]](https://www.rsc.org/images/entities/char_2009.gif) 485 C mol−1), C0 is the saturated concentration of O2 in 0.1 M KOH (1.2 × 10⁻³ mol L−1), D0 is the O2 diffusion coefficient in the electrolyte of 0.1 M KOH (1.9 × 10⁻⁵ cm2 s−1), and V is the kinetic viscosity of 0.1 M KOH (0.01 cm2 s−1).
485 C mol−1), C0 is the saturated concentration of O2 in 0.1 M KOH (1.2 × 10⁻³ mol L−1), D0 is the O2 diffusion coefficient in the electrolyte of 0.1 M KOH (1.9 × 10⁻⁵ cm2 s−1), and V is the kinetic viscosity of 0.1 M KOH (0.01 cm2 s−1).
Electrochemical ORR tests were also conducted using a glassy carbon rotating ring-disk electrode (RRDE) with a diameter of 4 mm.
| The H2O2(%) = 200(IR/N) (ID + IR/N) |
Computational details for DFT
Spin-polarized density functional theory (DFT) calculations were performed using the Vienna ab initio simulation package (VASP).58 The Perdew–Burke–Ernzerhof (PBE) version of the generalized gradient approximation (GGA)59,60 was used to describe the exchange and correlation (XC) interaction. To accurately describe the core electrons effect on the valence electron density, the projector augmented wave (PAW) method61 was adopted. The cutoff energy for the plane wave basis sets was 400 eV. The relaxation computations were not completed until the convergence threshold of 10−5 eV in energy and 10−2 eV Å−1 in force was reached. A 4 × 4 × 1 Monkhorst–Pack special k-point mesh was found to adequately converge the stress for geometry optimizations, while a larger grid (12 × 12 × 1) was used for electronic structure computations. The DFT-D3 method was employed to describe the long-range electrostatic interactions of ORR species (including O2, O, OH, and OOH) with catalysts. The adsorption energy (Eads) for all the ORR species was defined as:| Eads = Etotal − Esub − EORR |
The Gibbs free energy calculations followed the hydrogen electrode (CHE) model suggested by Nørskov et al. The ΔG for the elemental step was determined using the expression:
| ΔG = ΔEDFT + ΔZPE + ΔH − TΔS + ΔGpH + neU, |
ln[H+] = pH × kBTln10, where kB is the Boltzmann constant. Considering practical conditions, for the calculation presented here, the pH value is equal to 13. U and n represent equilibrium potential and the electron number in the elemental reaction, respectively. The standard hydrogen electrode (SHE) is in equilibrium with the 0 V electro-potential and pH = 0 with a pressure of 1 bar at 298 K. Hence, the free energy of (H+ + e−) can be replaced by that of 1/2H2.
Result and discussion
Hierarchically porous FeCxNy/N-PC catalysts were synthesized via the template impregnation method. The entire synthetic procedure is shown in Scheme 1, where a mesoporous silica template with a diameter of 6–11 nm was selected as the hard template for deriving the hierarchical porous structure. (VMIm)DCA ionic liquid was employed as the carbon and nitrogen source. Sodium pentacyanoamminoferroate(II) hydrate mainly served as the iron source and was impregnated with the silica template. After impregnation and polymerization, the obtained grey powder was carbonized by high-temperature calcination under an N2 atmosphere to obtain Fe–N/C/silica. Subsequently, the black hierarchically porous Fe–N/C powder was successfully prepared after removing the silica template in HF aqueous solution.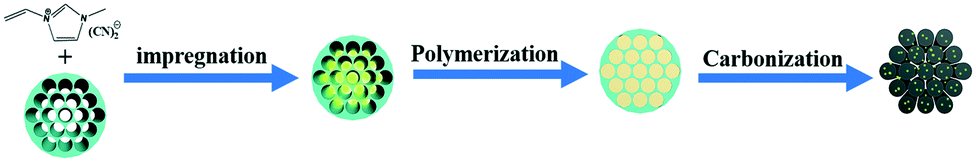 | ||
| Scheme 1 Synthetic process for the catalysts. | ||
Fig. 1 shows the scanning electron microscopy (SEM) and transmission electron microscopy (TEM) images of the FeCxNy/N-PC catalysts. FeCxNy/N-PC-3 (Fig. 1a) exhibited a better 3D well-interconnected mesh structure than FeCxNy/N-PC-1, FeCxNy/N-PC-2 and FeCxNy/N-PC-4 (Fig. S1(a–c)†) after HF etching. We inferred that the PILs decomposed insufficiently at 600 °C and 700 °C under the nitrogen atmosphere; however, the mesh carbon skeleton collapsed at 900 °C under the nitrogen atmosphere. Meanwhile, as shown in Fig. 1b and S1(d–f),† the TEM images of the FeCxNy/N-PC catalysts show that as the carbonization temperature increased, the number of cyst-like structure decreased and the number of ordered carbon arrays increased after etching with the HF aqueous solution. This may be because the catalysts tended to generate acid-stable species (such as iron carbide and iron nitride) at the higher pyrolysis temperature.62Fig. 1b displays the interplanar spacings of 0.335 nm and 0.24 nm, which correspond to the (002) planes of graphitic carbon and the (210) plane of Fe3C for FeCxNy/N-PC-3.
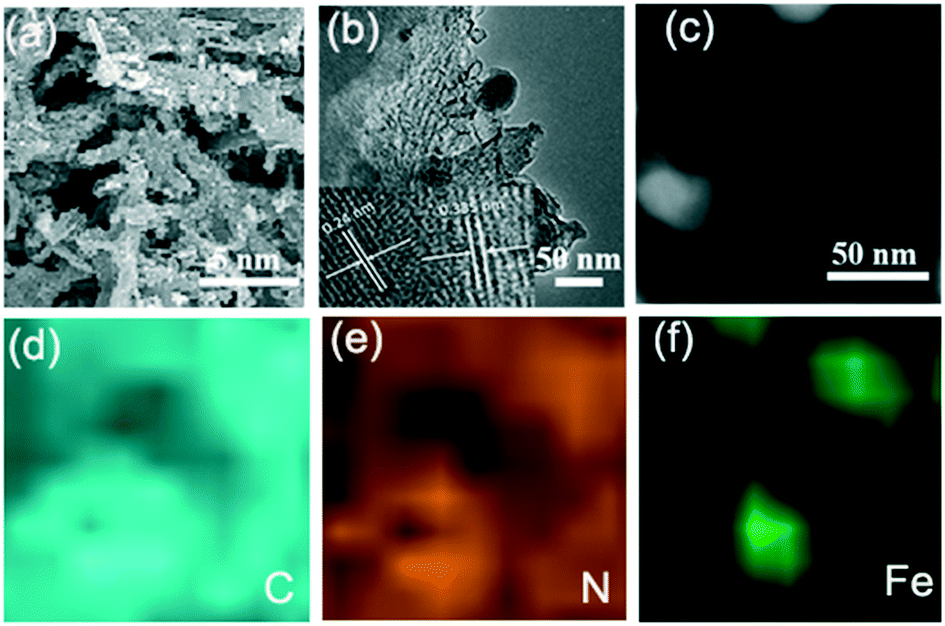 | ||
| Fig. 1 (a) and (b) SEM and TEM images of FeCxNy/N-PC-3, respectively. EELS mapping of (d) carbon, (e) nitrogen and (f) iron of the area in (c). | ||
Elemental mappings analysis was used to further investigate the elemental distribution of the area in Fig. 1c. Fig. 1d shows that the signal intensity of the carbon element is related with the distribution of iron, which indicates the formation of iron carbide in this area. As we designed, nitrogen element distributes in the whole network structure, and where the iron atoms are present, the signal strength of nitrogen is also intensified (Fig. 1e and f), which indicates the species of Fe–Nx was formed and the iron atoms could stabilize the nitrogen atoms during pyrolysis.
To confirm the species of the catalysts, the X-ray diffraction (XRD) patterns of the samples were recorded. As shown in Fig. 2a, the XRD pattern of FeCxNy/N-PC-1 (black curve) exhibits a aboard peak at 26.2° and a faint peak at 44.3°, which correspond to amorphous carbon, and no other obvious diffraction peak was observed. As the pyrolysis temperature increased, the crystalline phase of metallic iron, FeCx and FeNx was observed for FeCxNy/N-PC-3 and FeCxNy/N-PC-4 (Fig. 2a and S2,† respectively). The diffraction peaks in the XRD pattern of the catalysts can be classified as graphite carbon (JSPDS No. 08-0415), Fe3C (cementite JCPDS No. 35-0772), cubic iron (JSPDS No. 06-0696), FeN0.0560 (JCPDS No. 75-2137), and Fe5C2 (JCPDS No. 51-0997).
 | ||
| Fig. 2 (a) XRD patterns of the four FeCxNy/N-PC catalysts and Fe3C (JCPDS No. 06–0696), and FeNx (JCPDS No. 75–2137) as references. (b) XPS survey spectra of the four catalysts. (c and d) High-resolution N 1s and Fe 2p XPS spectra of FeCxNy/N-PC-3, respectively. (e) Raman spectra of the four catalysts. (f) Nitrogen adsorption–desorption isotherms and pore size distributions (inset) of FeCxNy/N-PC-3. | ||
The X-ray photoelectron spectroscopy (XPS) results further validated the above analysis. Fig. 2(b) shows that the as-synthesized catalysts are composed of C, O, N and Fe elements. The FeCxNy/N-PC-3 high-resolution C 1s spectrum can be divided into four peaks with the binding energies of 284.7 eV, 285.5 eV, 286.5 eV and 288.6 eV, corresponding to the carbon state of C–C, C–N, C–O and C![[double bond, length as m-dash]](https://www.rsc.org/images/entities/char_e001.gif) O, respectively (Fig. S3†). As shown in Fig. 2c, the high-resolution N 1s spectrum shows five peaks at 398.3 eV, 399.0 eV, 399.9 eV, 400.9 eV and 402.8 eV, which correspond to pyridinic nitrogen (Py-N), iron-coordinated nitrogen (Fe–Nx), pyrrolic nitrogen (Pry-N), graphitic-like nitrogen (G-like) and oxidized-nitrogen (Py–N–O), respectively.54,63–66Fig. 2d displays the Fe 2p spectrum of FeCxNy/N-PC-3, in which the peak at 708.1 eV can be attributed to Fe0/FeCx.67 Obviously, the intensity of the peak at 708.1 eV was enhanced with an increase in pyrolysis temperature, which indicates the formation of more metallic iron or carbide under a higher pyrolysis temperature (Fig. S4d–f†). The peak at 711.2 eV is attributed to Fe 2p3/2 since the nitrogen atoms can bond with iron to form Fe–Nx active sites.54,63,64,68 Moreover, as shown in Table S2,† the nitrogen content was significantly reduced at 900 °C, which may result in a decrease in the number of Fe–Nx active sites and an attenuation in performance toward the ORR.
O, respectively (Fig. S3†). As shown in Fig. 2c, the high-resolution N 1s spectrum shows five peaks at 398.3 eV, 399.0 eV, 399.9 eV, 400.9 eV and 402.8 eV, which correspond to pyridinic nitrogen (Py-N), iron-coordinated nitrogen (Fe–Nx), pyrrolic nitrogen (Pry-N), graphitic-like nitrogen (G-like) and oxidized-nitrogen (Py–N–O), respectively.54,63–66Fig. 2d displays the Fe 2p spectrum of FeCxNy/N-PC-3, in which the peak at 708.1 eV can be attributed to Fe0/FeCx.67 Obviously, the intensity of the peak at 708.1 eV was enhanced with an increase in pyrolysis temperature, which indicates the formation of more metallic iron or carbide under a higher pyrolysis temperature (Fig. S4d–f†). The peak at 711.2 eV is attributed to Fe 2p3/2 since the nitrogen atoms can bond with iron to form Fe–Nx active sites.54,63,64,68 Moreover, as shown in Table S2,† the nitrogen content was significantly reduced at 900 °C, which may result in a decrease in the number of Fe–Nx active sites and an attenuation in performance toward the ORR.
Thus, we investigated the effect of pyrolysis temperature on the crystal structure of the catalysts. As shown in Fig. 2e, the Raman spectra of all the as-prepared catalysts show the typical D (1438 cm−1) and G (1587 cm−1) bands, which are assigned to the disordered and graphitic networks in carbon, respectively. Due to the iron and nitrogen doping in the carbon framework and various pyrolysis temperatures, the D and G band shifted slightly for each catalyst. The ID/IG of FeCxNy/N-PC-1, FeCxNy/N-PC-2, FeCxNy/N-PC-3, and FeCxNy/N-PC-4 was 0.96, 0.76, 0.96 and 1.0, respectively. To characterize the specific surface area and the pore size distribution of the as-synthesized hierarchically porous carbon nanostructures, the Brunauer–Emmet–Teller (BET) and Barrett–Joyner–Halenda (BJH) methods were also conducted. Fig. 3f and S5† show the N2 adsorption/desorption isotherms of the FeCxNy/N-PC catalysts, which correspond with type IV isotherms, indicate the microporous and mesoporous nature of the catalysts.69 FeCxNy/N-PC-3 displayed the higher surface area (719.1 m2 g−1) than FeCxNy/N-PC-4 (198.0 m2 g−1), FeCxNy/N-PC-2 (454.0 m2 g−1) and FeCxNy/N-PC-1 (272.5 m2 g−1), and the average pore diameter of the four catalysts was 6.5 nm, 8.41 nm, 4.6 nm and 8.23 nm, respectively. We speculate that a too low or too high carbonization temperature is not beneficial for the formation of a porous carbon skeleton, and the SEM images also confirmed our speculation. The pore size distributions of the FeCxNy/N-PC catalysts are shown in the inset of Fig. 2f, S5 and Table S1,† where the pore size distribution of FeCxNy/N-PC-3 is in the range of 5–20 nm (inset Fig. 2f). These characteristics are highly desirable for exposing active sites and improving the transport of ORR-relevant species.
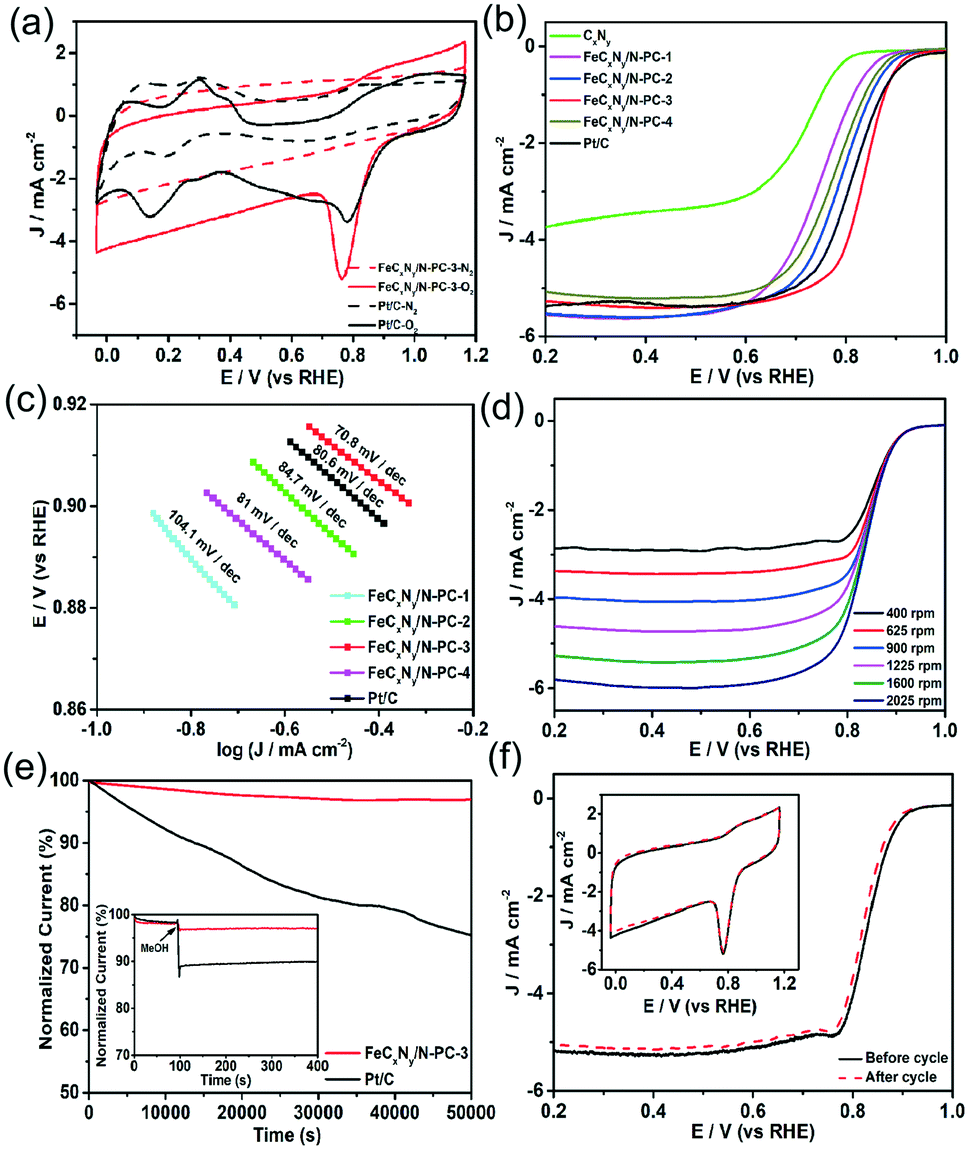 | ||
| Fig. 3 (a) CV curves (50 mV s−1, solid/dash line recorded in saturated O2/N2) of the FeCxNy/N-PC-3 and Pt/C catalysts. (b) LSVs of the samples in O2-saturated 0.1 M KOH at a scan rate of 10 mV s−1 and electrode rotating speed of 1600 rpm. (c) Tafel plots of FeCxNy/N-PC-3 and Pt/C. (d) LSVs of FeCxNy/N-PC-3 in O2-saturated 0.1 M KOH at various rotation speeds at a scan rate of 10 mV s−1. Inset in d shows the K–L plots of FeCxNy/N-PC-3 at different potentials. (e) Current-time responses of the FeCxNy/N-PC-3 and Pt/C catalysts. Inset shows the tolerance tests to MeOH for the FeCxNy/N-PC-3 and Pt/C catalysts at 0.6 V. (f) FeCxNy/N-PC-3 performance for the ORR in O2-saturated 0.1 M KOH before and after 5000 cycles. | ||
The ORR performance of the samples was firstly measured by cyclic voltammetry (CV). As shown in Fig. 3a, in N2-saturated 0.1 M KOH solution, they exhibited featureless CV curves; however, in O2-saturated 0.1 M KOH solution, Pt/C and FeCxNy/N-PC-3 showed obvious cathodic ORR peaks at 0.76 V and 0.78 V, respectively, implying the superior ORR activity of FeCxNy/N-PC-3. The ORR activity of the catalysts was further assessed by linear sweep voltammetry. For the ORR, the half-wave potential (E1/2) is independent of the catalyst concentration and is a critical benchmark for ORR activity. As shown in Fig. 3b, CxNy showed the worst ORR performance with the most negative onset potential and E1/2. However, after the introduction of the iron source, the FeCxNy/N-PC catalysts exhibited a significant improvement in E1/2. We also explored the importance of the template and found that the ORR performance of the catalysts is poor without the addition of the template (Fig. S6†). FeCxNy/N-PC-3 showed the most positive E1/2 (0.836 V), which is 18 mV more positive than that of the commercial Pt/C (0.818 V). This enhancement in the limited current density is attributed to the introduction of the iron source, which enhanced the active sites of the catalysts by promoting the formation of graphitic carbon.70 The positive shift in the onset potential for the FeCxNy/N-PC catalyst can be attributed to the Fe–Nx active sites effectively catalysing the ORR process. It has been recognized that an effective ORR process should possess a low Tafel slope.71 As shown in Fig. 3c, the Tafel slope of the FeCxNy/N-PC-3 (70.8 mV dec−1) is smaller than that that of the commercial Pt/C (80.6 mV dec−1) in 0.1 M KOH solution.
Furthermore, electrochemical impedance spectroscopy (EIS) was performed to disclose the properties of the charge transfer and mass transport with in the frequency range of 106 to 1 Hz.72 Fig. S8d† shows the fitting semicircles for the FeCxNy/N-PC catalysts, where FeCxNy/N-PC-3 shows the smallest high-frequency and low frequency intercepts, indicating that the structure of FeCxNy/N-PC-3 is more conducive for charge transfer and mass transport than the other samples the for ORR. The ORR kinetics of the samples was also investigated using the rotating disk electrode (RDE) technique at different rotation speeds (Fig. 3d). The electron transfer number for the ORR was calculated based on the Koutecky–Levich (K–L) equation plots. As shown in Fig. S7(c and d),† the electron transfer of CxNy and FeCxNy/N-PC-3 was around 2 and 4, indicating that CxNy and FeCxNy/N-PC-3 catalyzed the ORR mainly through a two-electron and four-electron pathway, respectively. Fig. S8(a and b)† show the RRDE results for CxNy and FeCxNy/N-PC-3. The percentage of hydrogen peroxide for FeCxNy/N-PC-3 (∼1.2%) was much lower that of CxNy (∼55%) at 0.75 V, which further confirmed the electron transfer number of the samples. The specific activity of the catalysts based on mass was calculated using the polarization curves presented in Fig. S9a.† It is obvious that FeCxNy/N-PC-3 exhibited highest mass activity of 842 mA mg−1 Fe at 0.85 V versus RHE.
For commercialization, apart from commendable ORR catalytic activity, good stability is another indispensable criterion for the practical application of catalysts. Thus, the FeCxNy/N-PC-3 and Pt/C catalysts were tested via the chronoamperometric technique at a constant voltage of 0.6 V versus RHE. As shown in Fig. 3e, FeCxNy/N-PC-3 displayed only an ∼3% decrease in current density over 50000 s, whereas the current density of the Pt/C catalyst decreased by ∼25% as a comparison. The tolerance of MeOH should also be considered under the applied voltage. The chronoamperometric responses of FeCxNy/N-PC-3 and Pt/C with the addition of 3 M methanol at 0.6 V was exhibited in the inset of Fig. 3e. The Pt/C catalyst showed an obvious decrease in current after the addition of methanol, which suggests its poor durability to MeOH; whereas, no noticeable shift was observed in the curve of FeCxNy/N-PC-3. Moreover, as shown in Fig. S7c,† the Pt/C catalyst exhibited obvious MeOH oxidation peaks, which further confirmed that the MeOH tolerance of FeCxNy/N-PC-3 is much better than that of the Pt/C catalyst in 0.1 M KOH. In addition, the stability of the catalysts was also measured via an accelerated durability test (ADT). Fig. 3f shows that the E1/2 of FeCxNy/N-PC-3 negatively shifted by ∼13 mV, but there was no obvious change in its CV curves after 3000 cycles, which indicates the good durability of FeCxNy/N-PC-3.
Moreover, the influence of iron content on the ORR activity was investigated. We prepared FeCxNy/N-PC catalysts with different Fe source contents at the pyrolysis temperature of 800 °C and under a nitrogen atmosphere (denoted as FeCxNy/N-PC-0.5X to FeCxNy/N-PC-1.5X by the various contents of iron precursor, respectively). As shown in Fig. 4a, the RDE measurements of these samples exhibited the optimal ORR performance when the mole ratio of Fe precursor and (VMIm)DCA was 1:20. Fig. 4a shows the E1/2 and current density of FeCxNy/N-PC-0.5X and FeCxNy/N-PC-0.7X, which are lower than that of FeCxNy/N-PC-X. According to the data in Table S2,† FeCxNy/N-PC-0.5X has the least Fe–Nx active sites, which may be responsible for its low ORR active. However, when we increased the Fe content, the E1/2 of FeCxNy/N-PC-1.25X and FeCxNy/N-PC-1.5X with more Fe–Nx active sites also exhibited the same trend. This could be attributed to the larger Fe nanoparticles encapsulated into the carbon layers, which may hinder mass transfer (Fig. S10†).
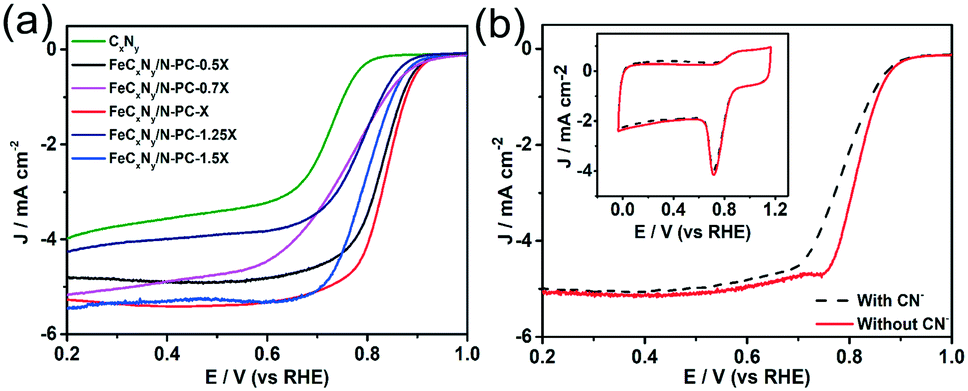 | ||
| Fig. 4 (a) RDE curves of FeCxNy/N-PC-0.5X, FeCxNy/N-PC-X and FeCxNy/N-PC-1.5X prepared with different contents of Fe source. (b) LSVs of FeCxNy/N-PC-X in O2-saturated 10 mM CN- at a scan rate of 10 mV s−1 and electrode rotating speed of 1600 rpm. | ||
Since the Fe–Nx active sites can improve the ORR catalytic activity, we investigated the relationship between Fe–Nx active sites and ORR performance in O2-saturated 0.1 M KOH via the addition of 10 mM CN−. FeCxNy/N-PC-3 exhibited a degradation in ORR activity (Fig. 4b). It has been recognized that CN− can strongly combine with Fe–Nx.73,74 Accordingly, Fe–Nx as the ORR active sites may be occupied by CN− rather than O2, resulting in the deterioration of ORR performance. This further confirmed that the Fe–Nx active sites are essential for the ORR. As shown in Fig. S11,† Fe2O3 and Fe2C3 exhibited poor ORR performances, which indicates that CN− does not poison all the Fe–Nx active sites.
To investigate catalytic mechanism of the FeCxNy/N-PC catalysts, spin polarized density functional theory calculations were carried out. Inspection of the current experimental information revealed that the FeCxNy nanoparticles act as the active sites for the ORR. Owing to the limitations of computational costs and theoretical methods, it was difficult to perform theoretical simulations toward the catalysts with their experimentally observed size. Thus, based on the XPS results of the best catalyst, herein, we used a 7 × 7 supercell of graphene doped with pores of 6 pyridine nitrogens to describe NPC and loaded Fe9CN to describe the catalyst. This model possessed an N atomic percentage of 6.8%, which is basically correlated with the previous experimental sample (9.15%) with the optimal catalytic performance.
As shown in Fig. 5, the possible active sites on the Fe9CN@NPC model are very complex, including the top sites (T1, T2, and T3) of the Fe atom, which connect to Fe, N, and C, the bridge sites (B1, B2, and B3) of Fe–N, Fe–C, and Fe–Fe, and the hollow sites (H1 and H2) of the Fe ring and Fe–C–N ring, respectively. The chemisorption of O2 molecules is the first necessary step to initialize the ORR. The optimization results showed that O2 can be absorbed on the T2 active site (−3.19 eV) and H1 (−3.02 eV). As can be seen in Fig. 6, O2 presents a side-on configuration on the H1 active site and the O–O bond distance changes from 1.234 Å to 1.468 Å. The other ORR species O, OH, and OOH absorbed on the top site with the strong adsorption energy of −6.14, −4.57, and −2.68 eV, respectively. The ORR species adsorption configuration on the T2 site is presented in Fig. S12.† The charge density differences calculation and electron localization function calculation also demonstrated a strong interaction (see Fig. S13 and S14†).
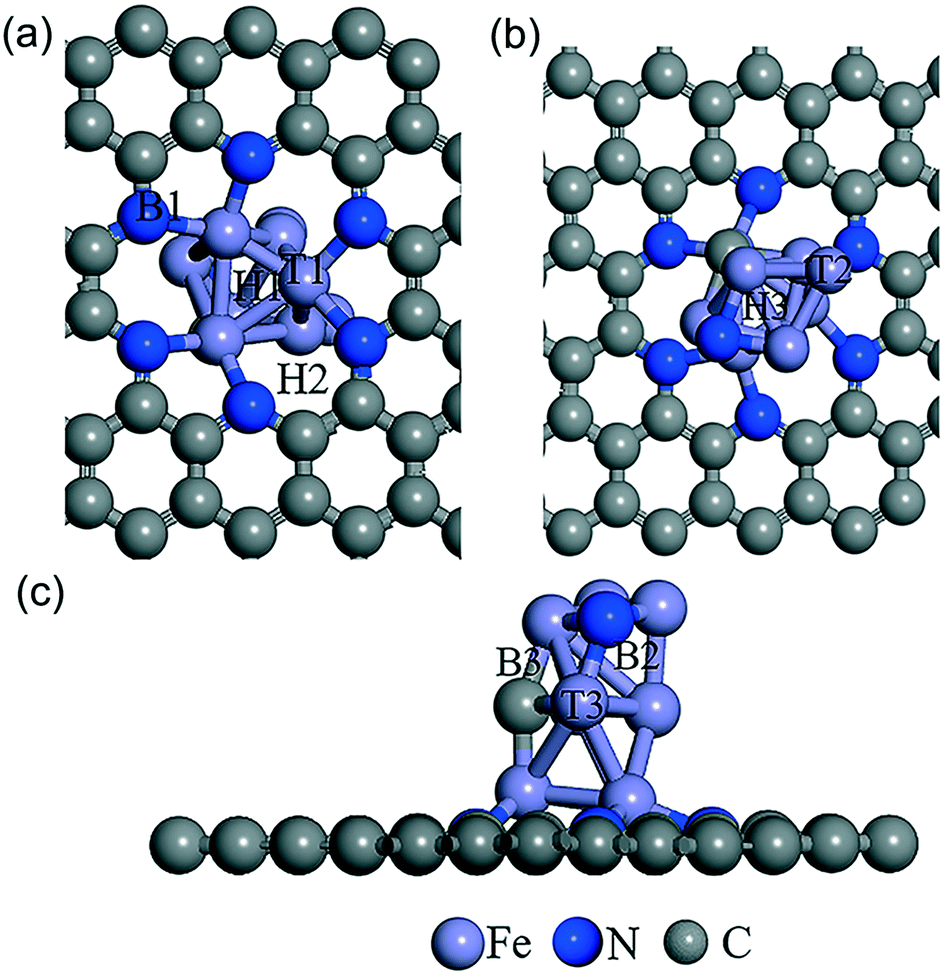 | ||
| Fig. 5 Schematic of the different adsorption sites of Fe9CN@NPC from the bottom view (a), top view (b) and side view (c). The supercell indicates the top, bridge, and hollow adatom sites. | ||
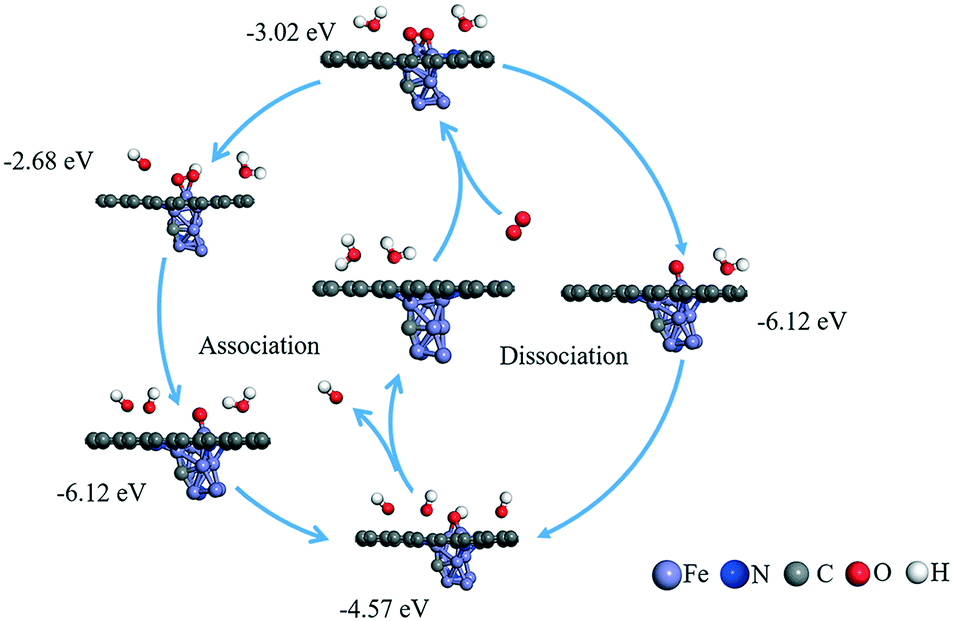 | ||
| Fig. 6 Possible reaction mechanisms and calculated adsorption energy (eV) for the ORR reaction under an alkaline environment. | ||
Further, the partial density of states (PDOS) were identified to probe the electronic effect between the ORR species and Fe–N active centre, as shown in Fig. 7 and S15.† For the pristine, FeCxNy/N-PC and O, OH, OOH adsorbed FeCxNy/N-PC, there are obvious differences between the spin up and spin down states, suggesting the spin polarization effect of Fe–N active centre. In the vicinity of the Fermi level, the effective overlap of Fe3d and N2p sheds light on the synergistic effect in the catalytic reaction. The main peaks of O2p at −4.0 eV below the Fermi level also have noticeable overlap with Fe3d and N2p curves, implying the strong interaction between the ORR species and Fe–N active centre. This verified the results of previous structural calculations. In addition, in comparison with the pristine FeCxNy/N-PC, the curve of N2p tended to be gentle in the PDOS of the ORR species adsorbed catalyst. This is means with the adsorption of the ORR species, the interactions between Fe and N become weaker. Thus, it is apparent that the synergistic effect between the Fe and N atoms can promote the ORR performance.
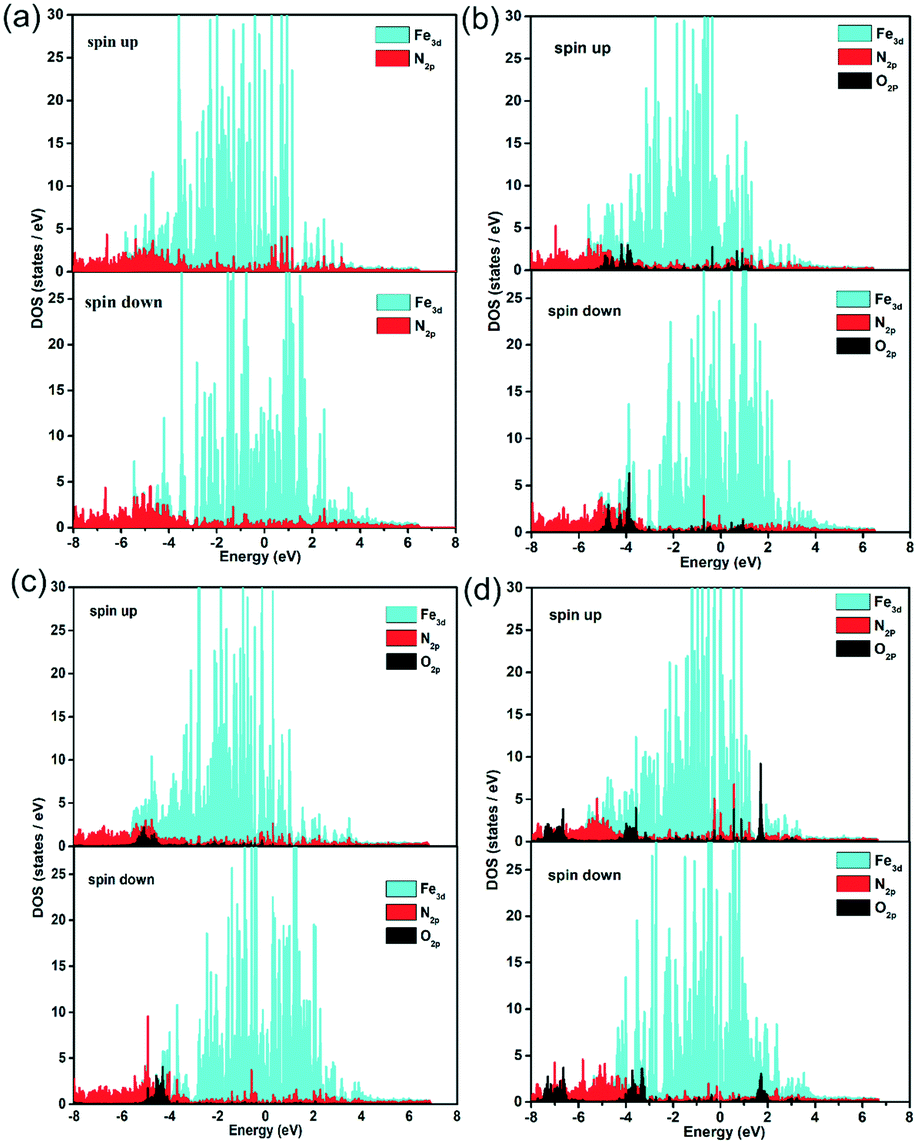 | ||
| Fig. 7 Partial density of states of Fe, N and O in the substrate (a), O/substrate (b), OH/substrate (c) and OOH/substrate (d) for the H1 active sites. | ||
Once the most stable reaction species structures are considered, two possible reaction pathways, consisting of five and three elemental steps respectively, have to be considered. According to the difference in O2 dissociation, they can be labelled as the dissociative mechanism (DSM) and associative mechanism (ASM).75 Herein, we simulated the Gibbs free-energy diagrams of these two mechanisms at the over-potential (U = 0 V) and equilibrium potential (U = 1.23 V), respectively. As shown in Fig. 8, at the zero electrode potential, O2 hydrogenation to form OOH is downhill by 1.709 eV in the ASM, and with the reaction enthalpy of −5.805 eV, O2 is split into two separate O atoms anchoring at the catalyst in the DSM. Subsequently, the dissociation of OOH is exothermic by −3.047 eV for the ASM, and the O atom hydrogenation process is −0.674 eV for the DSM. Briefly, both ASM and DSM are exothermic, except the formation step for H2O, which is clearly the rate-determining step. For the ASM, an electrode potential of at least 0.51 V is required to overcome the reaction barrier, while for DSM it is 4.02 V. The free energy profile of the ORR on the T2 active site is shown in Fig. S16.† All the above energy barriers were calculated at pH = 0; however, in the experiment, the ORR proceeded at pH = 11. Thus, we also considered the effect of pH on the free energies of the ORR. With an increase in pH value, the Gibbs free energy of each element step decreased (see Fig. S17 and S18†). Specifically, the Gibbs free energies of the four elemental steps decreased to 0.934, 2.272, 0.101, and 0.265 eV. The Gibbs free energies of the three elemental steps decreased to 5.03, 0.101 and 3.244 eV. Therefore, it was concluded that ORR on the H1 active site proceeds via the ASM with four electrons, and the synergistic effect of Fe and N atoms can promote the performance of the ORR, consistent with experimental results.
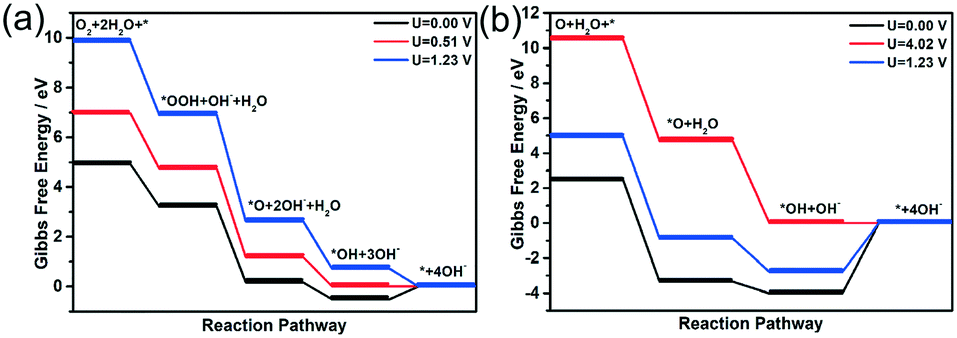 | ||
| Fig. 8 Free energy diagram for the ORR on the H1 active site under the association mechanism (a) and dissociation mechanism (b). pH = 0. Black, red and blue lines represent reactions at zero electrode potential (U = 0 V), the over-potential and the equilibrium potential (U = 1.23 V), respectively. | ||
Conclusions
In summary, we synthesized a series of high-performance non-precious metal ORR catalysts using a new synthetic method involving PILs as confining agents and a nitrogen source. The as-prepared FeCxNy/N-PC catalysts feature a well-distributed hierarchical porous structure with a specific surface area of 719.1 m2 g−1 and average pore diameter of 6.5 nm. The electrochemical measurement results indicated the FeCxNy/N-PC catalysts show superior catalytic activity (Tafel slope of 70.8 mV dec−1), stability and high methanol tolerance compared to the commercial Pt/C catalyst. Furthermore, the density functional theory calculations uncovered that the FeCxNy/N-PC composite catalyzes the ORR following the four-electron associative mechanism with the free-energy barrier of 0.51 eV in the rate-determining formation of H2O. Meanwhile, the electronic structure analysis demonstrated that the synergistic effect of Fe and N atoms in FeCxNy/N-PC can promote its ORR performance.Conflicts of interest
There are no conflicts to declare.Acknowledgements
This work was supported by the National Natural Science Foundation of China (Grant No. 21671172, 21625604), Zhejiang Provincial Natural Science Foundation (No. LR19B010001) and open fund of State Key Laboratory of Structural Chemistry (No. 20170036).Notes and references
- Y. Jiao, Y. Zheng, M. Jaroniec and S. Z. Qiao, Chem. Soc. Rev., 2015, 44, 2060–2086 RSC.
- Y. Nie, L. Li and Z. Wei, Chem. Soc. Rev., 2015, 44, 2168–2201 RSC.
- W. Xia, A. Mahmood, Z. Liang, R. Zou and S. Guo, Angew. Chem., Int. Ed., 2016, 55, 2650–2676 CrossRef CAS PubMed.
- J. Pan, Y. Y. Xu, H. Yang, Z. Dong, H. Liu and B. Y. Xia, Adv. Sci., 2018, 5, 1700691 CrossRef PubMed.
- A. Kulkarni, S. Siahrostami, A. Patel and J. K. Norskov, Chem. Rev., 2018, 118, 2302–2312 CrossRef CAS PubMed.
- M. Shao, Q. Chang, J. P. Dodelet and R. Chenitz, Chem. Rev., 2016, 116, 3594–3657 CrossRef CAS PubMed.
- D. S. He, D. He, J. Wang, Y. Lin, P. Yin, X. Hong, Y. Wu and Y. Li, J. Am. Chem. Soc., 2016, 138, 1494–1497 CrossRef CAS PubMed.
- J. Park, M. Kanti Kabiraz, H. Kwon, S. Park, H. Baik, S. I. Choi and K. Lee, ACS Nano, 2017, 11, 10844–10851 CrossRef CAS PubMed.
- Y. J. Wang, N. Zhao, B. Fang, H. Li, X. T. Bi and H. Wang, Chem. Rev., 2015, 115, 3433–3467 CrossRef CAS PubMed.
- S. M. Alia, S. Pylypenko, K. C. Neyerlin, D. A. Cullen, S. S. Kocha and B. S. Pivovar, ACS Catal., 2014, 4, 2680–2686 CrossRef CAS.
- D. He, L. Zhang, D. He, G. Zhou, Y. Lin, Z. Deng, X. Hong, Y. Wu, C. Chen and Y. Li, Nat. Commun., 2016, 7, 12362 CrossRef CAS PubMed.
- U. I. Kramm, M. Lefevre, N. Larouche, D. Schmeisser and J. P. Dodelet, J. Am. Chem. Soc., 2014, 136, 978–985 CrossRef CAS PubMed.
- X. L. Tian, Y. Y. Xu, W. Zhang, T. Wu, B. Y. Xia and X. Wang, ACS Energy Lett., 2017, 2, 2035–2043 CrossRef CAS.
- C. Wang, N. M. Markovic and V. R. Stamenkovic, ACS Catal., 2012, 2, 891–898 CrossRef CAS.
- X. Wang, S. I. Choi, L. T. Roling, M. Luo, C. Ma, L. Zhang, M. Chi, J. Liu, Z. Xie, J. A. Herron, M. Mavrikakis and Y. Xia, Nat. Commun., 2015, 6, 7594 CrossRef PubMed.
- J. Li, H. Zhou, H. Zhuo, Z. Wei, G. Zhuang, X. Zhong, S. Deng, X. Li and J. Wang, J. Mater. Chem. A, 2018, 6, 2264–2272 RSC.
- J. C. Meier, I. Katsounaros, C. Galeano, H. J. Bongard, A. A. Topalov, A. Kostka, A. Karschin, F. Schüth and K. J. J. Mayrhofer, Energy Environ. Sci., 2012, 5, 9319 RSC.
- C. Sealy, Mater. Today, 2008, 11, 65–68 CrossRef CAS.
- B. Y. Xia, Y. Yan, N. Li, H. B. Wu, X. W. Lou and X. Wang, Nat. Energy, 2016, 1, 15006 CrossRef CAS.
- S. Liu, I. S. Amiinu, X. Liu, J. Zhang, M. Bao, T. Meng and S. Mu, Chem. Eng. J., 2018, 342, 163–170 CrossRef CAS.
- P. Mani, A. Sheelam, S. Das, G. Wang, V. K. Ramani, K. Ramanujam, S. K. Pati and S. Mandal, ACS Omega, 2018, 3, 3830–3834 CrossRef CAS.
- M. Shen, C. Wei, K. Ai and L. Lu, Nano Res., 2017, 10, 1449–1470 CrossRef CAS.
- Y.-J. Wang, H. Fan, A. Ignaszak, L. Zhang, S. Shao, D. P. Wilkinson and J. Zhang, Chem. Eng. J., 2018, 348, 416–437 CrossRef CAS.
- H. Wu, H. Li, X. Zhao, Q. Liu, J. Wang, J. Xiao, S. Xie, R. Si, F. Yang, S. Miao, X. Guo, G. Wang and X. Bao, Energy Environ. Sci., 2016, 9, 3736–3745 RSC.
- X. Xia, M. Li, T. Liu, P. Liang and X. Huang, Chem. Eng. J., 2018, 342, 395–400 CrossRef CAS.
- J. Yang, X. Wang, B. Li, L. Ma, L. Shi, Y. Xiong and H. Xu, Adv. Funct. Mater., 2017, 27, 1606497 CrossRef.
- X. Zhou, Y.-J. Gao, S.-W. Deng, S. Cheng, S.-H. Zhang, H. Hu, G.-L. Zhuang, X. Zhong and J.-G. Wang, Ind. Eng. Chem. Res., 2017, 56, 11100–11110 CrossRef CAS.
- X. Zhong, Y. Jiang, X. Chen, L. Wang, G. Zhuang, X. Li and J.-G. Wang, J. Mater. Chem. A, 2016, 4, 10575–10584 RSC.
- X. Zhong, L. Liu, X. Wang, H. Yu, G. Zhuang, D. Mei, X. Li and J.-G. Wang, J. Mater. Chem. A, 2014, 2, 6703–6707 RSC.
- X. L. Tian, L. Wang, B. Chi, Y. Xu, S. Zaman, K. Qi, H. Liu, S. Liao and B. Y. Xia, ACS Catal., 2018, 8, 8970–8975 CrossRef CAS.
- X. Chen, L. Yu, S. Wang, D. Deng and X. Bao, Nano Energy, 2017, 32, 353–358 CrossRef CAS.
- Y. Chen, S. Ji, Y. Wang, J. Dong, W. Chen, Z. Li, R. Shen, L. Zheng, Z. Zhuang, D. Wang and Y. Li, Angew. Chem., Int. Ed., 2017, 56, 6937–6941 CrossRef CAS PubMed.
- M. M. Hossen, K. Artyushkova, P. Atanassov and A. Serov, J. Power Sources, 2018, 375, 214–221 CrossRef CAS.
- Q. Jia, N. Ramaswamy, U. Tylus, K. Strickland, J. Li, A. Serov, K. Artyushkova, P. Atanassov, J. Anibal, C. Gumeci, S. C. Barton, M.-T. Sougrati, F. Jaouen, B. Halevi and S. Mukerjee, Nano Energy, 2016, 29, 65–82 CrossRef CAS.
- A. Kong, Y. Zhang, Z. Chen, A. Chen, C. Li, H. Wang and Y. Shan, Carbon, 2017, 116, 606–614 CrossRef CAS.
- Z. Liu, J. Yu, X. Li, L. Zhang, D. Luo, X. Liu, X. Liu, S. Liu, H. Feng, G. Wu, P. Guo, H. Li, Z. Wang and X. S. Zhao, Carbon, 2018, 127, 636–642 CrossRef CAS.
- Y. Lv, Y. Lin, L. Yang, Z. Cai, B. Jing, J. Yu, X. Jiang, Z. Xing and J. Zou, Chem. Eng. J., 2018, 342, 228–237 CrossRef CAS.
- A. Mufundirwa, G. F. Harrington, B. Smid, B. V. Cunning, K. Sasaki and S. M. Lyth, J. Power Sources, 2018, 375, 244–254 CrossRef CAS.
- S. Ratso, I. Kruusenberg, M. Käärik, M. Kook, L. Puust, R. Saar, J. Leis and K. Tammeveski, J. Power Sources, 2018, 375, 233–243 CrossRef CAS.
- H. Tan, Y. Li, X. Jiang, J. Tang, Z. Wang, H. Qian, P. Mei, V. Malgras, Y. Bando and Y. Yamauchi, Nano Energy, 2017, 36, 286–294 CrossRef CAS.
- Y. C. Wang, Y. J. Lai, L. Song, Z. Y. Zhou, J. G. Liu, Q. Wang, X. D. Yang, C. Chen, W. Shi, Y. P. Zheng, M. Rauf and S. G. Sun, Angew. Chem., Int. Ed., 2015, 54, 9907–9910 CrossRef CAS PubMed.
- Z. Zhang, M. Dou, J. Ji and F. Wang, Nano Energy, 2017, 34, 338–343 CrossRef CAS.
- S. H. Ahn, X. Yu and A. Manthiram, Adv. Mater., 2017, 29, 1606534 CrossRef PubMed.
- L. Lin, Z. K. Yang, Y.-F. Jiang and A.-W. Xu, ACS Catal., 2016, 6, 4449–4454 CrossRef CAS.
- D. Malko, A. Kucernak and T. Lopes, Nat. Commun., 2016, 7, 13285 CrossRef CAS PubMed.
- Y. Ye, H. Li, F. Cai, C. Yan, R. Si, S. Miao, Y. Li, G. Wang and X. Bao, ACS Catal., 2017, 7, 7638–7646 CrossRef CAS.
- H. Yin, C. Zhang, F. Liu and Y. Hou, Adv. Funct. Mater., 2014, 24, 2930–2937 CrossRef CAS.
- A. Zitolo, V. Goellner, V. Armel, M. T. Sougrati, T. Mineva, L. Stievano, E. Fonda and F. Jaouen, Nat. Mater., 2015, 14, 937–942 CrossRef CAS PubMed.
- E. F. Holby, G. Wu, P. Zelenay and C. D. Taylor, J. Phys. Chem. C, 2014, 118, 14388–14393 CrossRef CAS.
- S. Kabir, K. Artyushkova, B. Kiefer and P. Atanassov, Phys. Chem. Chem. Phys., 2015, 17, 17785–17789 RSC.
- W. Liang, J. Chen, Y. Liu and S. Chen, ACS Catal., 2014, 4, 4170–4177 CrossRef CAS.
- R. Cao, R. Thapa, H. Kim, X. Xu, M. Gyu Kim, Q. Li, N. Park, M. Liu and J. Cho, Nat. Commun., 2013, 4, 2076 CrossRef PubMed.
- H. W. Liang, W. Wei, Z. S. Wu, X. Feng and K. Mullen, J. Am. Chem. Soc., 2013, 135, 16002–16005 CrossRef CAS PubMed.
- H. Shen, E. Gracia-Espino, J. Ma, H. Tang, X. Mamat, T. Wagberg, G. Hu and S. Guo, Nano Energy, 2017, 35, 9–16 CrossRef CAS.
- J. K. Sun, Z. Kochovski, W. Y. Zhang, H. Kirmse, Y. Lu, M. Antonietti and J. Yuan, J. Am. Chem. Soc., 2017, 139, 8971–8976 CrossRef CAS PubMed.
- X. Xu, Y. Li, Y. Gong, P. Zhang, H. Li and Y. Wang, J. Am. Chem. Soc., 2012, 134, 16987–16990 CrossRef CAS PubMed.
- Q. Zhao, P. Zhang, M. Antonietti and J. Yuan, J. Am. Chem. Soc., 2012, 134, 11852–11855 CrossRef CAS PubMed.
- G. Kresse and J. Furthmuller, Phys. Rev. B: Condens. Matter Mater. Phys., 1996, 54, 11169–11186 CrossRef CAS.
- J. P. Perdew, K. Burke and M. Ernzerhof, Phys. Rev. Lett., 1998, 80, 891 CrossRef CAS.
- J. P. Perdew, K. Burke and M. Ernzerhof, Phys. Rev. Lett., 1996, 77, 3865–3868 CrossRef CAS PubMed.
- P. E. Blöchl, Phys. Rev. B: Condens. Matter Mater. Phys., 1994, 50, 17953–17979 CrossRef.
- U. I. Kramm, J. Herranz, N. Larouche, T. M. Arruda, M. Lefevre, F. Jaouen, P. Bogdanoff, S. Fiechter, I. Abs-Wurmbach, S. Mukerjee and J. P. Dodelet, Phys. Chem. Chem. Phys., 2012, 14, 11673–11688 RSC.
- W. J. Jiang, L. Gu, L. Li, Y. Zhang, X. Zhang, L. J. Zhang, J. Q. Wang, J. S. Hu, Z. Wei and L. J. Wan, J. Am. Chem. Soc., 2016, 138, 3570–3578 CrossRef CAS PubMed.
- Q. Lai, L. Zheng, Y. Liang, J. He, J. Zhao and J. Chen, ACS Catal., 2017, 7, 1655–1663 CrossRef CAS.
- M. J. Workman, M. Dzara, C. Ngo, S. Pylypenko, A. Serov, S. McKinney, J. Gordon, P. Atanassov and K. Artyushkova, J. Power Sources, 2017, 348, 30–39 CrossRef CAS.
- Y. Zhao, K. Watanabe and K. Hashimoto, J. Am. Chem. Soc., 2012, 134, 19528–19531 CrossRef CAS PubMed.
- A. Serov, K. Artyushkova and P. Atanassov, Adv. Energy Mater., 2014, 4, 1301735 CrossRef.
- B. Wang, X. Wang, J. Zou, Y. Yan, S. Xie, G. Hu, Y. Li and A. Dong, Nano Lett., 2017, 17, 2003–2009 CrossRef CAS PubMed.
- A. Vinu, Adv. Funct. Mater., 2008, 18, 816–827 CrossRef CAS.
- Z. He, J.-L. Maurice, A. Gohier, C. S. Lee, D. Pribat and C. S. Cojocaru, Chem. Mater., 2011, 23, 5379–5387 CrossRef CAS.
- S. Liu, H. Zhang, Q. Zhao, X. Zhang, R. Liu, X. Ge, G. Wang, H. Zhao and W. Cai, Carbon, 2016, 106, 74–83 CrossRef CAS.
- P. M. Gomadam and J. W. Weidner, Int. J. Energy Res., 2005, 29, 1133–1151 CrossRef CAS.
- Y. Li, W. Zhou, H. Wang, L. Xie, Y. Liang, F. Wei, J. C. Idrobo, S. J. Pennycook and H. Dai, Nat. Nanotechnol., 2012, 7, 394–400 CrossRef CAS PubMed.
- U. Tylus, Q. Jia, K. Strickland, N. Ramaswamy, A. Serov, P. Atanassov and S. Mukerjee, J. Phys. Chem. C, 2014, 118, 8999–9008 CrossRef CAS PubMed.
- L. Yu, X. Pan, X. Cao, P. Hu and X. Bao, J. Catal., 2011, 282, 183–190 CrossRef CAS.
Footnotes |
| † Electronic supplementary information (ESI) available: Additional characterizations and electrochemical measurements results. See DOI: 10.1039/c8cy01694a |
| ‡ They contribute equally to this work. |
| This journal is © The Royal Society of Chemistry 2019 |