 Open Access Article
Creative Commons Attribution 3.0 Unported Licence
The effect of CO2 loading on alkanolamine absorbents in aqueous solutions†
Sergey M.
Melnikov
and
Matthias
Stein
 *
*
Molecular Simulations and Design Group, Max Planck Institute for Dynamics of Complex Technical Systems, Sandtorstrasse 1, 39106 Magdeburg, Germany. E-mail: matthias.stein@mpi-magdeburg.mpg.de
First published on 8th August 2019
Abstract
Post-combustion carbon capture by amine scrubbing is the most frequently used process to remove CO2 from pulverized coal-fired power plants and also biogas flue gas streams. The quest for novel absorbents for CO2 capture with improved properties requires insight into the properties of the CO2-loaded mixed solutions. A comparative molecular dynamics study of the product state solutions, with chemically-bound CO2 of standard monoethanolamine (MEA) and the new alternative 4-diethylamino-2-butanol (DEAB) at various CO2-loadings yields solvent properties in good agreement with experimental data. The concentration of all post-reaction species in solution was based on experimental equilibria distributions. The data generated provide detailed insight into the properties of reactive mixed alkanolamine solutions. The liquid structure of aqueous MEA solutions undergoes only minor changes when absorbing CO2. The diffusion coefficients of all molecular species, however, decrease significantly with increasing CO2-loadings. The large hydrophobic clusters formed in the reactant state by DEAB molecules in water prior to CO2 binding significantly decrease in size and structure upon CO2 absorption. The diffusion coefficients of all components decrease with increasing CO2-loading, whereas the pre-reaction alkanolamine DEAB shows an increase in diffusion coefficient. This structural and kinetic information supports the molecular design and further development of novel compounds and provides data for a global process simulation and optimization.
Introduction
The post-combustion removal of carbon dioxide from flue gas streams of pulverized coal-fired power plants and also biogas from anaerobic fermentation require efficient, robust and selective chemical CO2 absorbing compounds.1–4 Complementing engineering studies, computational approaches are essential to reveal the underlying reaction mechanisms of CO2 absorption and to develop new absorbing compounds.5,6 Selectivity and reversibility of the absorbent, and its liquid structure properties such as diffusion coefficient and viscosities are important selection criteria. In computational solvent design, molecular dynamics (MD) simulations are able to yield information, which are difficult or sometimes impossible to obtain experimentally. For example, the diffusion coefficient of CO2 in absorbing amine solution cannot be measured due to its reactivity and has to be extracted from nitrous oxide experiments. Recently, a wealth of information about liquid structure, intermolecular interactions and diffusion properties of aqueous alkanolamines, as well as solvation and mobility of CO2 molecules within such solvents was obtained computationally.7–18 However, all these studies were limited to the investigation of the pre-reaction state of CO2 in aqueous amine solutions. During the chemical CO2 absorption, carbamate and carbonate ions together with protonated alkanolamines are formed as products of the amine reaction with CO2, which then would eventually change the complex mixed solvent properties. In addition, at increasing CO2 loadings both non-reacted carbon dioxide and partially reacted solvents are present. The design and control of such a chemical absorption process requires information about the solvent properties changes during the reaction. Data about pre-reaction solvents are scarce in comparison to unreacted solvents. The kinetic network modelling CO2 in aqueous alkanolamine solutions requires accurate diffusion coefficients of all solvent components present in solution.19–21 Experimental viscosity studies of individual constituents do not allow an extrapolation of diffusion coefficients to the reactive solution. Therefore, structure-based simulations are indispensable to provide these missing data and only classical MD simulations allow a sufficient sampling and averaging over long trajectories and a large number of particles to give accurate results.We here present results from MD studies of CO2-loaded aqueous alkanolamine compounds which were identified from a large screening of candidates.22 Here, we focus on the primary monoethanolamine (MEA), the standard compound currently mostly used for CO2 capture, and the novel tertiary alkanolamine 4-diethylamino-2-butanol (DEAB) which were both fully characterized in binary aqueous alkanolamine solutions14 and in the presence of CO2.17 The choice of these two compounds is motivated by their difference in mechanism upon CO2 absorption and the formation of different intermediates in solution. MEA is fully hydrated and when chemically absorbing one CO2 molecule the carbamate anion MEACOO− and the protonated MEAH+ are generated.23 This sets the upper limit for a maximum capacity of MEA to 0.5 (i.e. the ratio of absorbed CO2 and reacted MEA molecules).24 DEAB molecules, on the other hand, form large hydrophobic clusters in aqueous solution and during absorption of CO2 the tertiary amine DEAB deprotonates water to give the protonated DEAB (DEABH+) species, and the hydroxide ion reacts with carbon dioxide to give bicarbonate (HCO3−), and carbonate (CO32−) ions.25,26 This sets the maximum capacity of DEAB to 1 (one bicarbonate ion HCO3− and one protonated DEABH+ per CO2 molecule are being formed). Artificial neural network based models were successfully applied to obtain equilibrium solubilities and mass transfer coefficients of CO2 absorption in aqueous solutions of DEAB27 from experimental data.28 and to develop a modeling-optimization framework in order to assess the CO2 absorption capacity for novel amine solutions.29 The molecular compounds in equilibrium are a mixture of reactant and product species and are presented in Fig. 1. Liquid structure properties of MEA and DEAB CO2 absorbents in solution were determined in the product states over a wide range of CO2-loadings. This reveals the influence of increasing concentrations of post-reaction molecular species on the structure of the complex mixed five- and six-component mixed solution. Changes in solution viscosities and molecular diffusion constants during the chemical absorption process can be traced and give detailed molecular insight into the post-combustion capture of carbon dioxide.
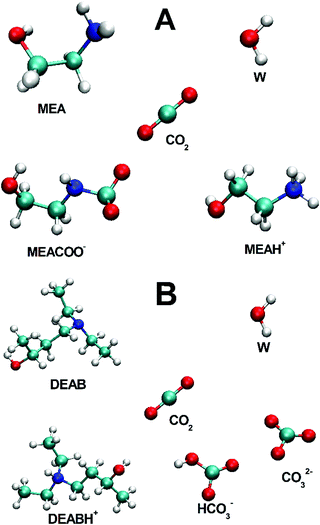 | ||
| Fig. 1 Molecular species in post-reaction mixed alkanolamine solutions: (A) five-component MEA/MEAH+/MEACOO−/H2O/CO2 system, (B) six-component DEAB/DEABH+/H2O/CO2/HCO3−/CO32− solution. | ||
Simulation details
All non-bonded and bonded interactions for alkanolamine molecules, their protonated forms MEAH+ and DEABH+ and the MEACOO− carbamate and also (bi-)carbonate ions were treated with help of the all-atom optimized potentials for liquid simulations (OPLS-AA) forcefield.30 Water molecules were represented by the charge/extended (SPC/E) model,31 and CO2 molecules by the transferable potentials for the phase equilibria (TraPPE).32 The accuracy of the use of these forcefields for the simulation of CO2 solvation in aqueous alkanolamines was validated before.14,17 Partial charges for the carbamate MEACOO− and protonated MEAH+ were taken from literature,18 and for the protonated DEABH+ from ref. 30. For a consistent set of charges, the Lowdin atomic charges for HCO3− and CO32− were re-calculated with Jaguar v. 8.7,33 using the M06-2 hybrid functional,34 an implicit SM8 solvation model for water35,36 and a 6-31G*+ basis set for all atoms. The charge distribution was symmetrized for chemically equivalent atoms and retains the full molecular charge. The calculated partial charges are given in the ESI.† Long-range electrostatic interactions were treated with the particle-mesh Ewald algorithm. Non-bonded interactions were modeled with a 12-6 Lennard-Jones potential. A cutoff radius of 1.4 nm was used for all interactions. Lennard-Jones parameters for unlike interactions were calculated using the geometric average rule. MD simulations were carried out with Gromacs 5.1.237 at 313 K. An isothermal–isobaric (NPT) ensemble 2 ns simulation run (preceded by 500 ps of equilibration) was carried out to define the solvent density. The liquid solution structures and molecular diffusion coefficients were acquired in a canonical (NVT) ensemble 40 ns simulation run (preceded by a 1 ns equilibration run). Such long trajectories were needed in order to obtain reliable and converged results for the diffusion coefficient of CO2 molecules at a low concentration of 0.1 M. The number of molecules and simulation box sizes for all studied molecular ensembles are provided in the ESI† (Tables S1 and S2). The appropriate simulation box dimensions were checked for absence of finite size effects. Diffusion coefficients were calculated from the relation between the mean square displacement and the observation time (over a 100–500 ps time interval).38 The shear viscosities were calculated using the non-equilibrium method39 by applying external forces, from which the energy is dissipated through viscous friction. The generated heat is removed by coupling to a heat bath.Results and discussion
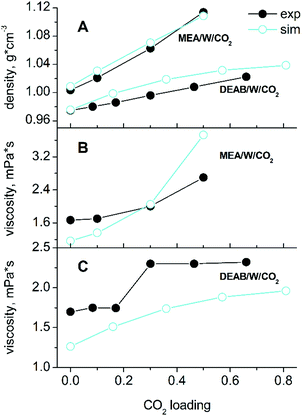
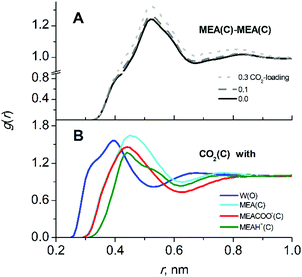
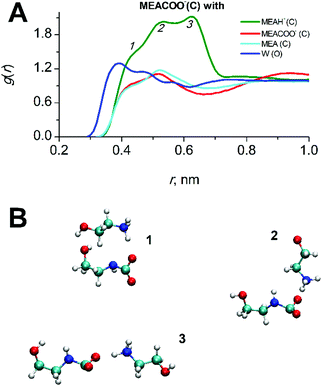
Simulations were carried out for starting compositions of alkanolamine/water solvent ratios of 30/70 w/w MEA/W and 22.5/77.5 w/w DEAB/W which are typical for the absorption process2,4 and at a typical process temperature of 313 K.22,40 The mole fractions of species in mixed solutions at various CO2 loadings were obtained from NMR spectroscopic studies.41,42 The absolute compositions for each system are given in the ESI† (Tables S1 and S2). A comparison with experimental43,44 data such as densities and viscosities is given in Fig. 2. There is a very good agreement for liquid densities over the entire range of CO2 loading (deviations are below 1% for MEA and 2.5% for DEAB). The calculated viscosities are also in good agreement with experiment and correctly reproduce the trend of increasing viscosities with increasing loading. According to our findings, the TIP4P/2005 water model45 performs slightly better for solvent viscosities of DEAB, but less so for the diffusion coefficients of complex mixed aqueous alkanolamine solutions.14 The large changes in density and viscosity with CO2 loading for MEA with respect to DEAB can be rationalized by the fact that the number of absorbed CO2 molecules in MEA at 0.5 loading is about 2 times larger than that in DEAB even at 0.815 loading.In CO2-loaded solution, the primary amine MEA molecules are fully solvated by water and the CO2 molecules are equally distributed between water and alkanolamine molecules.17 A simulation snapshot of an entire system at 0.3 CO2-loading is provided in Fig. S1 (ESI†). Compared to the pre-reaction system at 0 loading, in the fully reacted product system the MEA–MEA (see Fig. 3A), MEA–CO2 (see the Fig. S3, ESI†) and likewise the MEA–water interactions are only marginally affected by increase of CO2-loading. The slight increase of the first and second peak amplitudes in the radial distribution function (RDF) of MEAC–C (first and second solvation shells) at increasing CO2-loading is an evidence for a small increase of the mutual aggregation of MEA molecules. This feature can be rationalized by an increase of self-association of the more hydrophobic MEA molecules separating from the MEACOO− and MEAH+ ionic species and polar water molecules. MEACOO− and MEAH+ form a persistent ion pair in solution with only an occasional exchange of molecules. The characteristic lifetime for the ion pair is about 100 ps across the entire range of CO2-loading. The strong MEACOO−–MEAH+ pair is fully solvated by water molecules, uniformly distributed in solution and does not form larger clusters. As an example for the charged species interactions in the mixed five-component system, the RDF of the carbamate MECOO− with the other species in solution is given in Fig. 4.
The RDFs for the interactions of MEA and MEAH+s with other compounds in solution are given in the ESI.†
The solvation of CO2 in MEA solutions is not significantly affected by increasing the CO2-loading. The RDFs of CO2 interactions with other molecular species in solution at 0.3 loading are shown in Fig. 3B. As also found in the pre-reaction state, CO2 is equally found in proximity of water and MEA molecules (similar peak heights in Fig. 3B) but only slightly less probable to interact with MEACOO− and MEAH+. Analysis of interactions between CO2–MEA molecules at different loadings is given in the ESI† (Fig. S3). Upon an increase of MEACOO−–MEAH+ pair formation at higher CO2-loadings, the presence of CO2 molecules close to MEA species also increases slightly (see Fig. S3, ESI†).
Fig. 5 shows the molecular diffusion coefficients of all species present in solution after covalent CO2 binding to MEA. The diffusion coefficients of all species significantly decrease with increasing CO2-loading (numerical data can be found in the ESI,† Table S4). It has to be noted that the diffusion coefficient of CO2 in the fully reacted system (at 0.5 loading) is two times smaller than in the pre-reaction state since all MEA molecules have reacted with CO2. As expected, the mobility is critically dependent on the molecular mass: the heaviest molecules MEACOO− and MEAH+ are least mobile whereas water and CO2 diffuse fastest. The significant decrease of molecular diffusion coefficients is consistent with the experimentally measured increase of viscosity of the mixed solution (see above). Since hydrogen bond formation of water molecules does not change with CO2-loading (data not shown), the increase of viscosity of CO2-loaded MEA solution can only be explained by an increase of ion pair formation of MEACOO− and MEAH+ with higher supramolecular masses and lower diffusion coefficients.
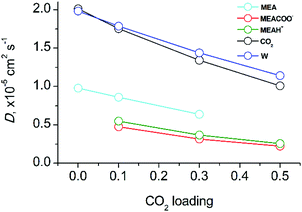 | ||
| Fig. 5 Diffusion coefficients of molecular components as a function of CO2 loading in aqueous MEA/CO2 solution. | ||
Compared to the primary amine MEA, the tertiary amine DEAB displays a different behavior upon an increase of CO2 loading. In the pre-react state, DEAB molecules tend to self-aggregate and form large clusters (see a snapshot of an entire system in Fig. S2, ESI†). The CO2 molecules show a preferred localization within these hydrophobic aggregates.14,17
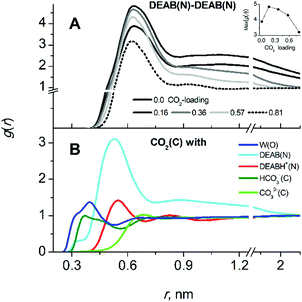
In contrast to MEA, absorption of CO2 in aqueous solutions by DEAB significantly affects the liquid structure. The effect of increasing CO2 loading on DEAB cluster formation can be seen in Fig. 6A. The peak amplitudes of the first and the second peaks of the RDF characterize the tendency of DEAB molecules to form self-aggregates. At low CO2-loading, DEAB clustering even increases since the presence of only a small amount of charged particles DEABH+/HCO3−/CO32− in solution enhances the hydrophobic/hydrophilic phase separation. Upon further increase of CO2-loading, more DEAB molecules have participated in the chemical reaction with CO2 which then leads to the formation of an increasing number of protonated DEABH+ molecules. Those tend to separate from the DEAB clusters due to their hydrophilic character and the number of hydrophobic DEAB–DEAB interactions decreases. This can be seen by the decrease of peak amplitudes in Fig. 6A at high loading. At a CO2-loading of 0.815, the second solvation shell of DEAB–DEAB aggregates almost vanishes indicating the formation of isolated molecular clusters.
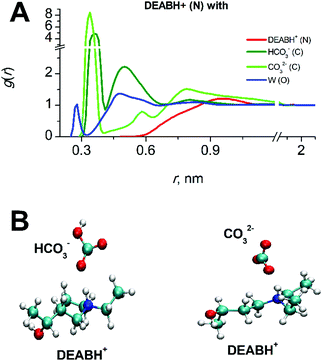
The product DEABH+ molecules form strong and stable complexes with oppositely charged HCO3− and CO32− species (see Fig. 7). The lifetime of such an electrostatic interaction is about 100 ps for the DEABH+–bicarbonate and 1–1.5 ns for the DEABH+–CO32− pair. The ionic ion pairs are uniformly distributed within each solution.
The localization of CO2 molecules in close proximity to DEAB nitrogen atoms follows the same tendency as the DEAB–DEAB interactions upon increasing CO2-loadings. At low loading, the local CO2 enrichment increases while with further CO2-loading it starts to decrease and finally disappears (see the CO2–DEAB RDFs in the Fig. S6, ESI†). This can be rationalized when considering the decrease of unreacted DEAB molecules in number at higher CO2-loading. Thus, the molecular clusters of DEAB become smaller in size, water molecules are beginning to penetrate these clusters and displace CO2 molecules close to the amine nitrogen atoms. The CO2–DEAB interaction is clearly the most prevalent and CO2 interactions with water, DEABH+, HCO3− and CO32− (see Fig. 6B) are less prominent. This is due to the hydrophobic nature of the interaction between CO2 and the alkanolamine solvent.17
Fig. 8 shows the diffusion coefficients of all molecular species in DEAB at various loadings (for numerical data see Table S5 in the ESI†). With increasing CO2-loading, the mobility of all compounds in the mixed solutions decreases. This is in agreement with the observed increase of viscosity (see above). The diffusion coefficients for DEABH+ and CO32− are identical expect for very high loading when the strong electrostatic interaction is persistent (with a lifetime of 1 ns) and the complex diffuses as a supermolecule. At low and intermediate CO2 loadings, the carbonate ions are preferably solvated by water molecules. The electrostatic interaction between the bicarbonate HCO3− and DEABH+ is weaker and thus it shows a faster diffusion. The slower diffusion of CO32− ions is determined its larger charge due to which the interactions with surrounding water molecules and DEABH+ are stronger and responsible a slower mobility.
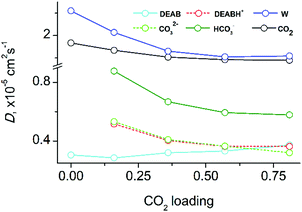 | ||
| Fig. 8 Diffusion coefficients of reaction product species in equilibrium as a function of CO2 loading in the six-component mixture of aqueous DEAB with CO2. | ||
The hydrophobic DEAB molecules within the self-aggregate clusters diffuse slower than charged DEABH+ molecules even when the latter are bound to anionic species such as carbonate and bi-carbonate. At very low CO2-loading, the DEAB molecules move even slower than in case of the pre-reaction solvent. As the CO2-loading increases, the DEAB cluster size becomes smaller and the diffusion coefficients of DEAB molecules thus increase with CO2 concentration and finally approach that of DEABH+. The free CO2 molecules are mostly localized within the DEAB clusters and are moving much faster than the DEAB molecules. The load-dependence of CO2 diffusion reflects on the one hand the acceleration of DEAB molecule diffusion and on the other hand the slower diffusion of other species in solution. Therefore, the CO2 diffusion coefficient is less sensitive to the CO2-loading than other mixture components. At a maximum loading of 0.815, the CO2 diffusion coefficient is still at 79% of the non-reacted ternary system. Water diffusion slows down upon increase of CO2 loading since the number of charged species DEABH+/HCO3−/CO32− increased which possess a tight solvation shell.
Conclusions
In conclusion, MD studies of CO2-loaded aqueous alkanolamine solutions for two representatives (MEA and DEAB solvents) were performed over a broad range of loading. Reaction of carbon dioxide with alkanolamines leads to complex five- and six-component post-reaction mixed solutions with different behavior.CO2 absorption does not significantly alter the liquid structure properties but the molecular diffusion coefficients change significantly for the standard primary amine MEA in aqueous solution. The MEA molecules and all charged product species are individually solvated; CO2 shows no preference to approach either MEA or water molecules. The diffusion coefficients of all molecule species decrease with increasing CO2-loading since the number of charged species and the solvent viscosity increase during the reaction.
For the tertiary alkanolamine DEAB, an opposite behavior is observed. Self-aggregation and clustering of hydrophobic DEAB molecules are diminishing in presence of the newly formed charged and hydrophilic absorbent species; the local concentration of CO2 molecules decreases in vicinity of DEAB molecules. At increasing CO2-loading, the diffusion coefficients decrease for all species in solution except for unreacted DEAB. Their mobility increases and finally approaches that of the protonated DEABH+ product. The change of diffusion coefficient of CO2 at increasing load is less prominent due to two compensating effects: the acceleration of mobility of the first solvation shell CO2 molecules in close proximity to DEAB molecules at low loading and the disruption of DEAB self-aggregates at higher loadings.
A clear understanding of molecular processes during carbon dioxide sequestration in post-combustion capture is an important pre-requisite to design and control novel CO2 absorbing compounds. The results show that different, sometimes competing effects have an influence on the diffusional properties and viscosities of amine scrubbers in reactors at different CO2 loadings. The physical and organic chemistry of alkanolamines is not facile to rationalize and requires careful analysis of novel data from structure-based simulations. These generated data form the basis of global process simulations and optimization of the entire carbon dioxide sequestration process in a chemical engineering approach.
Conflicts of interest
The authors declare no competing financial interest.Acknowledgements
Financial support by the Max Planck Gesellschaft for the Advancement of Science and the EU program ERDF (European Regional Development Fund) of the German Federal State Saxony-Anhalt within the Research Center of Dynamic Systems (CDS; project ‘Altmarkenergie’) is gratefully acknowledged. Open Access funding provided by the Max Planck Society.References
- G. T. Rochelle, Science, 2009, 325, 1652–1654 CrossRef CAS PubMed.
- B. Dutcher, M. Fan and A. G. Russell, ACS Appl. Mater. Interfaces, 2015, 7, 2137–2148 CrossRef CAS PubMed.
- D. M. D'Alessandro, B. Smit and J. R. Long, Angew. Chem., Int. Ed., 2010, 49, 6058–6082 CrossRef PubMed.
- Z. Liang, W. Rongwong, H. Liu, K. Fu, H. Gao, F. Cao, R. Zhang, T. Sema, A. Henni, K. Sumon, D. Nath, D. Gelowitz, W. Srisang, C. Saiwan, A. Benamord, M. Al-Marrid, H. Shi, T. Supap, C. Chan, Q. Zhou, M. Abu-Zahra, M. Wilson, W. Olson, R. Idem and P. Tontiwachwuthikul, Int. J. Greenhouse Gas Control, 2015, 40, 26–54 CrossRef CAS.
- H. M. Stowe and G. S. Hwang, Ind. Eng. Chem. Res., 2017, 56, 6887–6899 CrossRef CAS.
- X. Yang, R. J. Rees, W. Conway, G. Puxty, Q. Yang and D. A. Winkler, Chem. Rev., 2017, 117, 9524–9593 CrossRef CAS PubMed.
- F. Moosavi, F. Abdollahi and M. Razmkhah, Int. J. Greenhouse Gas Control, 2015, 37, 158–169 CrossRef CAS.
- Y. S. Yu, H. F. Lu, G. X. Wang, Z. X. Zhang and V. Rudolph, J. Chem. Eng. Data, 2013, 58, 1429–1439 CrossRef CAS.
- Y. H. Jhon, J. G. Shim, J. H. Kim, J. H. Lee, K. R. Jang and J. Kim, J. Phys. Chem. A, 2010, 114, 12907–12913 CrossRef CAS PubMed.
- L. V. H. M. Stowe, E. Paek and G. S. Hwang, Phys. Chem. Chem. Phys., 2015, 17, 29184–29192 RSC.
- E. F. Da Silva, T. Kuznetsova, B. Kvamme and K. M. Merz Jr, J. Phys. Chem. B, 2007, 111, 3695–3703 CrossRef CAS PubMed.
- S. A.-I. M. Narimani and H. Modarress, J. Nat. Gas Sci. Eng., 2017, 47, 154–166 CrossRef.
- I. S. Huang, J. J. Li and M. K. Tsai, Molecules, 2017, 22, 8 CrossRef PubMed.
- S. M. Melnikov and M. Stein, J. Phys. Chem. B, 2018, 122, 2769–2778 CrossRef CAS PubMed.
- G. A. Orozco, V. Lachet and A. D. Mackie, Mol. Simul., 2014, 40, 123–133 CrossRef CAS.
- A. V. Gubskaya and P. G. Kusalik, J. Phys. Chem. A, 2004, 108, 7165–7178 CrossRef CAS.
- S. M. Melnikov and M. Stein, ACS Sustainable Chem. Eng., 2019, 7, 1028–1037 CrossRef CAS.
- Q. Chen, S. P. Balaji, M. Ramdin, J. J. Gutiérrez-Sevillano, A. Bardow, E. Goetheer and T. J. H. Vlugt, Ind. Eng. Chem. Res., 2014, 53, 18081–18090 CrossRef CAS.
- K. R. Putta, H. Knuutila and H. F. Svendsen, Energy Procedia, 2014, 114, 1576–1583 CrossRef.
- M. E. T. Sema, A. Naami, R. Idem and P. Tontiwachwuthikul, Ind. Eng. Chem. Res., 2012, 51, 925–930 CrossRef.
- M. Afkhamipour and M. Mofarahi, RSC Adv., 2017, 7, 17857–17872 RSC.
- A. I. Papadopoulos, S. Badr, A. Chremos, E. Forte, T. Zarogiannis, P. Seferlis, S. Papadokonstantakis, A. Galindo, G. Jackson and C. S. Adjiman, Mol. Syst. Des. Eng., 2016, 1, 313–334 RSC.
- D. E. Penny and T. J. Ritter, J. Chem. Soc., Perkin Trans. 1, 1983, 2103 CAS.
- A. G. H. Wee, G.-J. Fan, R. Idem and P. Tontiwachwuthikul, Ind. Eng. Chem. Res., 2009, 48, 2717–2720 CrossRef.
- T. L. Donaldson and Y. N. Nguyen, Ind. Eng. Chem. Fundam., 1980, 19, 260–266 CrossRef CAS.
- E. B. Rinker, S. A. Sami and O. C. Sandall, Chem. Eng. Sci., 1995, 50, 755–768 CrossRef CAS.
- S. Meesattham, P. Charoensiritanasin, S. Ongwattanakul, Z. Liang, P. Tontiwachwuthikul and T. Sema, Petroleum, 2019 DOI:10.1016/j.petlm.2018.09.005.
- T. Sema, A. Naami, R. Idem and P. Tontiwachwuthikul, Ind. Eng. Chem. Res., 2011, 50, 14008–14015 CrossRef CAS.
- M. Afkhamipour and M. Mofarahi, J. Cleaner Prod., 2018, 171, 234–249 CrossRef CAS.
- W. L. Jorgensen, D. S. Maxwell and J. Tirado-Rives, J. Am. Chem. Soc., 1996, 118, 11225–11236 CrossRef CAS.
- H. J. C. Berendsen, J. R. Grigera and T. P. Straatsma, J. Phys. Chem., 1987, 91, 6269–6271 CrossRef CAS.
- J. I. Siepmann and J. J. Potoff, AIChE J., 2001, 47, 1676–1682 CrossRef.
- A. D. Bochevarov, E. Harder, T. F. Hughes, J. R. Greenwood, D. A. Braden, D. M. Philipp, D. Rinaldo, M. D. Halls, J. Zhang and R. A. Friesner, Int. J. Quantum Chem., 2013, 113, 2110–2142 CrossRef CAS.
- Y. Zhao and D. G. Truhlar, Theor. Chem. Acc., 2008, 120, 215–241 Search PubMed.
- A. V. Marenich, R. M. Olson, C. P. Kelly, C. J. Cramer and D. G. Truhlar, J. Chem. Theory Comput., 2007, 3, 2011–2033 CrossRef CAS PubMed.
- R. M. Olson, A. V. Marenich, C. J. Cramer and D. G. Truhlar, J. Chem. Theory Comput., 2007, 3, 2046–2054 CrossRef CAS PubMed.
- M. J. Abraham, T. Murtola, R. Schulz, S. Páll, J. C. Smith, B. Hess and E. Lindah, SoftwareX, 2015, 1-2, 19–25 CrossRef.
- S. M. Melnikov, A. Höltzel, A. Seidel-Morgenstern and U. Tallarek, J. Phys. Chem. C, 2016, 120, 13126–13138 CrossRef CAS.
- B. Hess, J. Chem. Phys., 2002, 116, 209–217 CrossRef CAS.
- A. L. Kohl and R. B. Nielsen, in Gas Purification, ed. A. L. Kohl and R. B. Nielsen, Gulf Professional Publishing, Houston, 5th edn, 1997, pp. 40–186 Search PubMed.
- W. Böttinger, M. Maiwald and H. Hasse, Fluid Phase Equilib., 2007, 263, 131–143 CrossRef.
- H. Shi, T. Sema, A. Naami, Z. Liang, R. Idem and P. Tontiwachwuthikul, Ind. Eng. Chem. Res., 2012, 51, 8608–8615 CrossRef CAS.
- T. G. Amundsen, L. E. Øi and D. A. Eimer, J. Chem. Eng. Data, 2009, 54, 3096–3100 CrossRef CAS.
- F. Pouryousefi, R. Idem, T. Supap and P. Tontiwachwuthikul, Ind. Eng. Chem. Res., 2016, 55, 11614–11621 CrossRef CAS.
- J. L. Abascal and C. Vega, J. Chem. Phys., 2005, 123, 234505 CrossRef CAS PubMed.
Footnote |
| † Electronic supplementary information (ESI) available: Details of molecular dynamics system set-up and detailed analyses of liquid structures of mixed reacted alkanolamine/water/carbon dioxide systems. See DOI: 10.1039/c9cp03976g |
| This journal is © the Owner Societies 2019 |

