 Open Access Article
Photo-catalytic hydrogen production over Au/g-C3N4: effect of gold particle dispersion and morphology†
M.
Caux
a,
H.
Menard
b,
Y. M.
AlSalik
c,
J. T. S.
Irvine
 *a and
H.
Idriss
 *c
*c
aSchool of Chemistry, University of St Andrews, St Andrews, UK. E-mail: jtsi@st-andrews.ac.uk
bLeverhulme Research Centre for Forensic Science, University of Dundee, Dundee, UK
cSABIC-Corporate Research and Development (CRD), KAUST, Thuwal, Saudi Arabia. E-mail: idrissh@sabic.com
First published on 28th June 2019
Abstract
Metal/semiconductor interactions affect electron transfer rates and this is central to photocatalytic hydrogen ion reduction. While this interaction has been studied in great detail on metal oxide semiconductors, not much is known of Au particles on top of polymeric semiconductors. The effects of gold nanoparticle size and dispersion on top of g-C3N4 were studied by core and valence level spectroscopy and transmission electron microscopy in addition to catalytic tests. The as-prepared, non-calcined catalysts displayed Au particles with uniform dimension (mean particle size = 1.8 nm) and multiple electronic states: XPS Au 4f7/2 lines at 84.9 and 87.1 eV (each with a spin–orbit splitting of 3.6–3.7 eV). These particles, which did not show localized surface plasmon resonance (LSPR), before the reaction, doubled in size after the reaction giving a pronounced LSPR at about 550 nm. The effect of the heating environment on these particles (in air or in H2) was further investigated. While heating in H2 gave Au nanoparticles of different shapes, heating under O2 gave exclusively spherical particles. Similar activity towards photocatalytic hydrogen ion reduction under UV excitation was seen in both cases, however. XPS Au 4f analyses indicated that an increase in deposition time, during catalyst preparation, resulted in an increase in the initial fraction of oxidized gold particles, which were easily reduced under hydrogen. The valence band region for Au/gC3N4 was further studied in an effort to compare it to what is already known for Au/metal oxide semiconductors. A shift of over 2 eV for the Au 5d doublets was noticed between reduced and oxidized gold particles with mean particle sizes between 2 and 6 nm, which is consistent with the final state effect. A narrow range of gold loading for optimal catalytic performance was seen, where it seems that a density of one Au particle per 10 × 10 nm2 is the most suitable. Particle size and shape had a minor effect on performance, which may indicate the absence of a plasmonic effect on the reaction rate.
1. Introduction
The consequences of the emissions of anthropogenic greenhouse gases on the earth's environment, the troposphere and the health of living beings are emerging as one of the important challenges of the 21st century. Among the many strategies to curb these emissions is the so called “hydrogen-based economy”, with the objective to mitigate human dependency on fossil fuels.1 Because most of the hydrogen produced in the world is via methane steam reforming, the possibility of a photocatalytic water splitting method has gained momentum as one of the few routes to sustainable hydrogen production.2–4Graphitic carbon nitride (g-C3N4) is a stable organic polymer possessing a narrow band gap energy (i.e. 2.7–2.8 eV) allowing for a larger fraction of sunlight to be harvested when compared to traditional oxide-based wide band gap semiconductors.5 Pristine g-C3N4 allows hydrogen production in the presence of an electron donor compound.5,6 Using a noble metal such as platinum increases g-C3N4 performance which is commonly rationalized by the formation of a Schottky barrier at the metal/semiconductor interface, thus poised to reduce charge recombination rates.7,8 Other metals such as gold, in addition to their high work function, have localized surface plasmon resonance (LSPR) properties.9,10 LSPR arises from electrons confined at the surface of metallic particles which form collective oscillation (i.e. surface plasmon excitons) under the influence of long-range Coulomb interaction.11 The frequency of these surface waves depends on various parameters such as the size of the metal particles, their shape, and also the dielectric constant of the metal and the surrounding media.9,12,13 When light frequency, in the quasi-static approximation, equals that of the surface plasmon excitons, the resonance condition is fulfilled and light energy is absorbed by the metallic particles.9,14 Various mechanisms have been invoked in the literature rationalizing photocatalytic performance enhancement via LSPR. Upon resonance between surface plasmon excitons and light illumination, unpaired electrons are formed in an excited state. The energy created is suggested to be transferred to the semiconductor, via a direct or indirect charge transfer process, increasing the electron–hole pair concentration.15,16 Plasmon resonance may also improve photocatalytic activity by promoting light absorption; this can be achieved by increasing the average path-length of photons via light scattering and/or by enhancing the local electric field created by surface plasmon excitons.9 The latter may decrease the charge recombination rate on the semiconductor, near the plasmonic nanoparticles. A strong electric field is also expected to locally increase the temperature and may polarize reagents increasing their adsorption probability and stabilizing reaction intermediates.9
The photocatalytic activity of Au/g-C3N4 (alone or as an alloy with Pd or Ag) has previously been studied for multiple reactions such as the reduction of CO2,17,18 oxidation of CO and of benzyl alcohol19 as well as decomposition of organic molecules.20–24 Moreover, photocatalytic hydrogen evolution was investigated over Au/g-C3N425 and Ag–Au alloys synthesized via galvanic exchange26 among other systems. Single atoms of Pt, Pd and Au over 2-D g-C3N4 were studied by DFT; it was found that they narrow the semiconductor band gap. It was also found that Pt and Pd atoms sink into g-C3N4 facilitating charge carrier transfer while Au did not.27 In another work, it was observed that alloying Au with Pt had a more pronounced effect than LSPR of Au when deposited on g-C3N4.28
Au/g-C3N4 photocatalysts are prepared in this work following a deposition–precipitation method, using urea, developed over metal oxide supports.29–31 Samanta et al. have deposited gold nanoparticles on g-C3N4 following this route.32 The authors attributed the enhancement of the photocatalytic performance to gold LSPR. The mechanism of gold nanoparticle formation remains unclear and is likely to differ from that observed on reducible metal oxides such as TiO2. This work intends to further probe into the g-C3N4–gold nanoparticle system and its potential as a photo-catalytic material. This is conducted mainly by studying the effect of parameters controlling the deposition–precipitation route on the composition and morphology of gold nanoparticles and link them to catalytic performance and electronic properties.
2. Experimental
2.1. Synthesis of g-C3N4 from melamine
g-C3N4 was synthesized directly from melamine (99% Sigma Aldrich) via a solid-state thermal polycondensation reaction procedure. The white precursor was heated at 500 °C for 15 h in static air (i.e. heating rate: 5 °C min−1) in an alumina crucible covered with aluminum foil.332.2. Impregnation of gold on g-C3N4 through the deposition–precipitation method using urea (DPU)
A slurry of g-C3N4 (10 g L−1) was prepared in a solution containing HAuCl4·3H2O (50 mL, 99.9% Sigma Aldrich) of 1.07 mM for a 2.1 wt% gold loading and urea (99%, Fisher Scientific) (i.e. from 0 to 0.85 M). The slurry was stirred (500 rpm) at 85 °C for 1, 4, 8, or 16 hours. The slurry was then filtered and washed with 500 mL of deionized water before being dried overnight at 80 °C, forming the as-prepared Au/g-C3N4. A thermal treatment was performed at 300 °C for 1 hour (i.e. heating rate: 5 °C min−1) either in static air, or under a flow of 5 vol% H2 in argon.2.3. Characterization
X-ray diffraction was carried out using a PANalytical Empyrean diffractometer equipped with a Cu radiation source (i.e. CuKα1, λα1 = 1.5406 Å). Data were collected at room temperature.A JASCO V650 spectrophotometer was used for the absorbance of powdered samples, equipped with a 60 mm diameter integrating sphere (ISV-722) allowing diffuse reflectance measurements. Band gap determination was carried out via a Kubelka Munk transform and Tauc plot, using dedicated software (SpectraManager, JASCO).
A JEOL JSM-6700F Scanning Electron Microscope was used in secondary electron (SE) detection mode to assess the coverage of gold nanoparticles on g-C3N4.
TEM micrographs were obtained using a JEOL JEM-2011 Transmission Electron Microscope. The samples were deposited on holey carbon film 300 mesh Cu grids (Agar Scientific). Particle size measurements were manually conducted from the obtained micrographs using the Gatan Microscopy suite software. For each sample, 300 particles were measured.
Gas analysis was performed using a 3000 Micro GC (see Section 2.4 “set-up 1”) and a 7890A GC (see Section 2.4 “set-up 2”) from Agilent technologies. The former uses a molecular sieve for H2 and a PLOT U for CO2 detection whilst a Plot Q is used for both H2 and CO2 in the latter. Both instruments are equipped with TCD detectors.
Kratos Ultra DLD (AXIS) fitted with a monochromated Al Kα (1486.6 eV) X-ray source was used for X-ray photoelectron spectroscopy (XPS) measurements. When necessary, in situ reduction was carried out in a dedicated cell, separated from the measuring chamber (100 vol% H2, 1 atm). Au 4f, C 1s, N 1s and O 1s lines and the valence band were collected and charge corrected against C 1s at 288.3 eV and N 1s at 398.8 eV (see Fig. S1, ESI†), the main characteristic components of g-C3N4.34 The effect of urea concentration on Au deposition was evaluated using a separate UHV system, with a base pressure of 5 × 10⁻¹⁰ mbar, equipped with a SPECS XR50 dual anode X-ray source (Mg Kα was utilized) and a Scienta R3000 hemispherical electrostatic energy analyzer (at SABIC-CRD). Also attached to the chamber was a sputter gun, and separate oxygen and argon gas lines fitted with precision UHV leak valves. Au 4f, C 1s, N 1s, and O 1s lines were collected.
2.4. Photocatalytic testing for hydrogen evolution
The activity of the bare and gold-loaded g-C3N4 for hydrogen evolution was investigated using two different set-ups referred to as “set-up 1” and “set-up 2”.“Set-up 1” consists of a custom-designed reactor made of an aluminum cylindrical body (dinternal = 11.7 cm; Vtotal = 670 cm3) with polytetrafluoroethylene lining to prevent photo-corrosion of the metal. Light irradiation was carried out from the top of the reactor. In a typical run, 100 mg of the catalyst were dispersed in 100 mL (i.e. 1 g L−1) of an aqueous solution of oxalic acid (dihydrate ACS 99.5–102.5% Alfa Aesar), used as an electron donor (i.e. 0.025 M, pH = 1). The reaction was performed under an inert atmosphere using argon in semi-batch mode; sampling of the gas phase was performed every hour allowing H2 and CO2 evolutions to be monitored by gas chromatography. Photocatalyst illumination is carried out using a 250 W iron doped metal halide UV-vis lamp equipped with a UV cut-off filter allowing λ > 380 nm to irradiate the sample. An overall irradiance of 50 mW cm−2 was measured (i.e. photon flux = 2800 μmol m−2 s−1). It is worth noting that heating is provided to the reactor by the light source. Cooling was not used in these experiments and the steady state photocatalytic activity was probed at 85 °C.
“Set-up 2” was used in order to probe the initial reaction rate at room temperature. This second set-up consists of a 140 mL glass reactor in which 5 mg of the catalyst were dispersed in 20 mL of an oxalic acid solution (i.e. 0.025 M). After sonication, the headspace was purged under nitrogen flow. Irradiation was carried out from the side (i.e. 10 cm from the reactor) using a xenon light source (Max 303 Asahi Spectra) fitted with two different band pass filters: 300 to 410 nm (i.e. 6.3 mW cm−2) irradiating only g-C3N4 and 300 to 620 nm (i.e. 44 mW cm−2) irradiating both g-C3N4 and gold nanoparticles. The slurry was stirred at 750 rpm during testing. Every 30 min, a 0.4 mL sample of the headspace gas was manually injected in an Agilent technologies 7890A GC (Plot Q, TCD) in order to evaluate the production of H2 and CO2.
3. Results and discussion
3.1. Gold coverage via deposition–precipitation with urea (DPU)
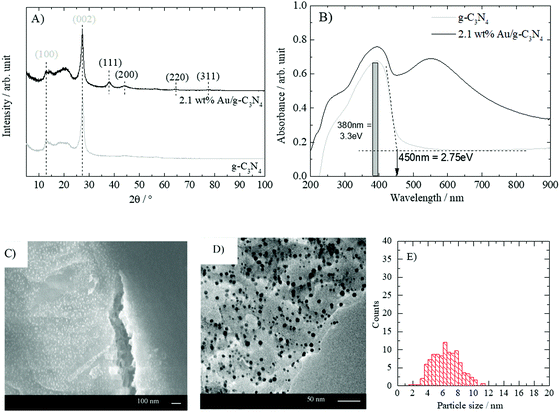
Fig. 1A shows the powder XRD pattern of g-C3N4 and “nominally” 2.1 wt% gold-loaded g-C3N4 (heated in air at 300 °C). The intense diffraction feature of pristine g-C3N4 observed at a 2θ of 27° is assigned to the (002) plane, while the diffraction signal at 2θ of 13° is attributed to the (100) plane. The latter is related to the distance between the tri-s-triazine ring units in the carbon nitride 2D polymer network whilst the former arises from the stacking of the 2D layers.33 The addition of gold nanoparticles did not alter the crystal structure of g-C3N4. However, additional diffraction peaks at 38.0°, 44.1°, 64.5° and 77.5° are observed. These features are respectively assigned to the (111), (200), (220) and (311) planes of gold.32 UV-vis absorbance spectra of g-C3N4 and Au/g-C3N4 are presented in Fig. 1B. The characteristic absorption edge of graphitic carbon nitride is observed with a maximum around 380 nm (3.3 eV) and a band gap around 450 nm (2.75 eV).5 The gold-loaded material displayed the expected characteristic LSPR absorption feature centered on 550 nm corresponding to surface plasmon resonance absorbance.32 The SEM and TEM micrographs presented in Fig. 1C and D display a uniform gold nanoparticle distribution with an average particle size of 5.8 nm. The absence of aggregates together with the uniform particle size and the absorption band around 550 nm shows that DPU is appropriate to grow gold nanoparticles with LSPR absorbance properties on g-C3N4. It is to be noted that the sample after 4 hours of calcination displayed a red shift in its LSPR while it contained the smallest particle size of the series. Such an unusual shift has been seen in the case of Ag nanoparticles and could be well explained by Mie theory upon incorporation of a last layer chemical interaction with the surrounding.34 This may well explain the observations here and points out to the different interaction nature of Au nanoparticles with a polymeric material (C3N4) when compared to ionic oxide supports.3.2. Gold reduction on g-C3N4
The stirring/deposition time of Au was varied from 1 to 16 hours followed by thermal treatment in static air. The absorbance spectra of the various samples are presented in Fig. 2. The intensity of the LPSR absorbance feature is found to decrease with increasing deposition time. The maximum LSPR absorption wavelength did not change except for the “4 hour deposition” sample.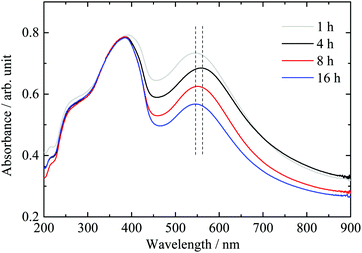 | ||
| Fig. 2 Effect of deposition–precipitation time of gold cations using the DPU method on the UV-vis absorbance spectra of the “nominally” 2.1 wt% Au/g-C3N4 catalyst. | ||
Mean particle sizes extracted from TEM micrographs show that an increase of deposition time from 1 to 4 hours leads to a decrease of the average gold particle size to about half (see Table 1). However, a further increase of deposition time leads to a mean particle size slightly smaller than the initial value. Zanella et al. observed a decrease of the mean gold particle size upon increasing of deposition time on TiO2via the DPU route.31 The authors suggested the slow pH increase induced by hydroxyl ion release upon heating to be responsible for this effect. The change in the surface charge density of gold precursor nanoparticles on the support likely leads to a fragmentation of the particles, therefore decreasing the particle size.31 The result obtained here would agree with that observation, if we do not consider the “4 hour deposition” sample. Our results indicate that one may not extract a direct relationship most likely because the poor crystallinity of g-C3N4 leads to weak interactions between gold and the support, which in turn affects the particle growth.
| Deposition time/hours | Mean particle size/nm | Standard deviation/nm |
|---|---|---|
| 1 | 12.1 | 2.8 |
| 4 | 5.8 | 1.8 |
| 8 | 11.3 | 3.8 |
| 16 | 9.5 | 3.2 |
The thermal treatment step performed in static air aimed to reduce the gold precursor to gold metal. To monitor this we have performed XPS core level measurements of Au 4f as well as valence band measurements for Au 5d. XP spectra of carbon and nitrogen are in line with literature findings7 (see Fig. S1, ESI†). The results are presented in Fig. 3 and 4 for all samples. Fig. 3A presents the Au 4f of the 16 hour sample (thermal treatment in static air) as well as the same sample after hydrogen reduction inside the UHV chamber of the spectrometer. The 16 hour sample displays a XPS Au 4f spectrum consisting of two doublets: one at 83.6 eV and 87.2 eV (ΔE = 3.6 eV) and one at 84.6 eV and 88.3 eV (ΔE = 3.7 eV). The first doublet is attributed to metallic Au35–37 and the second to Au in a higher oxidation state (the doublet at 84.6–88.3 eV is not assigned to gold chloride since no Cl 1s contribution was detected). To further study these lines, we have reduced the sample with hydrogen inside the UHV chamber at 300 °C for one hour. The corresponding O 1s of the sample is presented in Fig. 3B. The asymmetric peak at about 532 eV (O 1s) is composed of a contribution from both surface hydroxyls (ca. 531.3 eV) and irreversibly adsorbed water molecules (ca. 532.5 eV), before reduction. Part of the signal may be related to a gold oxide or hydroxide responsible for the Au 4f7/2 peak at 84.6 eV. After reduction, there is no evidence for O 1s lines, in line with the reduction of Aux+ cations to metallic Au. Fig. 3C presents the Au 4f of the complete series where Au deposition was conducted from 1 to 16 hours. After one-hour deposition, most Au was deposited in a metallic form. The gradual appearance of Aux+ with increasing time is evidence of oxide formation on top of g-C3N4. This is in sharp contrast with Au deposition over reducible oxide such as TiO238,39 and CeO236 and similar to that observed over nonreducible oxides such as SiO2.36,40Fig. 3D presents the computed ratio of Au over the total C and N from their XPS C 1s and N 1s as well as the ratio of Aux+ to metallic Au.
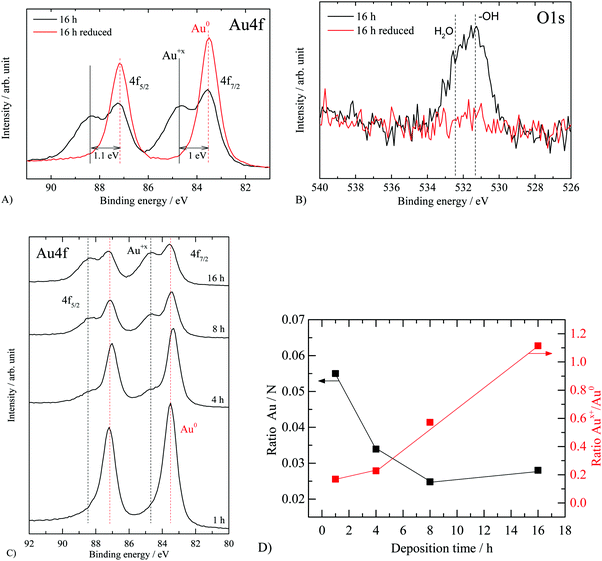 | ||
| Fig. 3 XP spectra of “nominally” 2.1 wt% Au/g-C3N4 before and after reduction. (A) Au 4f before and after in situ hydrogen reduction, (B) O 1s before and after in situ hydrogen reduction and (C) XPS Au 4f for the complete series, (D) the atomic ratios of Au/N and Aux+/Au0 for the studied series as a function of deposition time. Energy calibration based on C 1s and N 1s main components (see Fig. S1, ESI†). | ||
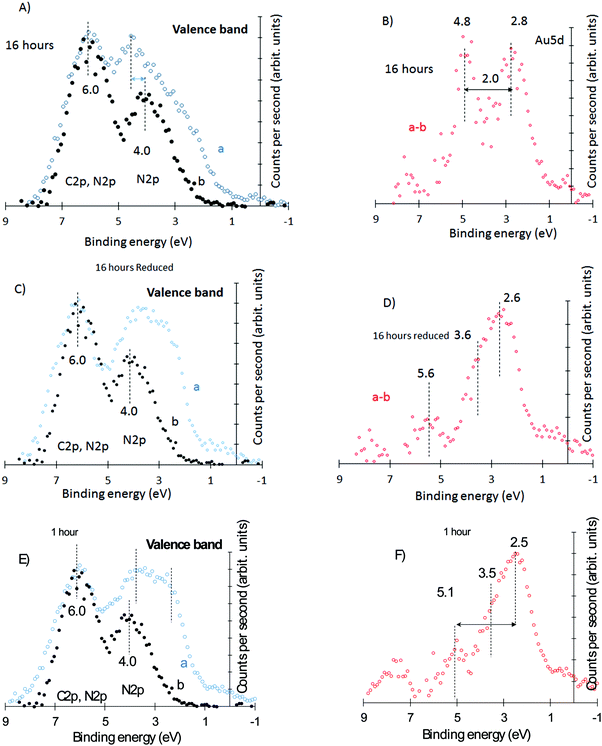
To further probe into the Au behavior over g-C3N4, we have monitored the 5d–6s region by XPS. Au 5d region has been studied in great detail in numerous works. Briefly, the 5d and 6s binding energy positions and shape depend on the particle size and crystallographic direction.41–48 The 6s is at the Fermi level while the 5d5/2 is located about 3–4 eV below. The Au 5d5/2,3/2 shape is convoluted and has contributions from higher to lower binding energies of 5d96s 1D2, 5d96s 3D1, 5d96s 3D2, and 5d96s 3D3.41 Fig. S2A (ESI†) presents the XPS valence band of polycrystalline Au while Fig. S2B, (ESI†) presents the corresponding UPS. There is a complex 5d5/2 structure centered at about 3 eV (XPS) and separated from the 5d3/2 by about ΔE = 2.6 eV, in line with numerous reports.41–48 The separation ΔE is a function of the particle (cluster) size, and it increases with increasing size due to the d–d interaction.47 The 5d structure and position also change with the oxidation state of Au.49 The valence band of g-C3N4 is composed of N 2p and C 2p.50 Experimentally there are two large structures centered at about 4 and 6 eV. The first one is dominated by the two different N atoms of g-C3N4 while the second arises from the hybridization between the C 2p and N 2p orbitals.50
Fig. 4A presents the g-C3N4 valence band region together with that of Au/g-C3N4 (16 hours), the most oxidized Au sample based on the XPS Au 4f lines of Fig. 3.
Fig. 4A presents the subtracted spectrum after background subtraction and being signal-normalized at 6 eV. It is clear that the region at 4 eV and below has additional contribution due to gold. The difference between both spectra presented in Fig. 4B shows two peaks at 2.7 and 4.8 eV attributed to the Au 5d doublet. Based on XPS Au 4f these structures have about equal contribution from Au0 and Aux+ (the escape depth, λ, of the photoelectron is about the same (2.5 nm) for both Au 4f and Au 5d). Fig. 4C compares the same g-C3N4 with that of the in situ reduced Au/g-C3N4 of Fig. 4A while Fig. 4D gives the subtracted spectrum. The considerable shift of the first peak to lower binding energy is obvious and is therefore linked to the reduction of Au cations to metallic gold. It is important to note that the same sample showed no O 1s lines after reduction but some contribution before reduction. In other words, there is no O 2p contribution in the C 2p signal after reduction but there is some before reduction. The subtracted spectrum shows a structure closer to that of metallic gold. The weak 5d3/2 contribution is most likely related to the overestimation of the C 2p/N 2p contribution before subtraction due to the presence of O 2p lines. Further data collected for the 1, 4 and 8 hour deposited samples are in line with these observations. For example, the 1 hour deposited sample (where Au atoms are mostly in their metallic state) gives a very similar valence band structure to that of the reduced 16 hour deposited sample. This is presented in Fig. 4E and F; note the similarity of the subtracted spectra presented in Fig. 4D and F. Other spectra of intermediate heating (4 hours and 8 hours) are presented in Fig. S3 (ESI†).
The electronic properties of gold over g-C3N4 are therefore different from those reported over reducible oxides such as TiO2, CeO2, ZnO or In2O3.30,31,51,52 The interaction between gold and g-C3N4 is most likely the reason and is more akin to that of non-reducible oxides; in other words much weaker metal support interaction because of the considerably more covalent nature of the carbon nitride system when compared to more ionic oxide compounds in general.
In light of the previous observations, an oxide shell surrounding a gold metal core was expected to be observed. However, STEM imaging of gold nanoparticles grown on the g-C3N4 surface did not present evidence of two different phases. Gold oxide or hydroxide species are reported to be unstable deriving from the expected good reducibility of gold.53,54 It is therefore probable that Aux+ decomposes under the electron beam during imaging. The oxidation of Au particles with deposition time may be rationalized by the presence of oxygen in the flask headspace used during DPU coupled with the high stirring speed (i.e. 500 rpm). The equilibrium concentration of molecular oxygen in water is about 6.44 × 10⁻⁴ mol L−1, which is comparable to the concentration of gold used in the experiment (1.07 × 10⁻³ mol L−1). O2 diffusion in water is slow with diffusion constants typically between 10-4 and 10−5 cm s−2 depending on the temperature. The quantity of O2 dissolved is therefore bound to increase with time under the high stirring speed used during the experiment. The above results based on TEM, core, and valence level spectroscopy indicate that the deposition time affects the mean particle size as well as the fraction of oxidized gold atoms. While a clear cut observation was seen for gold oxidation states (Fig. 3D, 4 and Fig. S3, ESI†) where increasing deposition time has resulted in increasing Aux+ fraction, changes in the mean particle size were not linear. The size has initially decreased with increasing deposition time then increased again. This is due to multiple effects including the changes in the crystallinity of C3N4 with deposition time that in turn affects the strength of its interaction with gold particles.
The “nominally” 2.1 wt% Au/g-C3N4 photocatalysts prepared with various deposition times were tested for hydrogen evolution in the presence of oxalic acid (see Fig. 5). In the photocatalytic experiments reported in this work, carbon dioxide evolution was observed along with the formation of hydrogen with a CO2![[thin space (1/6-em)]](https://www.rsc.org/images/entities/char_2009.gif) :
:![[thin space (1/6-em)]](https://www.rsc.org/images/entities/char_2009.gif) H2 ratio of around 2. This result is ascribed to the photo-degradation of oxalic acid.6 Both gases follow very similar trends, therefore only hydrogen evolution is presented here. Bare g-C3N4 is marginally active for hydrogen evolution. Au deposition resulted in increasing the activity 10- to 27-fold. The effect of metal deposition on the semiconductor activity for hydrogen production has been reported numerous times with various photocatalysts/metal systems, and is generally assigned to transfer of electrons from the semiconductor to the metal and in some cases to providing centers for hydrogen–hydrogen bond formation.55–57 In the case of gold, LSPR properties may also play a role in promoting photocatalytic hydrogen evolution.9,12
H2 ratio of around 2. This result is ascribed to the photo-degradation of oxalic acid.6 Both gases follow very similar trends, therefore only hydrogen evolution is presented here. Bare g-C3N4 is marginally active for hydrogen evolution. Au deposition resulted in increasing the activity 10- to 27-fold. The effect of metal deposition on the semiconductor activity for hydrogen production has been reported numerous times with various photocatalysts/metal systems, and is generally assigned to transfer of electrons from the semiconductor to the metal and in some cases to providing centers for hydrogen–hydrogen bond formation.55–57 In the case of gold, LSPR properties may also play a role in promoting photocatalytic hydrogen evolution.9,12
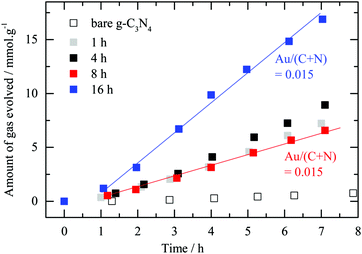 | ||
| Fig. 5 Photocatalytic hydrogen evolution for various deposition times. Amount of hydrogen evolved in the presence of oxalic acid as an electron donor (i.e. 0.025 M) against testing time for bare g-C3N4 and a nominally 2.1 wt% Au/g-C3N4 prepared at different deposition times. “Set-up 1” was used for this series of experiments. It is worth noting that while the 8 hour and 16 hour samples have the same amount of surface and near surface Au they have different rates. Fig. 3 indicates that the 16 hour sample has considerably more Aux+ in addition to metallic Au than all other samples. | ||
As observed in Fig. 5, there is no correlation between the deposition time (nor the amount of surface Au ones extracted from the XPS Au4f signal). The interaction between Au nanoparticles and the semiconductor C3N4 is complex and may not be understood based on XPS, TEM, and photoreaction results alone. One can see some induction in the beginning of the experiment where up to one hour or so all catalysts had similar rates. It is most likely that by then, for all catalysts, a large fraction of Aux+ has been in situ reduced to metallic gold. There might be however an optimal concentration for Au on top of C3N4 in the same way this has been for many metals on top of TiO2 (Pt;58–60 Pd;38 Au;61–63 Au–Pd;64 Cu;65 Ni66).
The amount of surface Au for the 8 hour and 16 hour samples is very similar yet the reaction rate is double for the 16 hour one. The only difference between these two materials lies in the ratio between the two gold oxidation states (i.e. respectively 0.57 and 1.11) before the reaction. The 16 hour sample possesses a higher Aux+ proportion compared to the 8 hour one. This result suggests the presence of the second gold oxidation state to enhance the photocatalytic performance of Au/g-C3N4 towards hydrogen evolution in the presence of oxalic acid. As the reduced form of the metal is commonly considered as the active phase acting as a co-catalyst in the photocatalytic system, the aforementioned observation was not expected.56,67 One may link this to some type of heterojunction between a shell composed of Au cations and a core composed of Au atoms, which in turn may reduce the charge carrier recombination rate. In other words, in the absence of such a heterojunction, excited electrons that are trapped within gold particles (at the nanosecond scale) may have time to leak back into the semiconductor and recombine with holes since the hydrogen ion reduction occurs at many orders of magnitudes slower than the trapping process. Hot electron injection from Au particles into the conduction band of C3N4 has recently been measured by transient absorption spectroscopy with a time scale in the picosecond range.68 It is also possible that the binding modes and therefore the strength of oxalic acid, at the Au nanoparticle/C3N4 interface, change with a change in the oxidation state of Au. Aux+ cations would favor dissociatively adsorbed oxalic acid (oxalate species) because of a stronger electrostatic interaction between positively charged gold cations and negatively charged oxalate anions, which would result in a higher population density on the surface that in turn would increase the reaction rate.
3.3. Gold particle size and shape
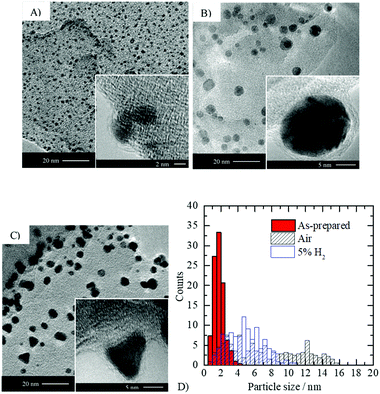 | ||
| Fig. 6 Effect of thermal treatment on the shape and size of gold particles. TEM imaging of 2.1 wt% Au/g-C3N4 (4 hours): (A) as-prepared (before thermal treatment), (B) after thermal treatment in static air and (C) after reduction with 5 vol% H2 in argon. (D) Particle size distribution extracted from TEM micrographs (see Table S1 for mean particle sizes, ESI†). | ||
Calcination of the as-prepared sample leads to the formation of gold nanoparticles possessing typically a rounded morphology with a larger mean diameter compared to the as-prepared Au/g-C3N4 (i.e. 5.8 ± 1.8 nm). In contrast, thermal treatment under hydrogen formed multi-faceted non-spherical gold nanoparticles with a wide variety of morphologies; the most striking of them are the triangular shaped ones (see Fig. 6C and Fig. S4, ESI†). In both cases, gold metal (d(111) = 0.23–0.24 nm) was identified via HRTEM imaging. The particle size distribution obtained after reduction is narrower than that obtained upon calcination, and has shifted towards lower sizes (mean particle size = 4.8 nm); Fig. 6D. The thermodynamic equilibrium of a metal bearing an fcc crystal structure corresponds to a compromise between the lowest surface energy facet (111) and surface area minimization. Therefore, in the case of gold, truncated tetrahedra are expected to be the thermodynamically stable morphology69 which is in line with observations after thermal treatment in static air (see inset Fig. 6B). Oxygen adsorption on the gold surface during calcination may slow down the reduction process compared to thermal treatment under 5 vol% H2 in argon. The particle shape obtained after calcination may result from thermodynamic equilibrium, whilst under a reducing atmosphere morphologies out of equilibrium are obtained. No epitaxial relationship was found between g-C3N4 and gold nanoparticles, which likely originates from the poor crystallinity and the important defect concentration of the semiconductor. The various morphologies obtained are probably linked to the amorphous character of g-C3N4, as no such observation is reported in the literature upon depositing gold nanoparticles on metal oxides such as TiO2, ZnO or CeO2.31,37,62 In the latter, gold nanoparticles are usually well-anchored resulting in the formation of semi-spherical morphologies.
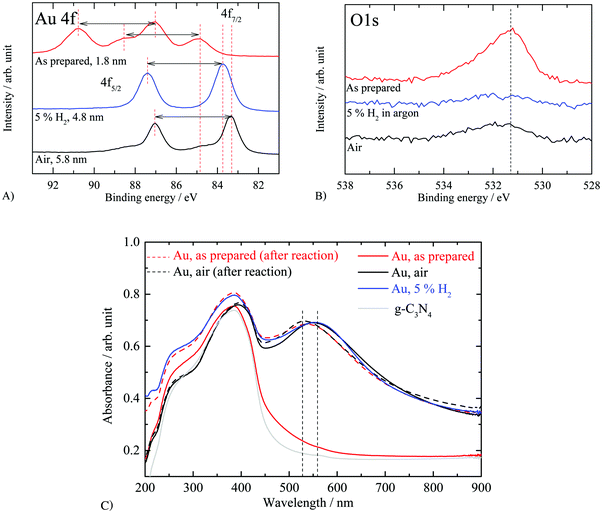
XPS measurements were conducted to investigate the effect of thermal treatment on the oxidation state of gold nanoparticles. Fig. 7A, B and C respectively compare the Au 4f, O 1s and the corresponding UV-vis absorption spectra of the calcined Au/g-C3N4 (see Fig. 4), the as-prepared, and reduced catalysts; binding energies are gathered in Table 2. XPS Au 4f displays different binding energy positions for Au. The observed positions are not due to the charging effect since the C 1s, N 1s and the valence band positions were at their usual positions. Upon reduction with hydrogen, the binding energy positions and spin–orbit splitting show the expected values for metallic gold (i.e. Au 4f7/2 at 83.7 eV). Before thermal treatment, two doublets are observed in the Au 4f region (i.e. Au 4f7/2 at 84.9 and 87.1 eV) at binding energies significantly different from the two doublets observed on the calcined Au/g-C3N4 (i.e. Au 4f7/2; 83.3 and 84.8 eV). The small particle size obtained for the as-prepared sample may induce a shift in binding energy as reported by Ohgi et al.70 The authors observed an Au 4f core level shift of +0.6 eV upon a decrease of particle size from 1.4 to 0.4 nm. However, the particle size effect is most likely not the only contributing factor for the large observed shift. The Au 4f7/2 contribution at 84.9 eV may be attributed to Au2O3 (i.e. 85.0 eV71) while the higher binding energy peak (i.e. Au 4f7/2 at 87.1 eV) may arise from a gold hydroxide such as Au2(OH)3 (i.e. 86.9 eV71) and/or a gold chloride (i.e. 87.1–87.3 eV35). The presence of a weak peak at ca. 199 eV assigned to Cl 2p (i.e. 0.13 at%) suggests the presence of a gold chloride species (see Fig. S5, ESI†); this peak disappears upon calcination. Thus, the shift by about 0.8 eV might be related to the particle size effect and Au cations of an oxide layer, while the higher binding energy position at about 87 eV (Au 4f7/2) could be attributed to the ligand effect (Cl, and OH groups).
| Thermal treatment | Au at% | Au 4f binding energy (eV) | ||
|---|---|---|---|---|
| Au 4f7/2 (FWMH) | Au 4f5/2 (FWMH) | Spin–orbit splitting | ||
| None | 3.5 | 84.9 (1.4) | 88.6 (1.4) | 3.7 |
| 87.1 (1.4) | 90.7 (1.4) | 3.6 | ||
| Static air | 1.9 | 83.3 (0.8) | 87.0 (0.8) | 3.7 |
| 84.8 (1.4) | 88.4 (1.5) | 3.6 | ||
| 5 vol% H2 in argon | 2.3 | 83.7 (0.9) | 87.4 (0.9) | 3.7 |
The absorbance spectrum of the as-prepared Au/g-C3N4 is compared to those of the catalysts calcined in air and reduced in 5 vol% H2 in argon (see Fig. 7C; full lines). Although the gold nanoparticles formed on the as-prepared sample show a very homogeneous particle size, no LSPR absorption band can be observed. Two reasons might be behind the lack of LSPR: either gold is not present in its metallic form or it is due to the particle size effect. The discrete energy levels for gold particles with diameter below 2 nm do not give rise to LSPR (i.e. 1.78 ± 0.6 nm).14,72 Inspection of Fig. 6D indicates that about a third of the particle with a mean diameter of 1.78 nm are above 2 nm. It is noted that the LSPR of the calcined Au after the reaction has shifted to lower wavelengths (higher energy) by about 40 nm (ca. 0.2 eV) when compared to the as-prepared one. The post-testing as-prepared sample was found to have a mean particle size of 3.06 ± 2 nm which is above the 2 nm threshold under which the quantum size effect prevents LSPR absorbance.14 This is in line with the observed UV-vis results where before the reaction no LSPR was noticed. In both cases, it seems that changes occur for Au particles irrespective of the initial composition with some kind of thermodynamic equilibrium between Au particles and the surface of g-C3N4 dictated by the reaction parameters.
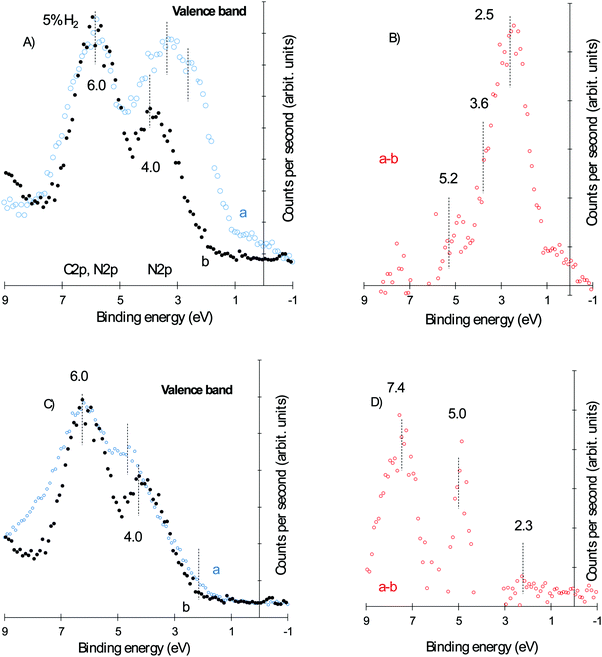
Fig. 8 presents the valence band of the three catalysts together with that of g-C3N4. Fig. 8A displays the spectrum for the hydrogen reduced Au/g-C3N4 and g-C3N4 and Fig. 8B the subtracted spectra after normalization at 6 eV. Very similar spectra to those reported in Fig. 4C and D are obtained both for the raw data and those subtracted to highlight the presence of metallic gold. A considerable difference is however observed in the case of the “as-prepared” catalyst, that has small Au particle size and narrow size distribution; Fig. 8C. This is best highlighted in the subtracted spectra, Fig. 8D. It is worth indicating that spectra of both g-C3N4 and the “as-prepared” Au/g-C3N4 display very close leading edge, which further confirms that the shift in the core level (Au 4f) is not due to charging. The subtracted spectrum shows two clear positive peaks at about 5 and 8 eV. These cannot be due to small particles of Au since particles of similar sizes have been studied with their 5d lines at about 2 eV lower than the observed ones here. One can then infer that the large shift in the Au 4f is due to small Au particles in contact with a strong electron-withdrawing group such as chlorine left over from the Au precursor and that under the electron gun of the TEM these small Au clusters are reduced to metallic gold.
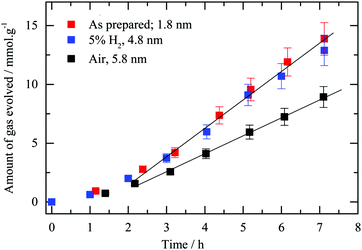
Fig. 9 presents hydrogen production using the testing apparatus referred to as “set-up 1” (see Section 2.4) in the presence of oxalic acid as an electron donor. Initially the three samples had similar reaction rates yet deviations after about 2 hours occurred and the hydrogen reduced sample as well as the “as-prepared” one showed a better performance than the calcined one, the steady state evolution rate reaching 2.3 ± 0.1 and 1.6 ± 0.1 mmol h−1 g−1, respectively. The multi-faceted shapes observed after reduction may be linked to a better rate when compared to that heated in air, and the electric field is enhanced at the corners and edges of metallic particles.73–75 A more intense electric field is likely to prevent recombination of photo-induced charges, therefore leads to better photocatalytic performance.9 As presented in Table 2, Au at% obtained from XPS measurements is 3.5 for the as-prepared sample whilst for the calcined and reduced gold loaded g-C3N4 it was 1.9 and 2.3 respectively. The as-prepared sample displays a similar activity to the reduced Au/g-C3N4 with a steady state evolution rate of 2.6 mmol h−1 g−1. The atomic% difference in gold content might be due to the particle size effect (escape depth) of the photoelectron where for larger particles (>3 nm or so) attenuation of the signal may occur.
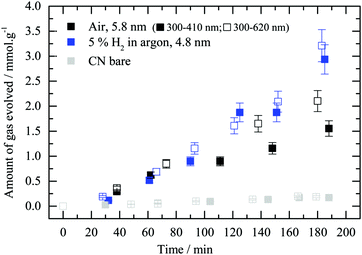
In order to see into the effect of LSPR on the reaction the photocatalytic performance was also studied under different light frequencies. The work is conducted in “set-up 2” where the catalysts are dispersed in solution inside a batch reaction. Under these conditions, the reaction temperature is near ambient and the main change in the parameters is expected to be in the light frequency distribution. Au/g-C3N4 samples obtained after thermal treatment in air or 5 vol% H2 in argon were probed. Irradiation of the catalysts with two different wavelength ranges matching the absorbance of bare g-C3N4 and Au/g-C3N4 (i.e. respectively 300 to 410 nm and 300 to 620 nm) was conducted (Fig. 10). This experiment was designed to gain insight into the charge transfer processes occurring between gold nanoparticles and the semiconductor. Au/g-C3N4 reduced in 5 vol% H2 in argon did not show a performance enhancement upon irradiation between 300 and 620 nm. However, the calcined Au/g-C3N4 photocatalyst displays a higher hydrogen evolution activity when the illumination covers both g-C3N4 and gold LSPR absorbance ranges rather than only g-C3N4. This result may indicate that gold LSPR properties are involved in the formation of hydrogen on Au/g-C3N4 in the presence of oxalic acid for particles with a mean dimension of 5.8 nm. In situ reduction, accelerated by gold LSPR of the fraction of Au cations within Au particles might also contribute to the enhancement of the reaction rate. It is worth indicating that a non-negligible fraction of the gold in this catalyst have dimensions above 10 nm where LSPR would be expected to be more pronounced. The difference between the two experiments might be related to the gold particle size distribution. It is therefore not possible to draw clear-cut conclusions from these experiments since both the particle size and surface coverage are different.
 | ||
| Fig. 11 Effect of urea concentration on 2.1 wt% Au/g-C3N4 gold nanoparticle size and coverage. TEM micrographs of 2.1 wt% Au/g-C3N4 (4 hours) after thermal treatment in 5 vol% H2 in argon prepared with different urea concentrations during the deposition–precipitation process: (A) 0 M, (B) 0.25 M, (C) 0.42 M and (D) 0.85 M. See Table S2 (ESI†) for mean particle sizes and densities. | ||
The TEM micrographs of Fig. 11 shows the importance of urea concentration in determining both the dispersion and shape of Au nanoparticles on g-C3N4. It is worth mentioning that Zanella et al. reported the isolation of an orange precipitate arising from a reaction between HAuCl4 and urea or one of its decomposition products.31 The authors did not report its structure, however. Previous observations suggest that complexation of chloroauric acid with urea affects the interaction of the gold precursor with the g-C3N4 surface. As urea hydrolysis releases hydroxyl ions, a higher concentration of urea is poised to increase the pH more rapidly compared to a lower concentration. The variety of multi-faceted shapes observed in Fig. 11C and D may therefore result from a fast increase of pH. Morphologies out of equilibrium are more likely to be formed under a kinetic than thermodynamic control. Both urea concentration and thermal treatment in a reducing atmosphere lead to a kinetic control of the shape of gold nanoparticles on g-C3N4.
XPS measurements of this series were also conducted (see Table S2, ESI†). The atomic percentage of gold ranged from 0.3 to 2.6 at% for a urea concentration between 0 and 0.85 M. Coupled with TEM, observation of these XPS measurements show that urea concentration is critical for the deposition–precipitation method as it directly affects the gold deposition yield.
Fig. 12 presents three plots for the Au/g-C3N4 series deposited by different urea concentrations. The first, Fig. 12A, shows an expected reasonable linear relationship between the particle density (per 100 nm2) and their atomic% as determined from Au 4f XPS. This is in particular valid because the mean particle dimension is within the escape depth associated with the Au 4f photoelectron kinetic energy. Fig. 12B presents the photocatalytic study of the same series. The activity at the initial reaction time is very weak, then picks up after about one hour. Hydrogen production for the smallest amount of gold (0.3 at%) was the weakest (green line, 0.46 mmol gcatal−1 h−1); increasing the amounts of gold did increase the reaction non-linearly. For a better comparison the reaction rate was divided by the atomic% of Au (as a normalization per atomic gold) – this is valid because the small size of Au particles makes it possible to quantitatively know their concentration. The normalized rate plotted as a function of Au atomic%, again, would therefore indicate the intrinsic activity per atom of gold irrespective of its content. One can see that there is a coverage of Au where collectively all particles have an optimal performance, Fig. 12C, after which the rate decreases. This appears to be the case for 0.6 wt% Au. Because the particle size is not too different for the four catalysts in the figure one may link the difference in activity to particle density or more precisely to the inter-particle spacing. In the inset of Fig. 12C, a schematic of the particle density of this catalyst is given. One may thus, link the performance to the diffusion length of excited electrons within g-C3N4. While we do not know this number, a 10 nm length is within the expected numbers for wide band gap semiconductors.76 It appears that while one needs Au particles to trap electrons, too many of them results in a competition with each other which may then decrease their collective performance. It is worth noting that similar observations have been made by others77–79 and a few interpretations were given; in addition to competition for electrons, increasing of surface defects at the interface of the metal and support, and increasing light scattering were also invoked as possible reasons for the nonlinear behavior.
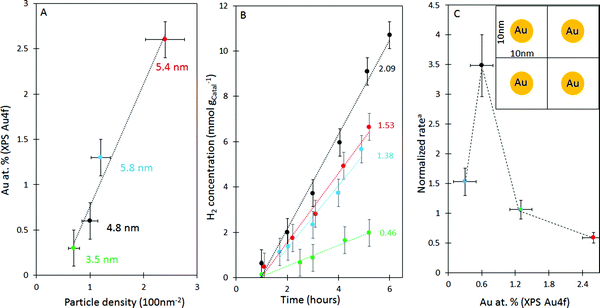 | ||
| Fig. 12 Effect of urea concentration on Au deposition on g-C3N4. (A) Relationship between Au atomic% (XPS) and particle density (TEM). (B) Photocatalytic hydrogen evolution of Au/g-C3N4 prepared with various urea concentrations followed by reduction in 5 vol% H2 in argon; the reaction rate in units of mmol gcatal−1 h−1 is given beside each line (with the colour matching that of (A). (C) Normalised reaction ratea (in mmol h−1 gCatal−1/Au atomic% (XPS)) as a function of Au atomic%. The inset in (C) represents gold particle density = 1 particle per 100 nm2. More data are presented in ESI,† Table S2. | ||
4. Conclusions
The photocatalytic hydrogen ion reduction on Au/C3N4 was investigated for differently prepared catalysts. Changes included gold particle size, particle density, and initial oxidation states. The following may be extracted from the study. (1) No direct effect of particle size, in the range 3.5–5.4 nm, on the catalytic activity is seen. (2) The thermal treatment in static air, initially intended to reduce the gold precursor to metallic gold, was found to be inadequate for the complete reduction to Au0 (XPS Au 4f and valence band Au 5d). (3) The amount of Aux+ formed relative to gold metal was found to increase with the deposition–precipitation time. (4) The use of a reducing environment during the thermal treatment led to the formation of gold nanoparticles bearing a wide diversity of shapes characterized by sharp corners and edges. Such morphologies were not reported in the literature upon the use of a DPU route for gold deposition on g-C3N4 before. (5) Also, all catalysts showed pronounced plasmon resonance in the 500–650 nm range except for the one prepared without calcination, and before the reaction, with mean particle size of ca. 1.8 Å. The ratio of urea to Au ions during the deposition–precipitation process has also affected particle density and shape on top of g-C3N4. This might be due to the interaction between urea and the surface of C3N4 that has affected the growth rate and shape of gold particles. While using urea concentrations above 0.42 M (urea/Au > 400) has resulted in the formation of less spherical Au particles, no pronounced shape–activity relationship could be drawn. From these parameters, an optimal performance for the Au/g-C3N4 catalyst was found. A gold loading of about 0.6 atomic%, which corresponds to a dispersion of one particle per about 100 nm2, gave the best performance, highlighting the presence of a narrow gold loading range in photocatalysis.Conflicts of interest
There are no conflicts to declare.References
- J. Andrews and B. Shabani, Procedia Eng., 2012, 49, 15–25 CrossRef CAS.
- A. Fujishima and K. Honda, Nature, 1972, 238, 37–38 CrossRef CAS PubMed.
- K. Maeda, J. Photochem. Photobiol., C, 2011, 12, 237–268 CrossRef CAS.
- F. E. Osterloh, Chem. Mater., 2008, 20, 35–54 CrossRef CAS.
- K. Domen, X. Wang, K. Maeda, A. Thomas, K. Takanabe, G. Xin, J. M. Carlsson and M. Antonietti, Nat. Mater., 2009, 8, 76–80 CrossRef PubMed.
- M. Caux, F. Fina, J. T. S. Irvine, H. Idriss and R. Howe, Catal. Today, 2017, 287, 182–188 CrossRef CAS.
- F. Fina, H. Ménard and J. T. S. Irvine, Phys. Chem. Chem. Phys., 2015, 17, 13929–13936 RSC.
- B. Ohtani, J. Photochem. Photobiol., C, 2010, 11, 157–178 CrossRef CAS.
- X. Zhang, Y. L. Chen, R.-S. Liu and D. P. Tsai, Rep. Prog. Phys., 2013, 76, 046401 CrossRef PubMed.
- S. Link and M. A. El-Sayed, J. Phys. Chem. B, 1999, 103, 4212–4217 CrossRef CAS.
- D. Pines and D. Bohm, Phys. Rev., 1952, 85, 338–353 CrossRef CAS.
- M. A. Khan, L. Sinatra, M. Oufi, O. M. Bakr and H. Idriss, Catal. Lett., 2017, 147, 811–820 CrossRef CAS.
- J. Homola, S. S. Yee and G. Gauglitz, Sens. Actuators, 1999, 54, 3–15 CrossRef CAS.
- M. M. Alvarez, J. T. Khoury, T. G. Schaaff, M. N. Shafigullin, I. Vezmar and R. L. Whetten, J. Phys. Chem. B, 1997, 101, 3706–3712 CrossRef CAS.
- A. Furube, L. Du, K. Hara, R. Katoh and M. Tachiya, J. Am. Chem. Soc., 2007, 129, 14852–14853 CrossRef CAS PubMed.
- S. K. Cushing and N. Wu, Electrochem. Soc. Interface, 2013, 63–67 CrossRef CAS.
- L. Zhang, F. Mao, L. Zheng, H. Wang, X. Yang and H. G. Yang, ACS Catal., 2018, 8, 11035–11041 CrossRef CAS.
- H. Li, Y. Gao, Z. Xiong, C. Liao and K. Shih, Appl. Surf. Sci., 2018, 439, 552–559 CrossRef CAS.
- J. Zhu, S. A. C. Carabineiro, D. Shan, J. L. Faria, Y. Zhu and J. L. Figueiredo, J. Catal., 2010, 274, 207–214 CrossRef CAS.
- S. Chang, A. Xie, S. Chen and J. Xiang, J. Electroanal. Chem., 2014, 719, 86–91 CrossRef CAS.
- Q. Zhang, J. Deng, Z. Xu, M. Chaker and D. Ma, ACS Catal., 2017, 7, 6225–6234 CrossRef CAS.
- M. A. Gondal, A. A. Adeseda, S. G. Rashid, A. Hameed, M. Aslam, I. M. I. Ismail, U. Baig, M. A. Dastageer, A. R. Al-Arfaj and A. U. Rehman, J. Mol. Catal. A: Chem., 2016, 423, 114–125 CrossRef CAS.
- P. Fageria, S. Uppala, R. Nazir, S. Gangopadhyay, C. H. Chang, M. Basu and S. Pande, Langmuir, 2016, 32, 10054–10064 CrossRef CAS PubMed.
- G. Darabdhara and M. R. Das, Chemosphere, 2018, 197, 817–829 CrossRef CAS PubMed.
- Y. Guo, H. Jia, J. Yang, H. Yin, Z. Yang, J. Wang and B. Yang, Phys. Chem. Chem. Phys., 2018, 20, 22296–22307 RSC.
- R. Nazir, P. Fageria, M. Basu and S. Pande, J. Phys. Chem. C, 2017, 121, 19548–19558 CrossRef CAS.
- T. Tong, B. Zhu, C. Jiang, B. Cheng and J. Yu, Appl. Surf. Sci., 2018, 433, 1175–1183 CrossRef CAS.
- Z. Xu, M. G. Kibria, B. AlOtaibi, P. N. Duchesne, L. V. Besteiro, Y. Gao, Q. Zhang, Z. Mi, P. Zhang, A. O. Govorov, L. Mai, M. Chaker and D. Ma, Appl. Catal., B, 2018, 221, 77–85 CrossRef CAS.
- M. Haruta, Catal. Today, 1997, 36, 153–166 CrossRef CAS.
- A. Hugon, L. Delannoy and C. Louis, Gold Bull., 2008, 41, 127–138 CrossRef CAS.
- R. Zanella, L. Delannoy and C. Louis, Appl. Catal., A, 2005, 291, 62–72 CrossRef CAS.
- S. Samanta, S. Martha and K. Parida, ChemCatChem, 2014, 6, 1453–1462 CAS.
- F. Fina, S. K. Callear, G. M. Carins and J. T. S. Irvine, Chem. Mater., 2015, 27, 2612–2618 CrossRef CAS.
- S. Peng, J. M. McMahon, G. C. Schatz, S. K. Gray and Y. Sun, Proc. Natl. Acad. Sci. U. S. A., 2010, 107, 14530–14534 CrossRef CAS PubMed.
- J. F. Moulder, W. F. Stickle, P. E. Sobol and K. D. Bomben, Handbook of X-ray Photoelectron Spectroscopy, 1992 Search PubMed.
- M. P. Casaletto, A. Longo, A. Martorana, A. Prestianni and A. M. Venezia, Surf. Interface Anal., 2006, 38, 215–218 CrossRef CAS.
- E. Castillejos, E. Gallegos-Suarez, B. Bachiller-Baeza, R. Bacsa, P. Serp, A. Guerrero-Ruiz and I. Rodríguez-Ramos, Catal. Commun., 2012, 22, 79–82 CrossRef CAS.
- Z. H. N. Al-Azri, W. T. Chen, A. Chan, V. Jovic, T. Ina, H. Idriss and G. I. N. Waterhouse, J. Catal., 2015, 329, 355–367 CrossRef CAS.
- V. Jovic, Z. H. N. Al-Azri, W. T. Chen, D. Sun-Waterhouse, H. Idriss and G. I. N. Waterhouse, Top. Catal., 2013, 56, 1139–1151 CrossRef CAS.
- K. Luo, D. Y. Kim and D. W. Goodman, J. Mol. Catal. A: Chem., 2001, 167, 191–198 CrossRef CAS.
- T. Andersson, C. Zhang, O. Björneholm, M. H. Mikkelä, K. Jänkälä, D. Anin, S. Urpelainen, M. Huttula and M. Tchaplyguine, J. Phys. B: At., Mol. Opt. Phys., 2017, 50, 015102 CrossRef.
- L. Lozzi and S. Santucci, J. Chem. Phys., 2011, 134, 114709 CrossRef PubMed.
- A. Visikovskiy, H. Matsumoto, K. Mitsuhara, T. Nakada, T. Akita and Y. Kido, Phys. Rev. B: Condens. Matter Mater. Phys., 2011, 83, 1–9 CrossRef.
- H. Piao and N. S. Mcintyre, J. Electron Spectrosc. Relat. Phenom., 2001, 119, 29–33 CrossRef CAS.
- C. S. Fadley, J. Electron Spectrosc. Relat. Phenom., 2010, 178–179, 2–32 CrossRef CAS.
- D. Céolin, J. M. Ablett, D. Prieur, T. Moreno, J. P. Rueff, T. Marchenko, L. Journel, R. Guillemin, B. Pilette, T. Marin and M. Simon, J. Electron Spectrosc. Relat. Phenom., 2013, 190, 188–192 CrossRef.
- D. Wang, X. Cui, Q. Xiao, Y. Hu, Z. Wang, Y. M. Yiu and T. K. Sham, AIP Adv., 2018, 8, 065210 CrossRef.
- H. Hövel and I. Barke, Prog. Surf. Sci., 2006, 81, 53–111 CrossRef.
- M. Tchaplyguine, M. H. Mikkelä, C. Zhang, T. Andersson and O. Björneholm, J. Phys. Chem. C, 2015, 119, 8937–8943 CrossRef CAS.
- W. Zhang, H. Y. Cho, Z. Zhang, W. Yang, K. K. Kim and F. Zhang, J. Korean Phys. Soc., 2016, 69, 1445–1449 CrossRef CAS.
- B. Acosta, E. Smolentseva, S. Beloshapkin, R. Rangel, M. Estrada, S. Fuentes and A. Simakov, Appl. Catal., A, 2012, 449, 96–104 CrossRef CAS.
- M. R. Ananthan, P. Malar, T. Osipowicz, S. Varma and S. Kasiviswanathan, Thin Solid Films, 2017, 622, 78–83 CrossRef CAS.
- H. Tsai, E. Hu, K. Perng, M. Chen, J. C. Wu and Y. S. Chang, Surf. Sci., 2003, 537, L447–L450 CrossRef CAS.
- H. Shi, R. Asahi and C. Stampfl, Phys. Rev. B: Condens. Matter Mater. Phys., 2007, 75, 1–8 Search PubMed.
- J. Yang, H. Yan, X. Zong, F. Wen, M. Liu and C. Li, Philos. Trans. R. Soc., A, 2013, 371, 20110430 CrossRef PubMed.
- J. Yang, D. Wang, H. Han and C. Li, Acc. Chem. Res., 2013, 46, 1900–1909 CrossRef CAS PubMed.
- M. A. Fox and M. T. Dulay, Chem. Rev., 1993, 93, 341–357 CrossRef CAS.
- P. Pichat, J. M. Herrmann, J. Disdier, M. N. Mozzanega and H. Courbon, Stud. Surf. Sci. Catal., 1984, 19, 319–326 CrossRef CAS.
- G. R. Bamwenda, S. Tsubota, T. Nakamura and M. Haruta, J. Photochem. Photobiol., A, 1995, 89, 177–189 CrossRef CAS.
- L. Millard and M. Bowker, J. Photochem. Photobiol., A, 2002, 148, 91–95 CrossRef CAS.
- M. Haruta, Gold Bull., 2004, 37, 27–36 CrossRef CAS.
- V. Jovic, W.-T. Chen, D. Sun-Waterhouse, M. G. Blackford, H. Idriss and G. I. N. Waterhouse, J. Catal., 2013, 305, 307–317 CrossRef CAS.
- M. Murdoch, G. I. N. Waterhouse, M. A. Nadeem, J. B. Metson, M. A. Keane, R. F. Howe, J. Llorca and H. Idriss, Nat. Chem., 2011, 3, 489–492 CrossRef CAS PubMed.
- M. Bowker, C. Morton, J. Kennedy, H. Bahruji, J. Greves, W. Jones, P. R. Davies, C. Brookes, P. P. Wells and N. Dimitratos, J. Catal., 2014, 310, 10–15 CrossRef CAS.
- W. T. Chen, V. Jovic, D. Sun-Waterhouse, H. Idriss and G. I. N. Waterhouse, Int. J. Hydrogen Energy, 2013, 38, 15036–15048 CrossRef CAS.
- W. T. Chen, A. Chan, D. Sun-Waterhouse, T. Moriga, H. Idriss and G. I. N. Waterhouse, J. Catal., 2015, 326, 43–53 CrossRef CAS.
- L. Delannoy, N. Weiher, N. Tsapatsaris, A. M. Beesley, L. Nchari, S. L. M. Schroeder and C. Louis, Top. Catal., 2007, 44, 263–273 CrossRef CAS.
- D. Ruan, J. Xue, M. Fujitsuka and T. Majima, Chem. Commun., 2019, 55, 6014–6017 RSC.
- M. Grzelczak, J. Perez-Juste, P. Mulvaney and L. M. Liz-Marzan, Chem. Soc. Rev., 2008, 37, 1783–1791 RSC.
- T. Ohgi and D. Fujita, Phys. Rev. B: Condens. Matter Mater. Phys., 2002, 66, 115410 CrossRef.
- V. B. Crist, Handbook of monochromatic XPS spectra, Commercially pure binary oxide, 2005, vol. 2 Search PubMed.
- S. L. Logunov, T. S. Ahmadi, M. A. El-Sayed, J. T. Khoury and R. L. Whetten, J. Phys. Chem. B, 1997, 101, 3713–3719 CrossRef CAS.
- B. M. Ross and L. P. Lee, Nanotechnology, 2008, 19, 275201 CrossRef PubMed.
- A. Sundaramurthy, K. B. Crozier, G. S. Kino, D. P. Fromm, P. J. Schuck and W. E. Moerner, Phys. Rev. B: Condens. Matter Mater. Phys., 2005, 72, 1–6 CrossRef.
- J. P. Kottmann, O. J. F. Martin, D. R. Smith and S. Schultz, Chem. Phys. Lett., 2001, 341, 1–6 CrossRef CAS.
- M. Khan, M. AlOufi, P. Maity, I. AlHowaish and H. Idriss, J. Phys. Chem. C, 2018, 122, 16779–16787 CrossRef CAS.
- G. R. Bamwenda, S. Tsubota, T. Nakamura and M. Haruta, J. Photochem. Photobiol., A, 1995, 89, 177–189 CrossRef CAS.
- K. Wang, Z. Wei, B. Ohtani and E. Kowalska, Catal. Today, 2018, 303, 327–333 CrossRef CAS.
- M. J. Berr, F. F. Schweinberger, M. Döblinger, K. E. Sanwald, C. Wolff, J. Breimeier, A. S. Crampton, C. J. Ridge, M. Tschurl, U. Heiz, F. Jäckel and J. Feldmann, Nano Lett., 2012, 12, 5903–5906 CrossRef CAS PubMed.
Footnote |
| † Electronic supplementary information (ESI) available. See DOI: 10.1039/c9cp02241d |
| This journal is © the Owner Societies 2019 |

