
 Open Access Article
 This Open Access Article is licensed under a
 Creative Commons Attribution 3.0 Unported Licence
Photodissociation dynamics and the dissociation energy of vanadium monoxide, VO, investigated using velocity map imaging†
Alexander S.
Gentleman
 ,
Andreas
Iskra
,
Hansjochen
Köckert
and
Stuart R.
Mackenzie
*
,
Andreas
Iskra
,
Hansjochen
Köckert
and
Stuart R.
Mackenzie
*
Department of Chemistry, Physical and Theoretical Chemistry Laboratory, South Parks Road, Oxford, OX1 3QZ, UK. E-mail: stuart.mackenzie@chem.ox.ac.uk
First published on 24th June 2019
Abstract
Velocity map imaging has been employed to study multi-photon fragmentation of vanadium monoxide (VO) via the C 4Σ− state. The fragmentation dynamics are interpreted in terms of dissociation at the three-photon level, with the first photon weakly resonant with transitions to vibrational energy levels of the C 4Σ− state. The dissociation channels accessed are shown to depend strongly on the vibrational level via which excitation takes place. Analysis of the evolution of the kinetic energy release spectrum with photon energy leads to a refined value for the dissociation energy of ground state VO of D0(VO) = 53![[thin space (1/6-em)]](https://www.rsc.org/images/entities/char_2009.gif) 126 ± 263 cm−1.
126 ± 263 cm−1.
I. Introduction
Vanadium oxides play important roles in modern industrial processes as catalysts, semiconductors, and in optical devices.1,2 Vanadium monoxide (VO) also plays a key role in astrophysical chemistry, with characteristic VO transitions observed in the spectra of both cool (i.e. 2500–3000 K) M-class stars and young hot brown dwarfs and used in their characterisation.3,4 Furthermore, VO has been postulated to exist in the atmosphere of the large Jupiter exoplanets WASP-121b and WASP-127b discovered by L. Delrez et al.5 and Lam et al.,6 respectively.7–10Largely due to its astrophysical significance, the low-lying electronic states of VO have been characterised extensively. Merer et al. has used Fourier transform spectroscopy,11–13 intracavity laser-induced fluorescence spectroscopy,14 and Doppler-limited discharge emission and laser excitation spectra15 to study the ground and excited states of VO. Many of the same spectral features are clear in the more recent electronic absorption spectra of matrix isolated VO.16 This group has previous reported resonance enhanced multiphoton ionization (REMPI) spectra of VO in the visible region, characterising transitions from the VO X 4Σ− to the B 4Π and C 4Σ− excited states as well as spin-forbidden transitions to the 2 2Π and 3 2Π excited states.17 VOx− (x = 1–4) anions have been studied by Wang and co-workers using photodetachment spectroscopy,18 with the high-resolution spectrum of VO2− studied using the low Photoelectron Velocity Map Imaging (SEVI) technique by Neumark and co-workers.19 McKemmish et al. have recently reviewed the known spectral lines of VO, as well as the potential energy surfaces of the low-lying states of VO.4
The complex electronic structure of VO has attracted considerable interest from theoreticians. In an early computational study involving the use of coupled pair functional method,20 Bauschlicher and Langhoff identified the VO ground state symmetry as X 4Σ−,20 thereby confirming the assignment of Carlson and Moser21 which preceded high-resolution spectroscopic investigation. The bonding in the ground state of VO comprise a mix of a covalent and ionic contributions leading to an element of (3dσ + 3dπ) triple bond character. The covalent bonding contributions arise from V (3d) + O (2p) interactions, with the lone V 4s electron polarised away from O; the ionic component from electron donation from the O atom 2pπ orbital into the empty 3dπ orbitals on V.20 Low-lying excited states arise predominantly from V 4s excitation into non-bonding π or δ orbitals.
Bauschlicher and Langhoff calculated a dissociation energy of VO, i.e., D0(VO), of 5.68 eV (45800 cm−1), markedly lower than the experimental values (see Table 1) due to inadequate treatment of the considerable correlation energy.20 A more recent investigation by Miliordos and Mavridis using multi-reference and coupled cluster approaches obtained a value of De = 149.2 kcal mol−1 (52180 cm−1, 6.470 eV),22 which compares better with the experimentally-determined dissociation energies.
| Author | D 0 | Method | Year |
|---|---|---|---|
| Jones et al.23 | ≥48677 cm−1 |
Chemiluminescence | 1976 |
| (≥6.034 eV) | |||
| Pedley et al.26 | 148.4 ± 4.5 kcal mol−1 | Knudsen cell | 1983 |
| 51900 ± 1600 cm−1 |
|||
| (6.435 ± 0.195 eV) | |||
| Balducci et al.24 | 625.5 ± 8.5 kJ mol−1 | Knudsen cell | 1983 |
| 52290 ± 710 cm−1 |
|||
| (6.483 ± 0.088 eV) | |||
| Bauschlicher et al.20 | 45800 cm−1 |
CASSCF | 1986 |
| (5.68 eV) | |||
| Miliordos et al.22 | 149.2 kcal mol−1 | RCCSD(T) + DKH2/BP | 2007 |
| 52180 cm−1 |
|||
| (6.470 eV) | |||
| This work | 53126 ± 263 cm−1 |
VMI | 2019 |
Experimentally, Jones and Gole determined the lower-bound D0 value of VO in their study of the V + NO2 → VO + NO reaction.23 Under single-collision conditions, the authors observed chemiluminescence from vibrational levels up to v′ = 11 of the VO C 4Σ−–X 4Σ− system. With knowledge of D0(O–NO), the lower-limit value for D0(VO) of 48677 cm−1 (6.034 eV) was determined. Balducci et al. used a combination of Knudsen cell and mass spectrometry to investigate the temperature dependence of the VO + Eu ⇌ EuO + V gas-phase equilibrium.24 From the heat of reaction and the well-known D0(EuO), they determined a dissociation energy, D0(VO) of 625.5 ± 8.5 kJ mol−1 (52290 ± 710 cm−1, 6.483 ± 0.088 eV). Finally, Pedley and Marshall used the available thermochemical data from older Knudsen cell experiments to determine the value of D0(VO) as 148.4 ± 4.5 kcal mol−1 (51900 ± 1600 cm−1, 6.435 ± 0.195 eV).25,26
Of all of the geometric and electronic properties of VO that have been elucidated by previous experimental and theoretical work, the experimental D0(VO) values suffer from large experimental uncertainties limited by either/both the resolution of the technique at the time, or/and the precision of the least well-determined value in a thermodynamic cycle. We have developed a velocity map imaging (VMI) spectrometer coupled with a laser ablation source capable of investigating the photodissociation dynamics of the small metal oxides. By using VMI to measure the photofragment kinetic energy release (KER) spectra, dissociation energies can be determined directly by extrapolation of the observed KER as a function of photoexcitation energy. In this way we have determined improved ground state dissociation energies for systems including: (i) Au2,27 (ii) Au–RG (RG = Ar, Kr, Xe),28,29 (iii) Ag2, AgO, and Ag–RG (RG = Ar, Kr, Xe),30 (iv) Li(NH3)4,31 (v) Cu2 and CuO,32 and (vi) CrO and MoO.33
Here, we report the results of a VMI investigation into the multiphoton dissociation dynamics of VO via vibrational energy levels of the well-characterised C 4Σ− state. The rich dissociation dynamics reflect the complex electronic structure of VO and, unlike in other systems we have studied, the dissociation channels accessed are strongly dependent on the C 4Σ− state vibrational level via which excitation takes place. Extrapolation of the observed total kinetic energy release as a function of total photoexcitation energy yields an improved ground state dissociation energy.
II. Experimental
The VMI instrument used in these studies is a modified version of that described in our previous studies, the new variant being capable of studying both neutral and charged species. In previous work, the VMI lens assembly comprised a conical extractor lens assembly with a resistively-coupled electrode chain, as designed by Wrede et al.34 For the work presented here, the entire electrode chain was grounded. The new instrument was operated in neutral-dissociation mode, with the method used to generate and detect VO in the gas-phase identical to that used in prior work.17 In brief, laser ablation at 532 nm (2nd harmonic) of a rotating disc target of pure vanadium (Goodfellow, 99.98%) generates V- and VO-containing species which are entrained in a pulse of helium delivered via a solenoid valve (Parker-Hannifin, Series 9) from a stagnation pressure of 3 bar.Photoexcitation of VO in the region 17000–23500 cm−1 was provided by the focussed output of an optical parametric oscillator (OPO, Continuum Panther) pumped by the 355 nm (3rd harmonic) output of a Nd:YAG laser (Continuum Surelite). The OPO pulse both photodissociates VO and photoionizes the resultant V fragments within a VMI lens assembly. Extraction of the ion sphere occurs collinear to the direction of the molecular beam and images are recorded at a 10 Hz repetition rate for ca. 100k–500k ion counts using a commercial MCP/scintillator (P45)/camera assembly (Photek) employing on the fly centroid averaging. Reconstruction of the central slice of the ion sphere was performed using the Polar Onion Peeling (POP) algorithm developed by Verlet and co-workers.35
In the visible region probed here, the only two species observed in the molecular beam were V and VO. The REMPI spectrum of VO recorded (Fig. 1) is identical to that reported previously by our group with no new bands observed. All images presented here are of V fragments arising from photodissociation events induced when the visible output from the OPO is in the vicinity of C 4Σ−–X 4Σ− (v′,0) transitions in VO. A magnification factor of 1.055 is used throughout this work, which is consistent both with simulations of ion trajectories with our electrode arrangement36,37 and our previous experiments.30,33
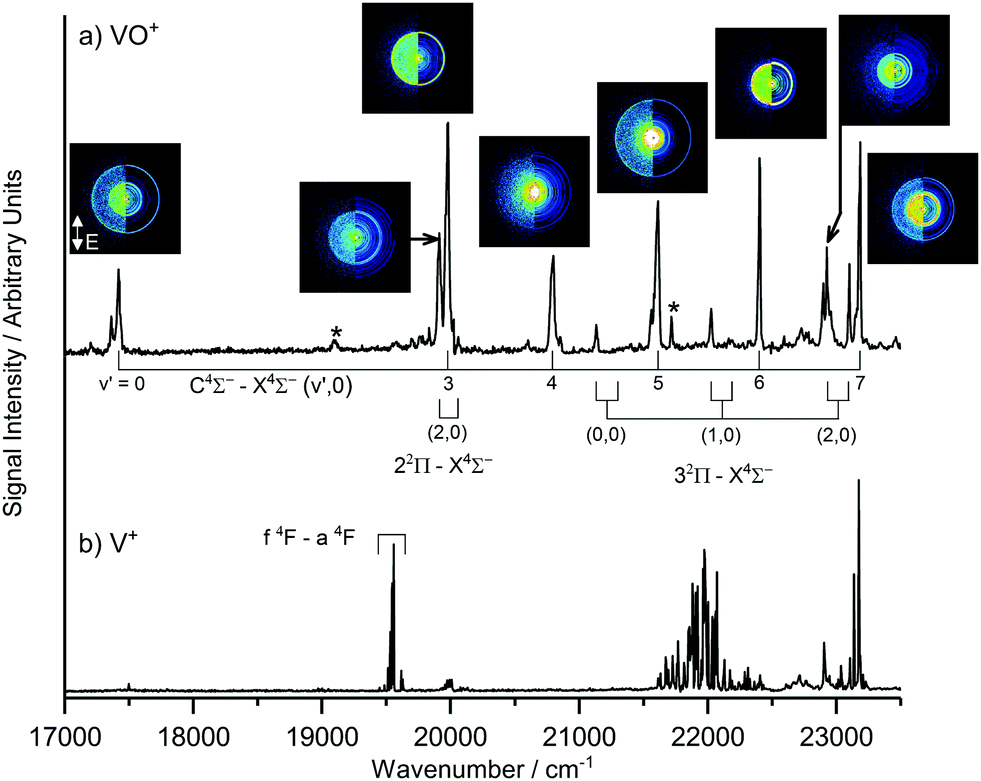 | ||
| Fig. 1 (a) One colour (1 + n) REMPI spectrum of VO recorded in the range 17000–23500 cm−1. (b) The corresponding signal observed in the V+ channel. Band assignments are from Hopkins et al. [ref. 16] and asterisks (*) mark unassigned bands. Velocity map images of V+ photofragments recorded at energies corresponding to various vibronic transitions in (a) are included and illustrate the rich dynamical behaviour across this spectral region. The polarisation of the photoexcitation laser is indicated in the v′ = 0 image (i.e. vertically-polarised in the plane of the detector). | ||
III. Results and discussion
A. (1 + n) REMPI spectrum of VO
In order to confirm the presence of VO in the molecular beam, the (1 + n) REMPI spectrum was recorded in the region of the C 4Σ− (v′)–X 4Σ− (v′′ = 0) transitions (Fig. 1a). The VO+ REMPI spectrum reproduces all transitions identified previously.17 The corresponding spectrum recorded simultaneously in the V+ ion channel is shown in Fig. 1b for comparison. V+ is detected following: (i) direct ionization of neutral V atoms in the molecular beam (e.g., the 2 + 1 ionization via the f 4F state observed near 19550 cm−1), or (ii) photodissociation of V-containing molecules/clusters coupled with V ionization. Only in the latter case do the velocity map images show evidence of the characteristic rings associated with V-atom recoil from a co-fragment in a dissociation process.
To illustrate the richness of the dissociation dynamics observed in this region, Fig. 1a also shows velocity map images of the V+ ion recorded in resonance with known C 4Σ−–X 4Σ− (v′,0) and 2Π–X 4Σ− (v′,0) transitions in VO. It is clear by inspection that the images display dramatic changes throughout this region.
The V+ signals observed at ca. 22000 cm−1 cannot be assigned to any known atomic transitions in V. This signal could originate from metastable V* in the molecular beam or else the fragmentation of larger V-containing species. In most cases though, sharp rings in the V+ images arise only in the vicinity of vibronic transitions in VO confirming this as the parent molecule.
B. V+ photofragment images via several VO C 4Σ− (v′) levels
Velocity map images recorded in the V+ channel while resonant with C 4Σ−–X 4Σ− (v′,0) transitions in VO are shown in Fig. 2 along with the extracted V+ kinetic energy release (KER) spectra of each following reconstruction of the central slice of the ion sphere using the POP algorithm.35 The images, and KER spectra, show clear differences depending on the vibrational state accessed in the C 4Σ− excited state. This contrasts with our previous observations involving the two-colour spectroscopy of CuO → Cu* 2D3/2 + O* 1D following CuO F 2Π (v′) ← X 2Π (v′′ = 0) excitation32 in which a single ring was observed corresponding to the same dissociation channel across the range of images.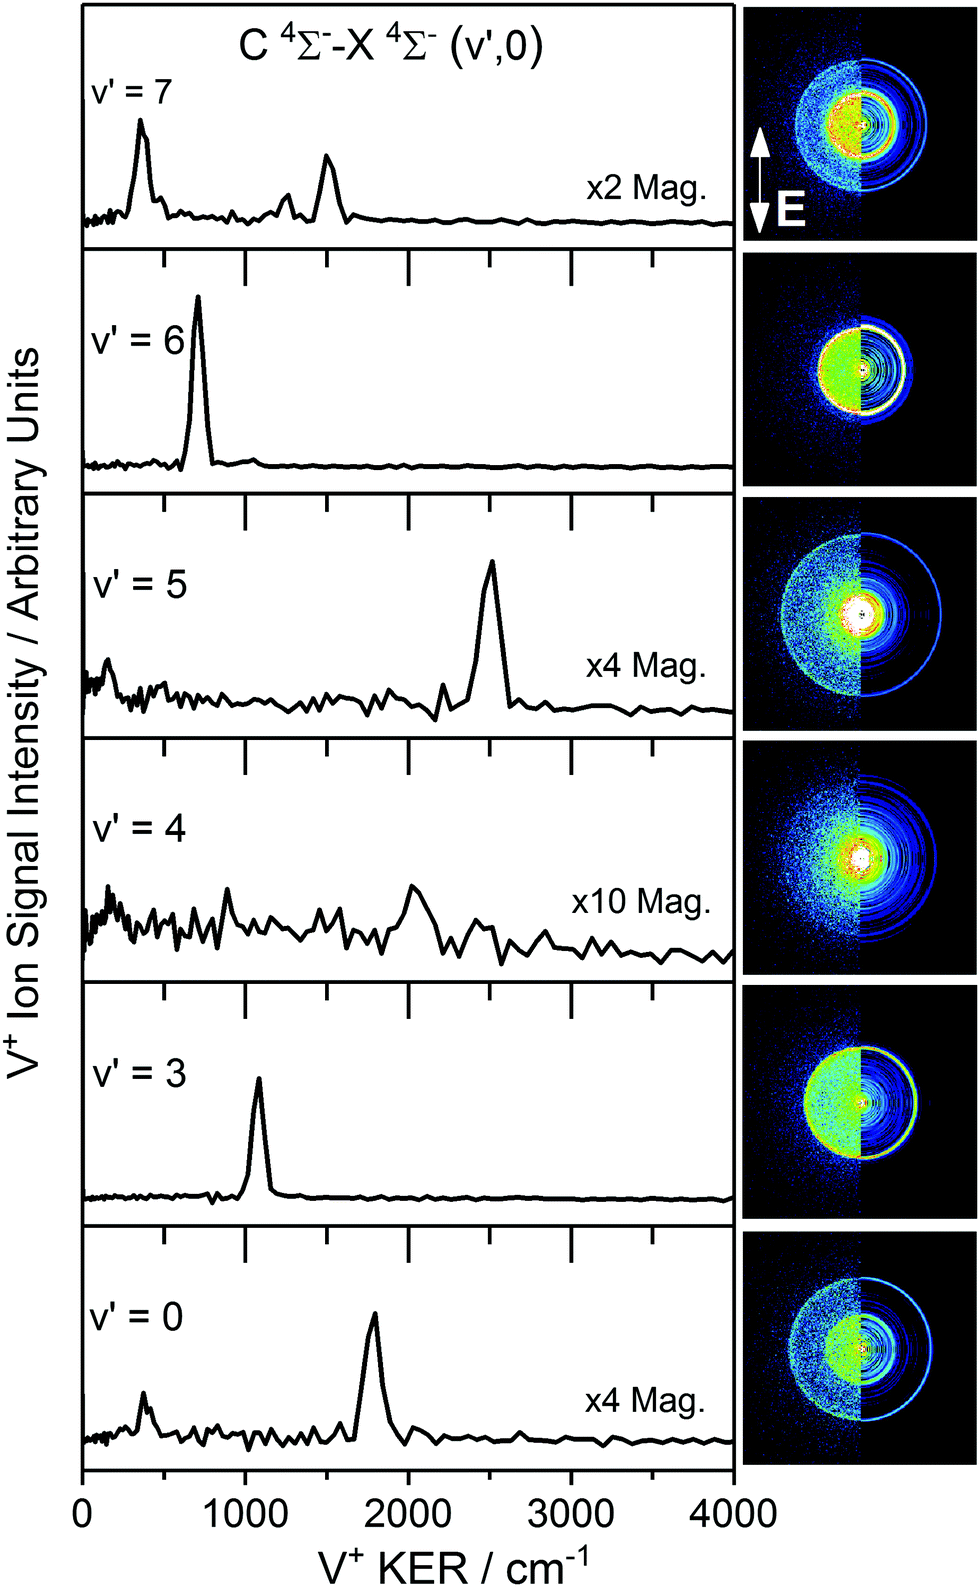 | ||
| Fig. 2 Vanadium ion velocity map images and corresponding V* kinetic energy release (KER) spectra recorded at various band positions of the C 4Σ−–X 4Σ− (v′,0) transition in the VO (1 + n) REMPI spectrum. The left-half of each image displays the raw collected image, with the right-half displaying the reconstructed central slice using the polar onion peeling algorithm. The polarisation of the photoexcitation laser is indicated in the v′ = 7 image (i.e. vertically-polarised to the plane of the detector). | ||
Some V+ images in Fig. 2 show a single strong, isotropic ring (via C 4Σ−v′ = 3, 6) whilst others (via C 4Σ−v′ = 0, 5, 7) clearly show multiple features. The image recorded via C 4Σ−v′ = 4 is significantly weaker than those recorded from other vibrational states and shows only weak features above the noise level. We proceed by considering the dissociation dynamics observed in individual images before assembling all information to determine dissociation channels common to different images and extrapolate to determine a best estimate of the dissociation energy.
C. VO dissociation via the C 4Σ− (v = 3) level
One challenge encountered in studying dissociation of neutral precursors generated by laser ablation is that of identifying unambiguously the parent molecule. Where dissociation to the same channel occurs over a wide enough region of photon energy, consideration of the fragment kinetic energy release as a function of photon energy permits determination of the mass of the co-fragment. Fig. 3 shows V+ velocity map images recorded in the vicinity of the C 4Σ−–X 4Σ− (3,0) transition of VO along with the extracted V+ KER spectra. A small but clear increase in the V+ KER with photoexcitation energy is observed as additional energy above the dissociation threshold is released as kinetic energy of the photofragments. By recording 19 such images in the spectral region 19910–20075 cm−1 (Fig. 3b), the variation of V+ KER with photon energy confirmed VO dissociation (i.e., O atom co-fragment) at the three-photon level, consistent with the observation of VO REMPI spectrum (see ESI† for details). In principle, the data would also be consistent with photofragmentation of V3 at the single-photon level but there is no evidence of V3 in the molecular beam despite the ionisation energy for V3 (44336 cm−1)38 being lower than that of V (54411.7 cm−1).39 However, the most compelling evidence for VO dissociation comes from the fact that rings in the V+ images are only present at the energies that correspond to known vibronic transitions in VO.
 | ||
| Fig. 3 (a) V+ kinetic energy release (KER) spectra channel recorded at various photon energies in the vicinity of the C 4Σ−–X 4Σ− (3,0) transition of VO. The KER (and hence the size of the ring in the image) increases with increasing photoexcitation energy. (b) Plotting the variation in V* KER with photon energy allows a determination of (i) the number of photons involved in the dissociation process and (ii) the mass of the co-fragment (see ESI† for more details). | ||
Having established oxygen as the co-fragment, the V+ KER spectra can be recast as total kinetic energy release (TKER) spectra and used to determine the dissociation energy of VO. First it is necessary to assign the fragmentation channels observed. As discussed earlier, the most recent experimental value for the ground state dissociation energy of VO is that of Balducci et al., i.e. D0(VO) = 625.5 ± 8.5 kJ mol−1 (52345 ± 726 cm−1).24 This D0(VO) value was used to initially identify the exit channel accessed via the photofragmentation of VO in the vicinity of the C 4Σ−–X 4Σ− (3,0) transition.
A plot of TKER versus 3hν yields a straight line
| TKER = 3hν − (D0(VO) + EV + Eo), | (1) |
560 ± 170 cm−1 is obtained for (D0(VO) + EV + Eo) by extrapolation to TKER = 0 (see ESI†). Assuming the dissociation energy of 52350 cm−1 Balducci et al. generates EV + Eo ≈ 3200 ± 900 cm−1. Given the sparsity of V and O atom terms in the low energy region, the only channel consistent with this measurement is V (a 6D) + O (3P) at 2100–2600 cm−1 depending on spin–orbit levels.40,41 The next excited electronic terms would be V (4D) and/or O (1D) some 6200 cm−1 or 15970 cm−1 higher in wavenumber, respectively.
With some confidence in this assignment of fragment terms generated by fragmentation via the C 4Σ− (v = 3) level we can reverse the argument and determine a more refined value for the dissociation energy from our measurement. With a weighted averages of the V (6D) and O (3P) spin–orbit levels and within the assumption of dissociation at the three-photon level we calculate an initial estimate of the ground state dissociation energy D0(VO) of 53200 ± 300 cm−1.
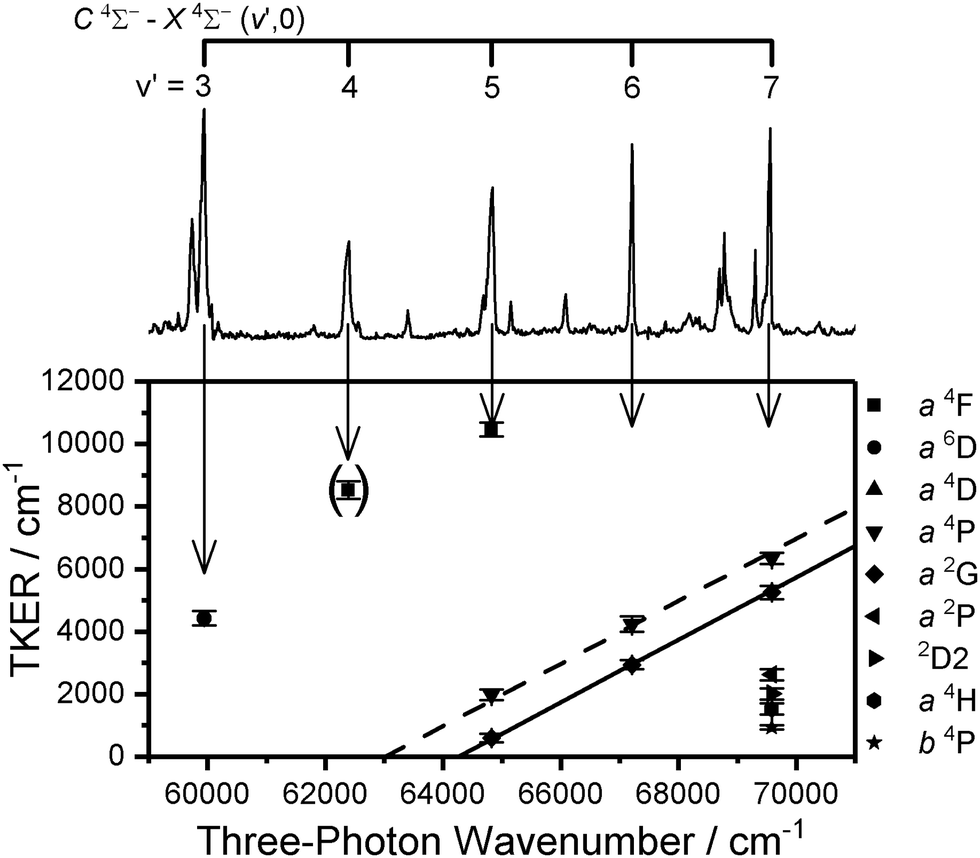
D. Images recorded in the vicinity of the VO C 4Σ−–X 4Σ− (7,0) transition
The V+ velocity map image recorded via the C 4Σ− (v = 7) level, is shown in Fig. 2. Multiple rings/dissociation channels are observed in the image which persist following excitation throughout the spectral region around the VO C 4Σ−–X 4Σ− (7,0) transition.
Fig. 4 shows the TKER peak positions as a function of three-photon photoexcitation wavenumber for images recorded in the vicinity of the C 4Σ−–X 4Σ− (7,0) band (23100–23250 cm−1) as well as around the 3 2Π–X 4Σ− (2,0) band (22800–22950 cm−1). At this total energy many dissociation channels are open and the TKER spectra observed compare well with the production of V electronic states between 8400 and 15600 cm−1 above the ground term as listed in Table 2.
 | ||
| Fig. 4 Peak positions in the TKER spectra plotted as a function of three-photon energy. Uncertainties represent the FWHM of the TKER peak in consideration. The solid lines represent the simulated TKERs based on the D0(VO) value determined from V+ velocity map images recorded in the v′ = 3 region, and the identified quantum states of the vanadium and oxygen photofragments (Series I–VII, see Table 2 and text for details). For completion, Series VIII represents the TKER expected for the V 4F + O 1D channel. The open data points could not be assigned unambiguously to any series. | ||
| Channel | D 0(VO)/cm−1 | ||
|---|---|---|---|
| v′ = 3 | V (3d4(5D)4s; a 6D) + O (3P) | 53190 ± 242 |
|
| v′ = 7 | Series I | V (3d4(5D)4s; a 4D) + O (3P) | 53507 ± 356 |
| Series II | V (3d34s2; a 4P) + O (3P) | 53419 ± 293 |
|
| Series III | V (3d34s2; a 2G) + O (3P) | 53136 ± 262 |
|
| Series IV | V (3d34s2; a 2P) + O (3P) | 53075 ± 230 |
|
| Series V | V (3d34s2; a 2D2) + O (3P) | 53007 ± 225 |
|
| Series VI | V (3d3(3H)4s; a 4H) + O (3P) | 53066 ± 234 |
|
| Series VII | V (3d4(3P2)4s; b 4P) + O (3P) | 53143 ± 329 |
|
| Weighted-average: | 53190 ± 261 |
||
In all cases the O atoms is produced in the 3P ground state and, in the absence of spin–orbit level resolution, the lines shown in Fig. 4 assume weighted mean wavenumbers for each atomic term.
Fig. 5 illustrates the assigned exit channels accessed upon three-photon dissociation of VO via resonance with the C 4Σ− (ν′ = 3, 7) levels. All observed dissociation channels lie above the VO ionization energy and thus neutral dissociation could, in principle, compete with VO+ photofragmentation. However, fitting assuming VO+ photodissociation led to less satisfactory assignments. Similarly, dissociation producing O 1D was considered (Fig. 5 – Series VIII) but lies too high in energy.
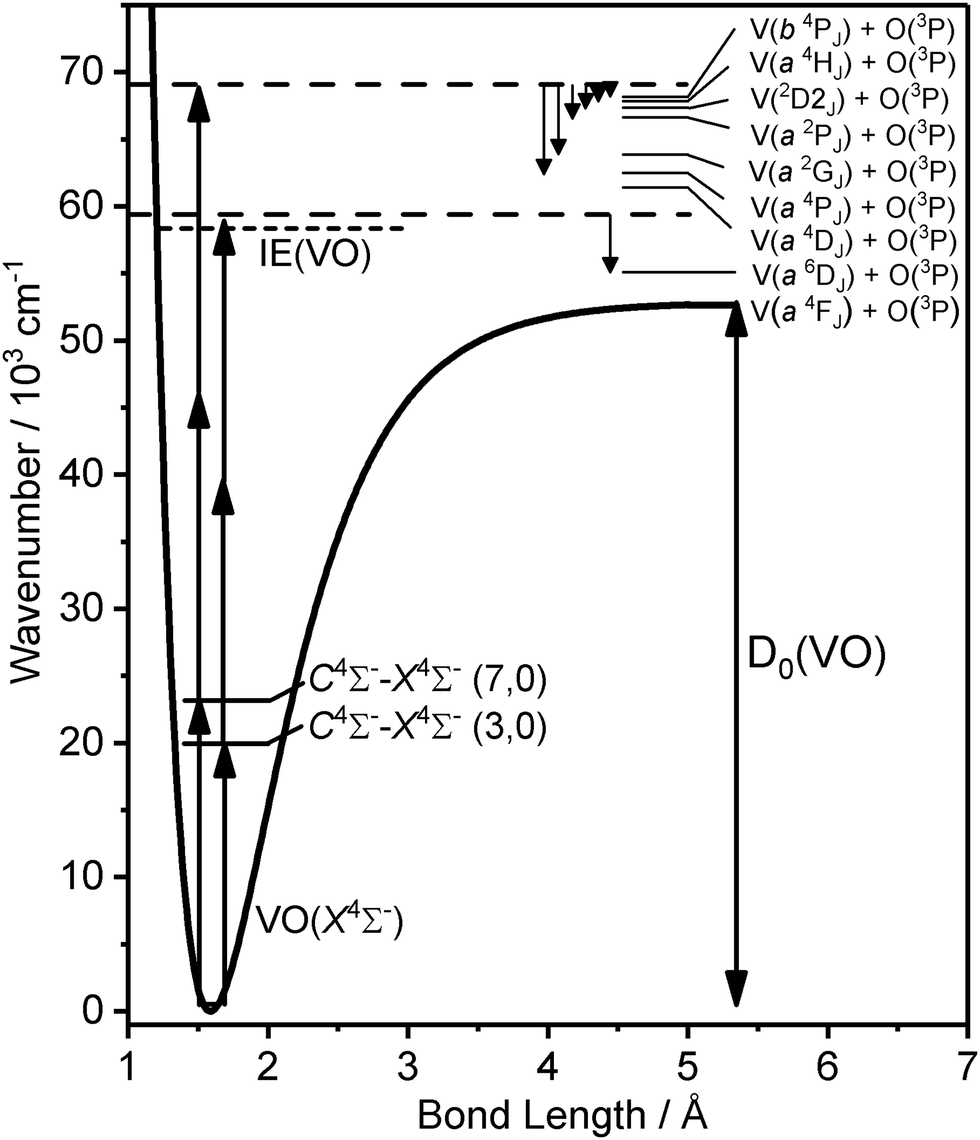 | ||
| Fig. 5 Potential energy curve of the ground X 4Σ− state of VO shown together with various dissociation thresholds accessed by the three-photon dissociation of VO via resonance with vibronic levels of the excited C 4Σ− state (energies of ν′ = 3 and 7 are shown as examples). | ||
With knowledge of the product quantum state distributions of photofragments together with the measured TKER allows for a more refined determination of the parent molecule ground state dissociation energy. For the photodissociation channels identified in Fig. 4, fixing the gradient at 1 (for dissociation at the 3-photon level) and performing linear-fits yields D0(VO) values given in Table 2. The table also includes an overall weighted-average for D0(VO) calculated from values determined from each individual contribution in Series I–VII (53190 ± 261 cm−1), and the value determined from the V+ velocity map images recorded via the C 4Σ−v′ = 3 vibronic level (Section IIIB). The D0(VO) values determined from Series I–VII are in good agreement with each other, and with that determined from the data recorded in the vicinity of the v′ = 3 vibronic transition further supporting the assignments of the identified exit channels.
The weighted-average value for the VO dissociation energy based on Series I–VII can be compared with available literature values listed in Table 1. This value was determined by calculating the weighted arithmetic mean of all D0(VO) values determined from each individual series, with each value being weighted relative to the number of data points comprising each individual series (with the error calculated from the square-root of the sum of weighted variance of the error from each series). Our value agrees to within mutual uncertainties with the Knudsen cell measurements but lies towards the upper end of the range. It should be noted that there is an intrinsic uncertainty in the measurements performed with Knudsen cell mass spectrometry, which can only determine dissociation energies relative to that of a reference sample for strongly-bound systems such as VO.
E. VO photodissociation at other photon energies
Using the weighted-average D0(VO) value determined above (53190 ± 261 cm−1, Table 2), it is possible to simulate TKER spectra for comparison with the experimental spectra in order to identify the dissociation channels accessed throughout this spectral region.
Fig. 6 shows the experimental TKER spectra extracted from images recorded at photoexcitation energies corresponding to peak band positions of the VO C 4Σ− (v′ = 4–7)–X 4Σ− (v′′ = 0) transitions, together with the corresponding simulated TKER spectra. In each case the features observed in the experimental spectrum compare well with those in the simulated TKER spectrum assuming production of the V fragments in a range of excited electronic terms.
 | ||
| Fig. 6 TKER spectra recorded at the peak band positions of the C 4Σ− (v′ = 4–7)–X 4Σ− (v′′ = 0) transitions. Black: experimental TKER spectra. Red: simulated TKER spectra for different product quantum states of the vanadium atom photofragment. A D0(VO) = 53190 ± 261 cm−1 value was used, assuming photodissociation at the three-photon level. FHWMs include uncertainties in the D0(VO) value, in addition to the weighted averages of V and O atom spin orbit levels. Relative amplitudes of the simulated features are fitted to the experimental data. The oxygen atom co-fragment is assumed to be formed in the ground electronic state (i.e., 3P). Inset: V+ velocity map images recorded at the peak vibronic band position. | ||
The cleanest velocity map image is that recorded via C 4Σ− (v′ = 6) with one strong ring readily assigned to the V* (a 2G) + O 3P channel and a much weaker outer ring corresponding to V (a 4P) + O 3P. The same two channels are visible as low TKER inner rings in the image recorded via C 4Σ− (v′ = 5) this time in 2:1 intensity ratio, together with a third, outer ring assigned to V (a 4F) + O 3P (i.e., ground state fragments). The a 2G and a 4P terms of V* are observed a third time in the image via C 4Σ− (v′ = 7) but in this case in an intensity ratio ca. 1:3. Several additional low TKER dissociation channels are observed in this image, most significantly the V* a 4H + O 3P channel.
As remarked upon earlier, the image recorded via C 4Σ− (v′ = 4) has anomalously poor signal-to-noise reflecting low ion counts/inefficient photofragmentation at this particular energy. Nevertheless, weak features are observed which can be tentatively assigned to the O 3P + V* a 4F, a 6D and a 4D channels.
If our working value for the dissociation energy is correct, 1 + 2 excitation via the C–X origin band is insufficient to reach the dissociation threshold. Hence the velocity map image recorded via C 4Σ− (v′ = 0) must represent a 1 + 3, four-photon excitation (to ∼69675 cm−1). This lies energetically close to the three-photon energy via the v′ = 7 transition (69590 cm−1) and indeed some of the same channels are observed in the same low TKER (<3000 cm−1).
At this stage, the trends in the dissociation channels accessed via various C 4Σ− (v) levels become clear and, as shown in Fig. 7, for some features (notably the V* a 4P + O 3P and V* a 2G + O 3P channels) it is possible to plot the variation in TKER as a function of total excitation wavenumber across different excitation regions. This, in turn, allows extrapolation to much lower TKER (in the case of the 2G state to within 500 cm−1 of threshold), providing a yet further improved value for the ground-state dissociation energy of 53126 ± 263 cm−1 (from the V* 2G series). The largest contribution to the uncertainty comes from the (spectrally unresolved) distribution of spin–orbit levels in both fragments for which, in the absence of any better information, a statistical distribution has been assumed. This value is consistent with those in Table 2 from extrapolation in other regions but, in our view, represents the most reliable value for D0(VO) determined from this study.
 | ||
| Fig. 7 Bottom: Peak positions in the TKER spectra extracted from V+ images recorded at energies corresponding to the C 4Σ− (v′ = 3–7)–X 4Σ− (v′′ = 0) vibronic transitions of VO plotted as a function of three-photon energy. Top: The (1 + n) REMPI spectrum of VO included for visual comparison. The error bars represent the FWHM of the peak in consideration. The dashed and solid lines represent the simulated TKER for the a 4P and a 2G series, respectively. The TKER peak corresponding to the energy of the v′ = 4 vibronic band is shown in parentheses to indicate the poor quality of the V+ image recorded at this band position. | ||
F. Bond dissociation energy of VO+
With an improved D0(VO) value derived above, a simple thermodynamic cycle permits the determination of the bond energy for the corresponding cation, VO+. D0(VO) and D0(VO+) are linked by the respective ionisation energies of V and VO which are well-known:| D0(VO) − D0(VO+) = IE(VO) − IE(V). |
158 ± 263 cm−1 (6.095 ± 0.033 eV) is obtained. This value lies towards the upper end of the range of previous experimental measures of this value but agrees with most within mutual uncertainties (see Table S2 in ESI†).
IV. Conclusions
Photofragment velocity map images have been recorded over the visible range in the vicinity of the C 4Σ−–X 4Σ− (v′,0) vibronic transitions of VO. Analysis of the variation in kinetic energy release with photon energy permits a refined value for the dissociation energy of D0(VO) = 53126 ± 263 cm−1 to be determined. This value, a comparatively direct measure of D0, is consistent with all images recorded in this study and compares well with values determined via other experimental techniques as well as those calculated theoretically.
This VMI investigation reveals a strong dependence of the dissociation channels accessed on the intermediate vibronic state of VO accessed via which the excitation takes place. Although the spectroscopy of VO is well-understood for the ground and low-lying electronic states, higher-lying states remain poorly characterised. Additional spectroscopic and theoretical investigations would be required to fully understand the potential energy surfaces accessed and crossings explored in the photodissociation process. In the spectral region explored here, evidence is found for production of the V atom photofragment in all electronic states between the ground a 4F electronic state, and the eighth excited electronic state, b 4P. We find no evidence for the production of the oxygen co-fragment in anything other than the ground 3P term.
Funding sources
AI would like to thank the EPSRC along with Wadham College, Oxford for his graduate studentship. HK is grateful to the University of Oxford for his Clarendon Scholarship. This work was supported by EPSRC Programme Grant No. EP/L005913.Conflicts of interest
There are no conflicts to declare.References
- M. F. Becker, A. B. Buckman, R. M. Walser, T. Lepine, P. Georges and A. Brun, Appl. Phys. Lett., 1994, 65, 1507–1509 CrossRef CAS.
- R. Grabowski, S. Pietrzyk, J. Sloczynski, F. Genser, K. Wcislo and B. Grzybowska-Swierkosz, Appl. Catal., A, 2002, 232, 277–288 CrossRef CAS.
- N. M. White and R. F. Wing, Astrophys. J., 1978, 222, 209–219 CrossRef CAS.
- L. K. McKemmish, S. N. Yurchenko and J. Tennyson, Mon. Not. R. Astron. Soc., 2016, 463, 771–793 CrossRef CAS.
- L. Delrez, A. Santerne, J. M. Almenara, D. R. Anderson, A. Collier-Cameron, R. F. Diaz, M. Gillon, C. Hellier, E. Jehin, M. Lendl, P. F. L. Maxted, M. Neveu-Van Malle, F. Pepe, D. Pollacco, D. Queloz, D. Segransan, B. Smalley, A. M. S. Smith, A. H. M. J. Triaud, S. Udry, V. Van Grootel and R. G. West, Mon. Not. R. Astron. Soc., 2016, 458, 4025–4043 CrossRef CAS.
- K. W. F. Lam, F. Faedi, D. J. A. Brown, D. R. Anderson, L. Delrez, M. Gillon, G. Hebrard, M. Lendl, L. Mancini, J. Southworth, B. Smalley, A. H. M. Triaud, O. D. Turner, K. L. Hay, D. J. Armstrong, S. C. C. Barros, A. S. Bonomo, F. Bouchy, P. Boumis, A. C. Cameron, A. P. Doyle, C. Hellier, T. Henning, E. Jehin, G. King, J. Kirk, T. Louden, P. F. L. Maxted, J. J. McCormac, H. P. Osborn, E. Palle, F. Pepe, D. Pollacco, J. Prieto-Arranz, D. Queloz, J. Rey, D. Segransan, S. Udry, S. Walker, R. G. West and P. J. Wheatley, Astron. Astrophys., 2017, 599, A3 CrossRef.
- I. Hubeny, A. Burrows and D. Sudarsky, Astrophys. J., 2003, 594, 1011–1018 CrossRef CAS.
- J. J. Fortney, K. Lodders, M. S. Marley and R. S. Freedman, Astrophys. J., 2008, 678, 1419–1435 CrossRef CAS.
- T. M. Evans, D. K. Sing, H. R. Wakeford, N. Nikolov, G. E. Ballester, B. Drummond, T. Kataria, N. P. Gibson, D. S. Amundsen and J. Spake, Astrophys. J., Lett., 2016, 822, L4 CrossRef.
- T. M. Evans, D. K. Sing, T. Kataria, J. G. Oyal, N. Nikolov, H. R. Wakeford, D. Deming, M. S. Marley, D. S. Amundsen, G. E. Ballester, J. K. Barstow, L. Ben-Jaffel, V. Bourrier, L. A. Buchhave, O. Cohen, D. Ehrenreich, A. G. Munoz, G. W. Henry, H. Knutson, P. Lavvas, A. L. des Etangs, N. K. Lewis, M. Lopez-Morales, A. M. Mandell, J. Sanz-Forcada, P. Tremblin and R. Lupu, Nature, 2017, 548, 58–61 CrossRef CAS PubMed.
- A. S. C. Cheung, A. W. Taylor and A. J. Merer, J. Mol. Spectrosc., 1982, 92, 391–409 CrossRef CAS.
- A. J. Merer, G. Huang, A. S. C. Cheung and A. W. Taylor, J. Mol. Spectrosc., 1987, 125, 465–503 CrossRef CAS.
- R. S. Ram, P. F. Bernath, S. P. Davis and A. J. Merer, J. Mol. Spectrosc., 2002, 211, 279–283 CrossRef CAS.
- G. I. Huang, A. J. Merer and D. J. Clouthier, J. Mol. Spectrosc., 1992, 153, 32–40 CrossRef CAS.
- A. S. C. Cheung, P. G. Hajigeorgiou, G. Huang, S. Z. Huang and A. J. Merer, J. Mol. Spectrosc., 1994, 163, 443–458 CrossRef CAS.
- O. Hubner, J. Hornung and H. J. Himmel, J. Chem. Phys., 2015, 143, 024309 CrossRef PubMed.
- W. S. Hopkins, S. M. Hamilton and S. R. Mackenzie, J. Chem. Phys., 2009, 130, 144308 CrossRef PubMed.
- H. B. Wu and L. S. Wang, J. Chem. Phys., 1998, 108, 5310–5318 CrossRef CAS.
- J. B. Kim, M. L. Weichman and D. M. Neumark, J. Chem. Phys., 2014, 140, 034307 CrossRef PubMed.
- C. W. Bauschlicher and S. R. Langhoff, J. Chem. Phys., 1986, 85, 5936–5942 CrossRef CAS.
- K. D. Carlson and C. Moser, J. Chem. Phys., 1966, 44, 3259–3265 CrossRef.
- E. Miliordos and A. Mavridis, J. Phys. Chem. A, 2007, 111, 1953–1965 CrossRef CAS PubMed.
- R. W. Jones and J. L. Gole, J. Chem. Phys., 1976, 65, 3800–3802 CrossRef CAS.
- G. Balducci, G. Gigli and M. Guido, J. Chem. Phys., 1983, 79, 5616–5622 CrossRef CAS.
- P. Coppens, S. Smoes and J. Drowart, Trans. Faraday Soc., 1967, 63, 2140–2148 RSC.
- J. B. Pedley and E. M. Marshall, J. Phys. Chem. Ref. Data, 1983, 12, 967–1031 CrossRef CAS.
- W. S. Hopkins, S. M. Hamilton, P. D. McNaughter and S. R. Mackenzie, Chem. Phys. Lett., 2009, 483, 10–15 CrossRef CAS.
- W. S. Hopkins, A. P. Woodham, R. J. Plowright, T. G. Wright and S. R. Mackenzie, J. Chem. Phys., 2010, 132, 214303 CrossRef PubMed.
- W. S. Hopkins, A. P. Woodham, R. J. Plowright, T. G. Wright and S. R. Mackenzie, J. Chem. Phys., 2011, 134, 094311 CrossRef PubMed.
- G. A. Cooper, A. Kartouzian, A. S. Gentleman, A. Iskra, R. van Wijk and S. R. Mackenzie, J. Chem. Phys., 2015, 143, 124302 CrossRef PubMed.
- W. S. Hopkins, A. P. Woodham, N. M. Tonge, A. M. Ellis and S. R. Mackenzie, J. Phys. Chem. Lett., 2011, 2, 257–261 CrossRef CAS.
- I. S. Parry, A. C. Hermes, A. Kartouzian and S. R. Mackenzie, Phys. Chem. Chem. Phys., 2014, 16, 458–466 RSC.
- G. A. Cooper, A. S. Gentleman, A. Iskra and S. R. Mackenzie, J. Chem. Phys., 2017, 147, 013921 CrossRef PubMed.
- E. Wrede, S. Laubach, S. Schulenburg, A. Brown, E. R. Wouters, A. J. Orr-Ewing and M. N. R. Ashfold, J. Chem. Phys., 2001, 114, 2629–2646 CrossRef CAS.
- G. M. Roberts, J. L. Nixon, J. Lecointre, E. Wrede and J. R. R. Verlet, Rev. Sci. Instrum., 2009, 80, 053104 CrossRef CAS PubMed.
- SIMION 8.0, Scientific Instrument Services Inc., USA.
- D. A. Dahl, Int. J. Mass Spectrom., 2000, 200, 3–25 CrossRef CAS.
- M. S. Ford and S. R. Mackenzie, J. Chem. Phys., 2005, 123, 084308 CrossRef PubMed.
- A. M. James, P. Kowalczyk, E. Langlois, M. D. Campbell, A. Ogawa and B. Simard, J. Chem. Phys., 1994, 101, 4485–4495 CrossRef CAS.
- The resolution of the VMI spectrometer is too low to resolve individual spin–orbit components of the electronic states of vanadium and oxygen. Instead, the weighted arithmetic mean energy of the spin–orbit components for a particular electronic state with the corresponding weight standard deviation is considered. The J level energies for V (3d4(5D)4s); a 6DJ = 1/2–9/2 are: 2112, 2153, 2220, 2311, 2425 cm−1. This gives a weighted mean energy of V (a 6D) = 2293 ± 128 cm−1. Similarly for O (3PJ = 2–0): 0, 158, and 227 cm−1. Hence, O (3PJ = 2–0) = 78 ± 119 cm−1.
- A. Kramida, Y. Ralchenko and J. Reader and the NIST ASD Team, with all atomic energies quoted from the NIST Atomic Spectra Database (version 5.6.1) [Online], National Institute of Standards and Technology, Gaithersburg, MD, 2018.
- Z. H. Luo, Y. C. Chang, H. Huang and C. Y. Ng, J. Phys. Chem. A, 2015, 119, 11162–11169 CrossRef CAS PubMed.
Footnote |
| † Electronic supplementary information (ESI) available. See DOI: 10.1039/c9cp02120e |
| This journal is © the Owner Societies 2019 |