
 Open Access Article
 This Open Access Article is licensed under a Creative Commons Attribution-Non Commercial 3.0 Unported Licence
Opening 2,2-diphenyl-2H-chromene to infrared light
Benjamin H.
Strudwick
 a,
Christopher
O’Bryen
a,
Hans J.
Sanders
a,
Sander
Woutersen
*a and
Wybren Jan
Buma
*ab
a,
Christopher
O’Bryen
a,
Hans J.
Sanders
a,
Sander
Woutersen
*a and
Wybren Jan
Buma
*ab
aMolecular Photonics Group, Van’t Hoff Institute for Molecular Sciences, University of Amsterdam, Science Park 904, 1098 XH Amsterdam, The Netherlands. E-mail: S.Woutersen@uva.nl; W.J.Buma@uva.nl
bRadboud University, Institute for Molecules and Materials, FELIX Laboratory, Toernooiveld 7c, 6525 ED Nijmegen, The Netherlands
First published on 20th May 2019
Abstract
Time-resolved vibrational spectroscopy studies are reported on the photoinduced structural dynamics of 2,2-diphenyl-2H-chromene, a prototypical photochromic compound that undergoes ring opening upon UV radiation. The transient IR absorption measurements in combination with (TD-)DFT calculations have been used to understand in detail the life cycle of such compounds. Excited-state decay and ring opening was found to occur on an ultrafast time scale. Three species have been identified in the time-resolved IR spectra with two short-lived species (on a picosecond timescale) and a final long-lived species that remains after the measurable ns delay range. These species have been assigned to various open isomers using quantum chemical calculations of equilibrium structures and force fields. From the experiments and calculations key conclusions can be drawn on previously suggested models for the photocycle of such compounds, as well as on possible ways to controllably influence the performance of these compounds.
1 Introduction
Chromenes are the fundamental subunit of a large range of photochromic molecular materials that have found extensive use in commercial applications ranging from dyes to holograms.1 Upon UV irradiation these uncoloured compounds undergo a ring opening that leads to an open, coloured form which goes through further structural rearrangements as illustrated in Fig. 1 for the compound of interest in the present study. These open forms can revert back to the original closed form by thermal decay or by further photon absorption in the appropriate wavelength range.2,3 The open and closed forms have quite different physical properties, but most notable are their significantly different absorption spectra.1 This difference makes them ideal for various advanced applications such as photochromic glasses and high-density optical storage.1,4 Moreover, they have shown impressive potential for further development as photoswitches in various environments due to their colourability and fatigue resistance, and have thus extensively been studied in this context as well.1–3,5–7 Remarkably, despite this work, as of yet only a very qualitative picture exists of the electronic and accompanying structural evolutions that take place after photon absorption, and even this qualitative picture is still subject of debate. Here, we will employ time-resolved spectroscopic techniques that provide direct electronic and structural fingerprints and thereby allow us to elucidate the key details underlying the photoactivity of these compounds.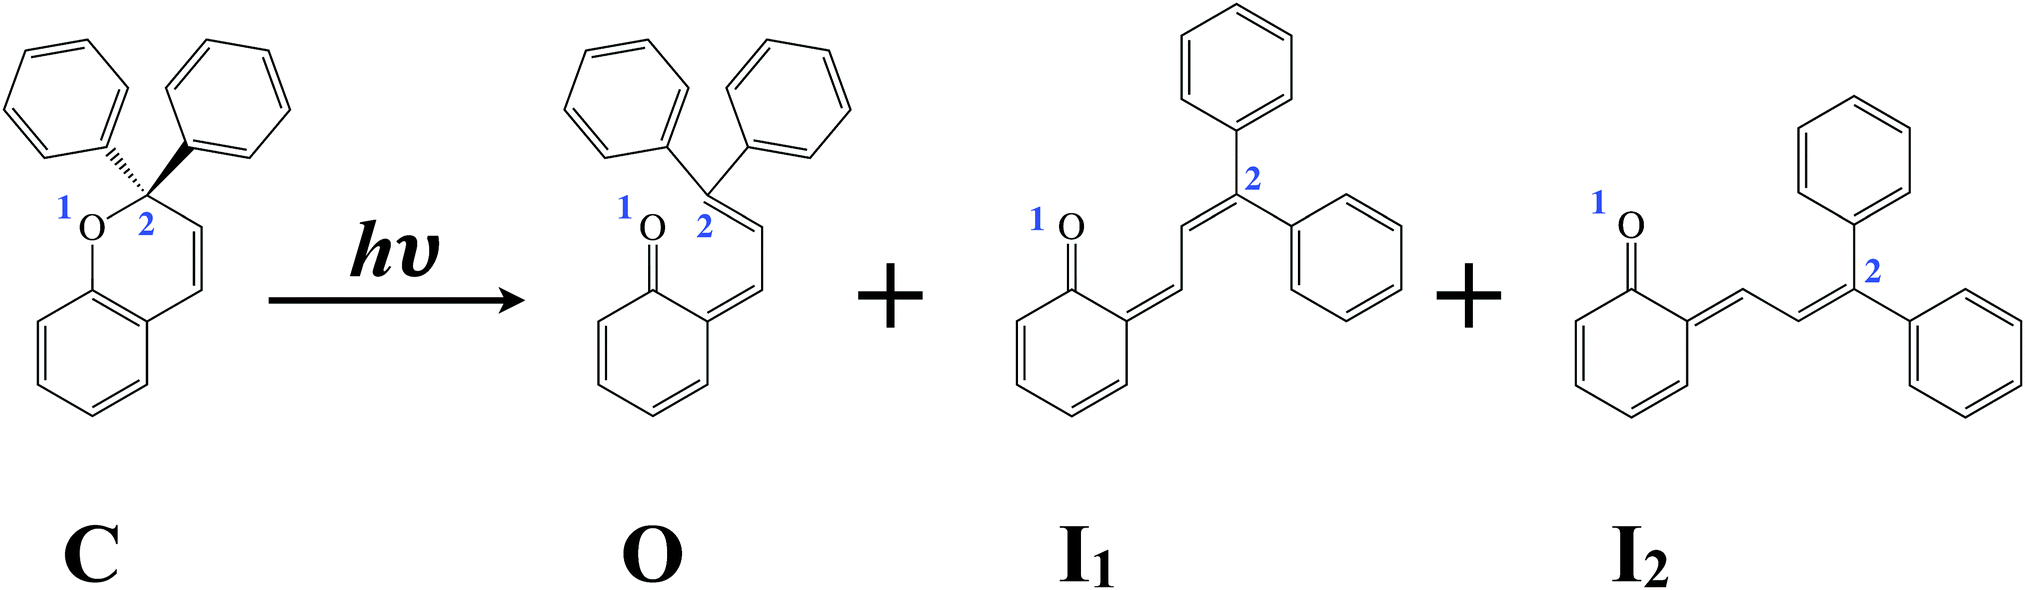 | ||
| Fig. 1 Structure of 2,2-diphenyl-2H-chromene. Upon UV irradiation the closed form of the compound (C) undergoes ring-opening leading to the generation of the indicated photoisomers O, I1, and I2. | ||
In the present study we consider 2,2-diphenyl-2H-chromene (C, Fig. 1), a compound in which the hydrogen atoms on the carbon that undergoes bond rupture (C2) have been replaced by phenyl groups. Substituents on C2 are expected to play an important role in the stability of the molecule and to modulate the excited-state dynamics.8,9 The phenyl substituents cause in this particular case a steric repulsion that lengthens the C2–O1 bond, which may allow for a more efficient ring opening.8,10,11 Transient absorption measurements performed on 2,2-diphenyl-2H-chromene in n-heptane12 show that upon excitation at 267 nm C opens and transforms to one or more photoisomers on a time scale of less than 2 picoseconds. Thermal ring-closure of the open forms has previously been concluded to occur on a timescale slower than milliseconds.13
The excited-state dynamics of compounds related to 2,2-diphenyl-2H-chromene have been extensively investigated using transient absorption spectroscopy.12–17 Such studies have practically all been performed in the visible spectral region because the absorption spectra of the closed and open isomers are quite different and thus easily distinguishable.1 At the same time, it is also recognised that some of the hypothesised intermediates and final photoisomers (vide infra), and in particular the various open forms, have very similar absorption spectra and only differ in their oscillator strengths.14,18,19 As a result, there is still no consensus on the key aspects of the decay pathway, and various models have been put forward to account for the experimental observations made in time-resolved experiments.
Gentili et al.12 concluded from their transient absorption experiments on 2,2-diphenyl-2H-chromene that ultrafast bond-cleavage occurs between O1 and C2 upon excitation, producing an open form with zwitterionic excited-state character. This species then undergoes a barrierless relaxation process that populates the cisoid form O (Fig. 1) in its ground state. O exhibits significant steric repulsions and as a result is subject to further structural isomerization to produce the trans–cis and trans–trans open forms I1 and I2 (Fig. 1). Importantly, however, neither in these experiments nor in other time-resolved experiments on compounds related to 2,2-diphenyl-2H-chromene has it been possible to unambiguously identify the presence of an excited state with zwitterionic character or for that purpose the character of the excited-state species hypothesised to be involved in the decay path at all.
In other studies14,16 it has been suggested that the potential energy surface of the lowest excited state actually features two minima. The first of three reported rate constants would in that case be associated with the decay of the Franck–Condon populated minimum to this second minimum from which subsequently the same path is followed to the ground state as postulated by Gentili et al.12 Herzog et al.15 argued that neither of these two models was able to explain their time-resolved experiments on 2,2-diphenyl-5,6-benzo(2H)-chromene and proposed an alternative model. In this model Franck–Condon excitation is followed by relaxation processes that populate the lowest excited singlet state in a single potential energy minimum that has all the characteristics expected for the closed form, i.e., no ring opening occurs in the electronically excited state. Ring opening in fact was suggested to occur in a concerted process in which the molecule overcomes a small barrier in the excited state to access the conical intersection with the ground state where the O1–C2 bond is broken and the trans–cis and trans–trans open forms are formed without involvement of the cisoid form O.
The above makes clear that the most important aspects of the photochemical ring opening process of chromenes and their subsequent structural evolution, which are key for rational design of novel compounds with tailor-made properties, are still far from clear. These studies invoke questions as to whether bond dissociation occurs in the electronically excited state(s) or upon internal conversion to the ground state, what the electronic characters of the Franck–Condon excited state and subsequent excited-state species are, and which structural evolutions occur on the ground state potential energy surface and with which rate constants. To answer these questions techniques are needed that allow for a much better characterisation of the electronic and conformational structure than the transient absorption techniques employed up until now.
Femtosecond time-resolved vibrational spectroscopy offers such a detailed view. Frequencies and intensities of infrared absorption bands in the mid-IR critically depend on the electronic structure of the molecule and can thus be used to trace the electronic evolution of the molecule, but they also provide a fingerprint of the molecular structure, thereby allowing to follow how the molecule evolves from the closed to open forms and from one open form to other possible open forms.20 We will show that time-resolved IR spectroscopic experiments on 2,2-diphenyl-2H-chromene indeed provide transient IR absorption spectra that show distinct changes over time. Singular value decomposition methods allow us to decompose these spectra in terms of species which are assigned using quantum chemical calculations on ground and excited states of the various closed and open forms. We thereby obtain detailed insight into the various stages during the photochromic lifecycle of 2,2-diphenyl-2H-chromene in particular, and chromenes in general.
2 Experimental
2.1 Synthesis of 2,2-diphenyl-2H-chromene (C)
2,2-Diphenyl-2H-chromene (C): to a solution of phenol (500 mg, 5.3 mmol) in dry dichloromethane (20 ml) was added 1,1-diphenylprop-2-yn-1-ol (1.11 g, 5.3 mmol) and a catalytic amount (one crystal) of p-toluenesulfonic acid monohydrate (Fig. 2). The resulting mixture was stirred for 41 h at RT, after which the conversion was deemed sufficient by TLC. The reaction mixture was diluted with 20 ml petroleum ether 40–60 °C and transferred to a flash column and flash chromatographed (SiO2, gradient CH2Cl2/petroleum ether 40–60 °C − 0/100 → 5/95 → 10/90 → 15/85 → 20/80) to give 0.291 g of C (yield 19%) as a white solid. 1H NMR (400 MHz, CDCl3) δ 7.43 (d, J = 7.3 Hz, 4H), 7.32 (t, J = 7.4 Hz, 4H), 7.25 (t, J = 7.2 Hz, 3H), 7.12 (td, J = 7.9, 1.5 Hz, 1H), 7.00 (dd, J = 7.4, 1.4 Hz, 1H), 6.92 (d, J = 8.0 Hz, 1H), 6.84 (t, J = 7.7 Hz, 1H), 6.61 (d, J = 9.8 Hz, 1H), 6.17 (d, J = 9.8 Hz, 1H); TLC Rf ≈ 0.1 (petroleum ether 40–60 °C).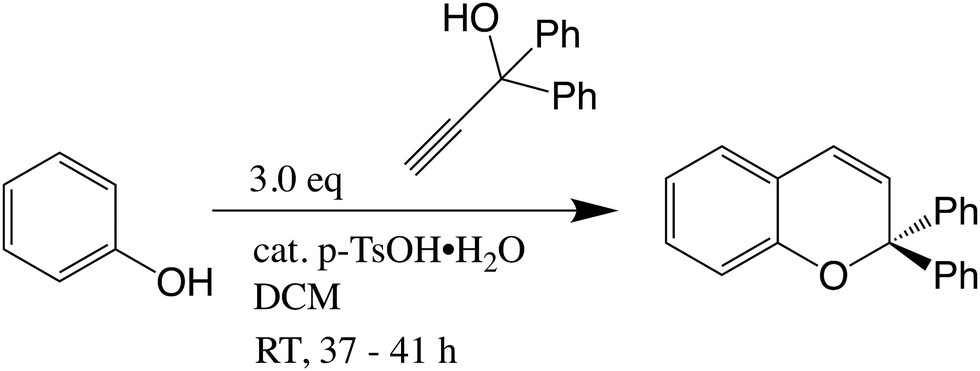 | ||
| Fig. 2 Synthesis of C. | ||
2.2 Sample preparation
For all measurements samples were prepared under an inert atmosphere of dry nitrogen. Deuterated acetonitrile (CD3CN, purchased from Euriso-top) was used as solvent because of its favourable absorption characteristics in the 1400–1800 cm−1 spectral region. The steady-state UV/vis spectrum of 2,2-diphenyl-2H-chromene (Fig. 3) was recorded using a Hewlett Packard 8453 UV/vis spectrophotometer. The steady-state IR absorption spectrum of the compound, shown in Fig. 4, was obtained using a Bruker Vertex 70 FTIR spectrometer. For the time-resolved measurement samples were prepared in the same manner as described above, but with a concentration adjusted to give an absorbance of 0.8 at 320 nm in a sealed IR flow cell equipped with UV-grade CaF2 windows with a 1 mm thick spacing (Specac). | ||
| Fig. 3 Experimentally recorded spectrum of C (red) and the theoretically predicted UV/vis spectrum (blue). | ||
 | ||
| Fig. 4 Orange: FTIR spectrum of C in CD3CN with its associated absorbance axis on the right. Black: theoretically predicted IR absorption spectrum of C in its electronic ground state, broadened with a Gaussian line shape to give a FWHM of 4 cm−1. | ||
2.3 Femtosecond transient spectroscopy
Time-resolved infrared (TR-IR) spectroscopy was performed using a commercially available Ti:sapphire laser (Spectra-Physics Hurricane, 600 μJ, ∼100 fs FWHM). With the amplified output from the laser and an optical setup described previously,21 mid-IR pulses with a duration of ∼200 fs, a bandwidth of 150 cm−1 and an energy of 1–3 μJ at a 1 kHz repetition rate were produced; the mid-IR beam was split with a 50![[thin space (1/6-em)]](https://www.rsc.org/images/entities/char_2009.gif) :50 beamsplitter creating a signal and reference beam for shot-to-shot analysis. UV-pump pulses at 320 nm with an energy of 2 μJ were generated by sum-frequency generation with a type II BBO crystal of the amplified 800 nm output and a 506 nm beam was generated using a commercially available OPA (OPA-800C, Spectra-Physics). The delay between the UV and mid-IR beams was controlled by mechanically adjusting the path length of the UV beam. The UV pump was focused and spatially overlapped with the mid-IR probe (both beams were passed through a 200 μm pinhole with 50% transmission), allowing for a temporal resolution of ∼200 fs (FWHM), determined as described in the literature.20 The signals were recorded using an electronically gated amplifier, an Oriel M260i spectrometer and a 2 × 32-pixel MCT detector. For the measurements the sample was placed in the focus of the mid-IR beam and pumped through the cell to ensure that a fresh sample was measured with each laser shot.
:50 beamsplitter creating a signal and reference beam for shot-to-shot analysis. UV-pump pulses at 320 nm with an energy of 2 μJ were generated by sum-frequency generation with a type II BBO crystal of the amplified 800 nm output and a 506 nm beam was generated using a commercially available OPA (OPA-800C, Spectra-Physics). The delay between the UV and mid-IR beams was controlled by mechanically adjusting the path length of the UV beam. The UV pump was focused and spatially overlapped with the mid-IR probe (both beams were passed through a 200 μm pinhole with 50% transmission), allowing for a temporal resolution of ∼200 fs (FWHM), determined as described in the literature.20 The signals were recorded using an electronically gated amplifier, an Oriel M260i spectrometer and a 2 × 32-pixel MCT detector. For the measurements the sample was placed in the focus of the mid-IR beam and pumped through the cell to ensure that a fresh sample was measured with each laser shot.
2.4 (TD-)DFT calculations
(TD-)DFT calculations were performed at the B3LYP/6-31G(d) level of theory using the Gaussian09 suite of programs.22 Equilibrium geometries and associated force fields were determined for the electronic ground state of the C, O, I1 and I2 isomers. TD-DFT calculations of C were performed to obtain the electronic transitions to the 30 lowest energetic states. The theoretically predicted absorption spectrum has been constructed from stick spectra by convolution with a Gaussian line shape with a FWHM of 0.2 eV and is in excellent agreement with the experimentally recorded spectrum as can be concluded from Fig. 3. For the lowest electronically excited state of C the geometry of the molecule was optimised and the force field was calculated. In all calculations solvent effects were included using the Polarisable Continuum Model23 for acetonitrile. Theoretically predicted IR absorption spectra that will be discussed in the following use frequencies that have been scaled with a scaling factor of 0.97 which has previously been suggested to be appropriate for this level of calculation.243 Results and discussion
Fig. 5 displays TR-IR measurements recorded upon excitation of 2,2-diphenyl-2H-chromene at 320 nm. The two spectral regions shown in Fig. 5 were measured at separate instances and have been reconstructed using SVD filters from the four most significant components.25 Since it was not possible to record spectra with overlapping bands, the intensities in the two panels of Fig. 5 cannot be compared directly, nor is such a comparison possible for the global analysis that will be discussed later (vide infra). However, theoretically predicted spectra indicate that the intensities of bands in the left panel are about an order of magnitude smaller than those in the right panel if the two panels would be normalised to each other (Fig. 8). | ||
| Fig. 5 Time-resolved differential IR absorption spectra of C after being excited with 320 nm radiation in the 1464–1545 and 1572–1653 cm−1 regions with traces having been fitted with a spline. The labelled bands are discussed in the text and Table 1. On top of the two panels the pertaining steady-state IR absorption spectrum is depicted. | ||
Excitation at 320 nm populates the lowest excited singlet state S1 as confirmed by our TD-DFT calculations that find the vertical excitation for this state to be predominantly described by the HOMO → LUMO excitation with an excitation energy and oscillator strength of 4.14 eV (299 nm) and 0.097, respectively. It is worth to notice that in previous transient absorption experiments an excitation wavelength of 267 nm was used.12 Under such conditions a higher-lying singlet state is excited. As a result, the ring-opening process is preceded by internal conversion to the lowest excited singlet state which complicates the analysis of the ensuing ultrafast dynamics. Moreover, internal conversion from this higher-lying singlet state populates S1 with a significant amount of internal energy. If, as suggested previously, energy barriers are present on the potential energy surface of S1, such large amounts of internal energy could lead to incorrect conclusions on the topology of this potential energy surface.
After excitation three negative differential absorption bands labelled 1, 2 and 3 in Fig. 5 which are associated with depletion of the population of C in the ground state are observed at 1498, 1606 and 1637 cm−1, respectively. The two higher-frequency bands align well with the bands of C seen in the steady-state FTIR spectrum (Fig. 4). Interestingly, however, we find that the band at 1498 cm−1 is displaced from the FTIR band of C observed at 1487 cm−1. Upon increasing the time delay between excitation and probe these depletion bands disappear. At early delays (∼1–4 ps) positive differential absorption bands appear at 1489 cm−1 (labelled 4), a double band feature at 1576 and 1594 cm−1 (labelled 5) and another double band feature at 1618 and 1626 cm−1 (labelled 6). These bands evolve at longer delay times into bands 7, 8 and 9 at 1493, 1595 and 1630 cm−1, respectively. Bands 7, 8 and 9 are associated with an intermediate species since they eventually evolve into the bands at 1497, 1605, and 1636 cm−1 (bands 10, 12, and 13). Furthermore, an additional band (labelled 11) grows in at 1534 cm−1 for longer delays. Within the accessible 2 ns delay range bands 10–13 do not decay and can thus be considered as being associated with the final species in the experiment.
Singular Value Decomposition (SVD) of the transient data matrix confirms the presence of three species.25 The transient data matrix has therefore been fitted globally using the open-source program Gloteran26 assuming a sum of three exponential time profiles and a sequential model 1
 | (1) |
In this model the ground state (GS) of C is excited by 320 nm photons (hν) populating species s1. This species decays to species s2, which in turn decays into a final long-lived s3 species. Cross sections of the global fit at various IR frequencies (Fig. 6) demonstrate excellent agreement with the experimental data and lead to values for k1 and k2 of (7 ± 1 ps)−1 and (13 ± 1 ps)−1, respectively. The Species Associated Difference Spectra (SADS) from model 1 are presented in Fig. 7 while Table 1 reports the frequencies of bands in the SADS and TR-IR spectra using the labels introduced above.
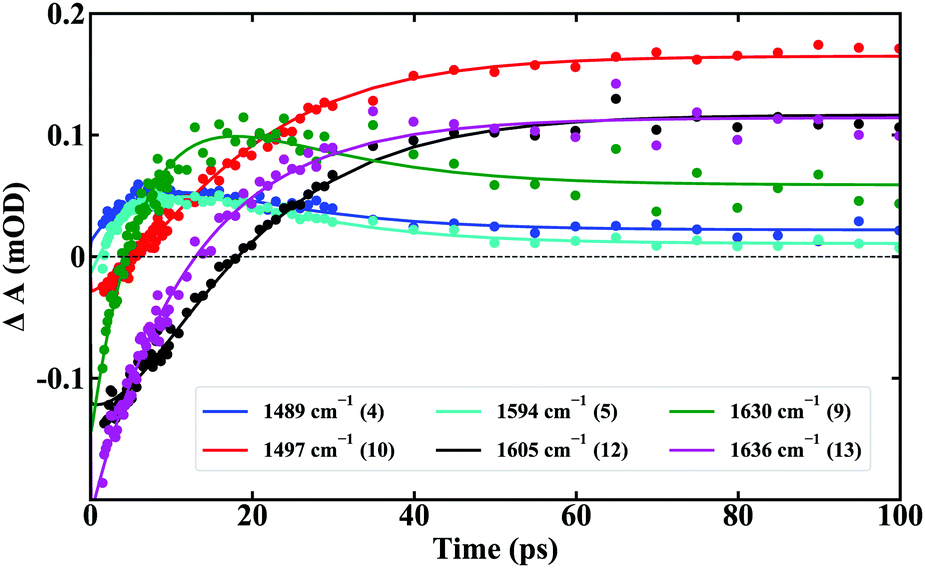 | ||
| Fig. 6 Global fits of time-resolved IR absorption traces at various frequencies corresponding to bands indicated in Fig. 5. | ||
 | ||
| Fig. 7 Species associated difference spectra (SADS) obtained from fits of TR-IR spectra shown in Fig. 5 using a sequential model. SADS have been fitted with a spline. | ||
| Labels | 1st (cm−1) | Labels | 2nd (cm−1) | Labels | 3rd (cm−1) |
|---|---|---|---|---|---|
| 1 | 1498 | 7 | 1493 | 10 | 1497 |
| 2 | 1606 | 8 | 1595 | 11 | 1534 |
| 3 | 1637 | 9 | 1630 | 12 | 1605 |
| 4 | 1489 | 13 | 1636 | ||
| 5 | 1576 | ||||
| 5 | 1594 | ||||
| 6 | 1618 | ||||
| 6 | 1626 |
| Calculated frequencies (cm−1) | ||||
|---|---|---|---|---|
| C | S | O | I 1 | I 2 |
1482 (C![[double bond, length as m-dash]](https://www.rsc.org/images/entities/char_e001.gif) C, st) C, st) |
1509 (C–H, b) | 1480 (CO, st) |
1485 (C–H, b) | 1488 (C–H, b) |
| 1492 (C–H, b) | 1547 (CC, st) |
1562 (C–H, b) | 1498 (CC, st) |
1504 (CC, st) |
| 1494 (C–H, b) | 1571 (CC, st) |
1612 (CC, st) |
1552 (C–H, b) | 1518 (CC, st) |
| 1575 (CC, st) |
1644 (CC, st) |
1599 (CO, st) |
1551 (C–H, b) | |
| 1609 (CC, st) |
1607 (CC, st) |
1603 (CO, st) |
||
| 1653 (CC, st) |
1638 (CC, st) |
1610 (CC, st) |
||
| 1646 (CC, st) |
||||
To identify the different species (TD-)DFT calculations have been performed on the electronic ground and lowest excited singlet state of the closed form as well as on the electronic ground state of the various open forms shown in Fig. 1. Our calculations find that the electronic ground state of the open O, I1, and I2 forms are at higher energies by 18, 14, and 7 kcal mol−1, respectively, compared with C. If these isomers are indeed the ones involved in the structural evolution of 2,2-diphenyl-2H-chromene after ring opening, such energy differences would lead to a sequential target model.
Fig. 8 displays the IR absorption spectra predicted for the various species in the frequency regions studied in the TR-IR experiments with frequencies of relevant modes being reported in Table 1. The good agreement between the experimental IR absorption spectrum of C and the theoretically predicted one (orange and black traces in Fig. 4) provides support for the validity of the predicted spectra of the other species. Fig. 4 shows that the most significant difference between experiment and theory occurs for the highest-frequency band which is predicted at 1653 cm−1 but observed at a slightly lower frequency (1637 cm−1). Analysis of the normal modes leads to the conclusion that the prominent bands observed in this region are either associated with CC bond stretches of the chromene part (1487 and 1637 cm−1), bond stretches within the phenyl groups (shoulder on 1487 cm−1 band), or combinations of phenyl and chromene stretches (1606 cm−1).
 | ||
| Fig. 8 (TD-)DFT calculated IR absorption spectra of 2,2-diphenyl-2H-chromene in the electronic ground and first excited singlet state of the closed form (C (black) and S1 (dotted), respectively), and the ground state of the open forms O (blue), I1 (green) and I2 (red) in the spectral regions measured in the TR-IR experiments shown in Fig. 5. | ||
Our calculations find that 2,2-diphenyl-2H-chromene has a stable minimum on the potential energy surface of the lowest excited singlet state S1 which is in good agreement with the results of previous CASPT2/CASSCF calculations27 on chromenes related to the presently studied one. Inspection of the IR absorption spectrum predicted for S1 (Fig. 8) leads to the conclusion that in the frequency region of interest all modes of interest have shifted to considerably lower frequencies with the most intense modes found at 1509, 1547 and 1571 cm−1. Due to solvent response around zero delay time our experiments can probe the dynamics only for delays larger than about 0.5–1 ps. The observation that the IR absorption spectrum predicted for S1 does not bear any resemblance to the SADS of the first species, which is the first distinguishable species in our experiments, clearly indicates that S1 has decayed on this time scale. This is an important conclusion because in combination with the rate constants observed in the present experiments these observations preclude, at least for 2,2-diphenyl-2H-chromene, a model with two minima on the potential energy surface of the lowest excited state and ps excited-state decays.14,16 Instead, as will be confirmed below, the first SADS must be associated with an isomer in its electronic ground state.
Fig. 8 shows that ring opening has major consequences on the IR absorption spectrum, both in terms of frequencies of dominant bands as well as their intensities which are observed to be significantly larger. Inspection of the modes reveals that they are associated with the CC stretching modes also observed for the closed form. Importantly, however, the CO stretch vibration now becomes heavily mixed into these modes. The fact that the CO stretch participates in several vibrational modes and is not a single isolated mode is unfortunate since otherwise it could have served as an excellent marker for following the ring opening process. Apart from stretch vibrations also CH bending modes are observed to participate. Comparing the spectra of the three open forms, it can be concluded that the IR spectrum of the cisoid isomer O is reasonably distinct from the trans–cisI1 and trans–transI2 isomers; it features bands at 1480, 1562, and 1583 cm−1 that are relatively isolated from analogous bands in the spectra of the other two. I1 and I2, on the other hand, display spectra that are quite similar to one another and as a general trend the more intense bands of I2 are blue-shifted from their counterparts in I1.
Comparison of the SADS in Fig. 7 with the calculated IR absorption spectra in Fig. 8 shows that the first SADS nicely fits the spectrum expected for the cisoid form O. This SADS shows weak positive and negative differential absorption peaks at 1489 and 1498 cm−1 labelled 4 and 1 in Fig. 5, respectively. The DFT calculations find the 1480 cm−1 mode of O in the same spectral region as the 1482, 1492 and 1494 cm−1 modes from C but predict that the O mode has a significant larger intensity than the C modes, which explains the relatively small differential signals seen in this spectral region at early delays in the TR-IR spectrum. Furthermore, the O mode resides 2 cm−1 lower in energy than the most intense C band at 1482 cm−1, which is in line with the experimental TR-IR results in which the induced absorption band 4 has a lower frequency than the bleached band 1 (Δν = 5 cm−1). These differences in frequency and intensity also provide a logical rationale for our previous observation that band 1 in the TR-IR spectra does not coincide with the band observed in the steady-state FTIR spectrum. The same considerations explain the differences in intensity and shape of the negative differential absorption bands 2 and 3 compared with the FTIR bands at 1606 and 1637 cm−1. In particular, we find that the overlap between the calculated 1612 cm−1 mode of O and the 1609 cm−1 mode of C reduces the intensity of band 2, and thus leads to a situation in which the intensity of band 2 is smaller than that of band 3 while the reverse occurs in the FTIR spectrum.
Further support for the assignment of the first SADS to the cisoid form O is provided by the induced double absorption feature at 1618 and 1626 cm−1 in the TR-IR spectrum (band 6). The 1618 cm−1 band is 12 cm−1 higher in frequency than the bleached band 2 at 1606 cm−1, an ordering that is in line with the DFT-calculated frequencies that predict bands for O and C at 1612 and 1609 cm−1, respectively. The presence of the second component of this band at 1626 cm−1 (9 cm−1 lower in frequency than band 3) on the other hand, is in line with the frequency difference of 9 cm−1 calculated for the highest-frequency modes of O and C. Finally, the mode calculated at 1583 cm−1 for O nicely coincides with the induced absorption band 5 at 1576 cm−1.
The second and third SADS show in the lower-frequency panel bands at 1493 and 1497 cm−1, respectively, with a shoulder at lower frequencies. Such a feature is also clearly present in the spectra predicted for I1 and I2. The intensities and shapes (in terms of intensity ratio and frequency difference between shoulder and maximum of the band) of these bands argue for an assignment of the second SADS to I1 and of the third SADS to I2. Such an assignment is consistent with the features of the SADSs observed in the higher-frequency panel. Here the second species displays a band at 1595 cm−1 (band 8 in the TR-IR spectra) which was concluded to derive from an intermediate species. This band is 10 cm−1 lower in frequency than the band at 1605 cm−1 in the SADS of the third species, with both bands being broad and exhibiting a shoulder at lower frequencies. This is exactly as predicted by the DFT calculations on I1 and I2 that show double band features at 1599/1607 cm−1 and 1603/1610 cm−1, respectively.
With this SADS assignment the other observations on the TR-IR spectra made previously can also be rationalized. These spectra showed the disappearance of the ground-state depletion band 2 for longer time delays which logically follows from the coincidence of the 1603/1610 cm−1 band of I2 and the 1609 cm−1 mode of C. Finally, the transition from the second to the third species leads to a transition of band 9 into band 13 in the TR-IR spectra. Indeed, the frequency difference between bands 9 and 13 matches the frequency difference between the highest-frequency bands of I1 and I2.
We thus conclude that the three SADS are associated with the O, I1, and I2 open isomers of 2,2-diphenyl-2H-chromene, and that these species are populated sequentially. For other chromenes it has been concluded previously that an equilibrium exists between the I1 and I2 isomers14–16 but such an equilibrium would clearly be incompatible with the present experimental data as well as the energies calculated for the three isomers. It is worth noticing, however, that the dipole moments of the various closed and open isomers differ significantly. The dipole moment of the closed form C is 1.4 Debye, but for the O, I1, and I2 forms dipole moment of 3.3, 3.9, and 5.9 Debye are calculated. Bearing in mind that the present experiments have been performed in a highly polar solvent (acetonitrile), it might thus very well be that for apolar solvents an equilibrium is ultimately established between I1 and I2. These differences in dipole moment are most probably also (partly) responsible for the differences in dynamics between the present study and the UV/Vis transient absorption studies on 2,2-diphenyl-2H-chromene reported previously.12 In the latter studies decay times of 0.23, 1.1, and 1.4 ps were reported for solutions of 2,2-diphenyl-2H-chromene in n-heptane. In the latter study, however, excitation was performed at 267 nm, thereby exciting a higher-lying singlet state. As a result, internal conversion may also come into play, and conical intersections might become accessible which are more difficult to reach for lower excitation energies.
4 Conclusions
Time-resolved vibrational spectroscopy has been employed to investigate the photochromic ring-opening of 2,2-diphenyl-2H-chromene. The electronic and conformational resolution offered by these experiments has been shown to be a powerful means to unravel the various processes occurring upon photoexcitation of this prototypical compound. Aided by quantum chemical calculations the experimental observations have allowed for a number of key conclusions to be made. Firstly, on a time scale of 0.5–1 ps no evidence is observed for the presence of an excited-state species, neither in a zwitterionic nor in a neutral form. Taking conservative signal-to-noise ratios this implies that internal conversion to the electronic ground state must occur with time constants faster than a few hundred fs, and certainly not on a time scale of ps as hypothesised in the past. Secondly, internal conversion to the ground state occurs exclusively to an open cisoid isomer, and not via a concerted process that breaks the O1–C2 bond and directly populates the trans–cis and trans–trans open isomers. The latter two isomers, in contrast, are formed in a sequential process from the cisoid isomer in which first the trans–cis isomer is formed with a time constant of 7 ps, and from this isomer the trans–trans isomer with a time constant of 13 ps. Thirdly, the open isomers accessed upon relaxation from the cisoid isomer do not exhibit a conformational equilibrium. It is the trans–trans isomer that is the final species in the experiments, and it is from this species that subsequent structural relaxation to the closed isomer occurs (but on much longer time scales than the time scale investigated here). Finally, calculations and experiments indicate that the various closed and open isomers have significantly different dipole moments. These differences could be an excellent starting point for tailoring the dynamics of these compounds to specific applications.The present experiments have not yet been able to ‘catch’ the molecule in the act of bond-breaking. They have, however, provided a solid starting point for further experiments with higher time resolution that specifically focus on aspects where this process might be put into the full light of spectroscopic techniques. Such experiments are presently underway.
Conflicts of interest
There are no conflicts to declare.Acknowledgements
This work was supported by the Nederlandse Organisatie voor Wetenschappelijk Onderzoek (NWO) (NWO Project No. 712.013.002). SW kindly acknowledges the John van Geuns Foundation for financial support.References
- H. Bouas-Laurent and H. Dürr, Pure Appl. Chem., 2001, 73, 639–665 CAS.
- Organic Photochromic and Thermochromic Compounds, in Main Photochromic Families, ed. R. J. C. Crano, and R. J. Gugielmetti, Springer, 1999, vol. 1 Search PubMed.
- H. Dürr and H. Bouas-Laurent, Photochromism: Molecules and Systems, Amsterdam: Elsevier, 2003 Search PubMed.
- M. Russew and S. Hecht, Adv. Mater., 2010, 22, 3348–3360 CrossRef CAS PubMed.
- G. Ellis, I. Lockhart and D. S. E. Meeder-Nyez, Chromenes, Chromanones and Chromones, 1977, pp. 1–82 Search PubMed.
- R. Pratap and V. Ram, Chem. Rev., 2014, 114, 10476–10526 CrossRef CAS PubMed.
- T. Nakabayashi, N. Nishi and H. Sakuragi, Sci. Prog., 2001, 82, 137–156 CrossRef.
- S. Aldoshin, I. Chuev, O. Filipenko, A. Utenshev, G. Harie, V. Lokshin, A. Samat, R. Gugielmetti and G. Pepe, Russ. Chem. Bull., 1998, 47, 1129–1135 Search PubMed.
- M. Sakuragi, Y. Kawanishi, Y. Suzuki and H. Sakuragi, Bull. Chem. Soc. Jpn., 2008, 81, 641–643 CrossRef CAS.
- A. Padwa, G. Lee and W. Owens, J. Org. Chem., 1975, 40, 1142–1149 CrossRef CAS.
- F. Ortica, L. Bougdid, C. Moustrou, U. Mazzucato and G. Favaro, J. Photochem. Photobiol., A, 2008, 200, 287–293 CrossRef CAS.
- P. L. Gentili, E. Danilov, F. Ortica, M. A. J. Rodgers and G. Favaro, Photochem. Photobiol. Sci., 2004, 3, 886–891 RSC.
- Y. Kodama, T. Nakabayashi, K. Segawa, E. Hattori, M. Sakuragl, N. Nlshi and H. Sakuragi, J. Phys. Chem. A, 2000, 104, 11478–11485 CrossRef CAS.
- B. Moine, J. Réhault, S. Aloïse, J. C. Micheau, C. Moustrou, A. Samat, O. Poizat and G. Buntinx, J. Phys. Chem. A, 2008, 112, 4719–4726 CrossRef CAS PubMed.
- T. T. Herzog, G. Ryseck, E. Ploetz and T. Cordes, Photochem. Photobiol. Sci., 2013, 12, 1202–1209 RSC.
- B. Moine, G. Buntinx, O. Poizat, J. Rehault, C. Moustrou and A. Samat, J. Phys. Org. Chem., 2007, 20, 936–943 CrossRef CAS.
- C. Böttcher, G. Zeyat, S. A. Ahmed, E. Irran, T. Cordes, C. Elsner, W. Zinth and K. Rueck-Braun, Beilstein J. Org. Chem., 2009, 5, 25 Search PubMed.
- G. Ottavi, G. Favaro and V. Malatesta, J. Photochem. Photobiol., A, 1998, 115, 123–128 CrossRef CAS.
- H. Görner and A. K. Chibisov, J. Photochem. Photobiol., A, 2002, 149, 83–89 CrossRef.
- M. R. Panman, P. Bodis, D. J. Shaw, B. H. Bakker, A. C. Newton, E. R. Kay, D. A. Leigh, W. J. Buma, A. M. Brouwer and S. Woutersen, Phys. Chem. Chem. Phys., 2012, 14, 1865–1875 RSC.
- A. Huerta-Viga, D. J. Shaw and S. Woutersen, J. Phys. Chem. B, 2010, 114, 15212–15220 CrossRef CAS PubMed.
- M. J. Frisch, G. W. Trucks, H. B. Schlegel, G. E. Scuseria, M. A. Robb, J. R. Cheeseman, G. Scalmani, V. Barone, B. Mennucci, G. A. Petersson, H. Nakatsuji, M. Caricato, X. Li, H. P. Hratchian, A. F. Izmaylov, J. Bloino, G. Zheng, J. L. Sonnenberg, M. Hada, M. Ehara, K. Toyota, R. Fukuda, J. Hasegawa, M. Ishida, T. Nakajima, Y. Honda, O. Kitao, H. Nakai, T. Vreven, J. A. Montgomery, J. J. E. Peralta, F. Ogliaro, M. Bearpark, J. J. Heyd, E. Brothers, K. N. Kudin, V. N. Staroverov, R. Kobayashi, J. Normand, K. Raghavachari, A. Rendell, J. C. Burant, S. S. Iyengar, J. Tomasi, M. Cossi, N. Rega, J. M. Millam, M. Klene, J. E. Knox, J. B. Cross, V. Bakken, C. Adamo, J. Jaramillo, R. Gomperts, R. E. Stratmann, O. Yazyev, A. J. Austin, R. Cammi, C. Pomelli, J. W. Ochterski, R. L. Martin, K. Morokuma, V. G. Zakrzewski, G. A. Voth, P. Salvador, J. J. Dannenberg, S. Dapprich, A. D. Daniels, A. Farkas, J. B. Foresman, J. V. Ortiz, J. Cioslowski and D. J. Fox, Gaussian 09 Revision D.01, Gaussian Inc., Wallingford CT, 2009 Search PubMed.
- J. Tomasi, B. Mennucci and R. Cammi, Chem. Rev., 2005, 105, 2999–3094 CrossRef CAS PubMed.
- A. P. Scott and L. Radom, J. Phys. Chem., 1996, 100, 16502–16513 CrossRef CAS.
- E. R. Henry, Biophys. J., 1997, 72, 652–673 CrossRef CAS PubMed.
- J. J. Snellenburg, S. P. Laptenok, R. Seger, K. M. Mullen and I. H. M. van Stokkum, J. Stat. Softw., 2012, 49, 1–22 Search PubMed.
- A. Migani, P. L. Gentili, F. Negri, M. Olivucci, A. Romani, G. Favaro and R. S. Becker, J. Phys. Chem. A, 2005, 109, 8684–8692 CrossRef CAS PubMed.
| This journal is © the Owner Societies 2019 |