
 Open Access Article
 This Open Access Article is licensed under a
 Creative Commons Attribution 3.0 Unported Licence
Controlling intramolecular hydrogen migration by asymmetric laser fields: the water case
Emmanouil
Kechaoglou
,
Spyridon
Kaziannis
and
Constantine
Kosmidis
 *
*
Department of Physics, University of Ioannina, Ioannina, Gr-45110, Greece. E-mail: kkosmid@uoi.gr
First published on 9th May 2019
Abstract
Hydrogen and deuterium intramolecular migration in water's isotopomer dications has been found to depend on the wavelength of the laser used for the excitation. This is imprinted in H2+ and D2+ fragment ions’ observation in the mass spectra induced by single color fs laser irradiation with 800 nm ≤ λ ≤ 1570 nm. Based on these findings, experiments with ω/2ω asymmetric laser fields (1400/700 nm) have been performed. The dissociation channels of the dications exhibit different dependence on the phase between the ω and 2ω components of the field thus offering an ability for controlling the fragmentation. For the interpretation of these observations, a tunneling mechanism is invoked.
Introduction
Ultrashort laser pulses offer the ability to probe ultrafast processes on the time scale of molecular motions.1 At the same time, the electric field of these pulses can be strong enough to modify the molecular potential energy surfaces which are crucial parameters as far as the fate of the molecular processes is concerned.2,3 This close relation of the induced distortion of the molecular states and their evolution emerges the possibility to control molecular processes by changing the laser pulse characteristics. Among the techniques targeting this issue are those employing pulses of few-cycle duration, which are inherently asymmetric or two color (ω/2ω) fields of multi-cycle duration. In the first case, the spatial asymmetry varies as a function of the Carrier Envelope Phase (CEP),4–6 while in the latter by changing the relative phase of the field components.7–11 The two-color scheme was initially introduced by Brumer and Shapiro.12,13 However, their methodology is conceptually different since it is based on the combined action of two monochromatic fields with commensurable frequencies and exploits the quantum interference of the two-associated pathways towards the common final state to exert control on its population.Molecular isomerization,14–16 and in particular intramolecular hydrogen migration,17,18 is one of the molecular processes that can be affected under asymmetric laser irradiation. Due to the light mass of the H, its migration along the molecular skeleton can be fast and completed within a few fs19i.e. within the pulse duration. H-migration is of fundamental importance for a very broad variety of scientific areas such as astrophysics, chemistry and biology. Furthermore, H-liberation from molecules is regarded as one of the replacements for conventional energy sources.
Our group has extensively applied ω/2ω asymmetric laser fields in conjunction with a time-of-flight mass spectrometry technique in order to explore the ability to identify different molecular dissociation channels leading to fragments with the same mass and kinetic energy, the participation (or not) of metastable states in these processes, and the directional bond fragmentation and for probing the intramolecular H-migration.10,11,20
In this work, we are focusing on the fragmentation of water molecules in the gas phase. Beyond the obvious significance of H2O, this molecule is thought of as a prototype system for unimolecular fragmentation studies.
Especially, the dissociation from ionic states of H2O leading to H2+ ejection has attracted extensive experimental and theoretical effort. H2+ formation has been reported as a result of H2O ionization induced by fast electrons21,22 or ion impact,23 strong laser fields24 and free electron lasers.25 The formation of H2+ prerequisites atomic rearrangement and by using ultrashort laser pulses, it is concluded that this process takes place within the pulse duration (<10 fs) from the doubly ionized parent molecule.26 It has been established that the doubly ionized parent molecule fragments follow two dissociation routes:
| H2O2+ → H+ + OH+ | (1) |
| → H2+ + O+ | (2) |
McCracken et al. reported that channel (2) was not detected in their experiments on D2O conducted using 40 fs laser pulses at 800 nm and intensity within the 7 × 10¹⁴–2 × 10¹⁵ W cm−2 range.27 This observation is in agreement with the threshold intensity (2 × 10¹⁵ W cm−2) that Rajgara et al. have defined for the appearance of the H2+ ionic signal.24 More recently, Mathur et al.26 have reported HD+ formation from HOD2+ fragmentation at lower laser intensities (1 × 10¹⁵ W cm−2) at 800 nm but with laser pulses of <10 fs duration, which are significantly shorter in time and at the same time broader in terms of spectral content with respect to the multi-cycle case.
Our aim in the present work is twofold. Firstly, to investigate if the lower intensity threshold reported for the shorter laser pulses reveals a dependence of H-migration on the spectral bandwidth which is expected to increase for shorter pulses. And secondly, to elucidate the possibility for preferential bond breaking by controlling the phase of a ω/2ω asymmetric laser field, which remains always a formidable challenge.
Therefore, the exploration of the ability to control the intramolecular H-migration and dissociation of the water molecule beyond the per se fundamental interest can reveal the potential of ω/2ω asymmetric laser fields as a useful experimental tool in chemical physics.
Experimental details
Two sets of experiments have been performed. Initially, the mass spectra of H2O and D2O induced by a single laser beam have been recorded by means of a Time-of-Flight (ToF) mass spectrometer. A 20 fs pulsed Ti:Sapphire laser with a 1 kHz repetition rate was used for the experiments at 800 nm. In order to produce tunable near-IR pulses, part of the 800 nm beam (3 mJ energy per pulse) is fed into an optical parametric amplifier (OPA). The tunable output beams have central wavelengths that range from 1220 nm to 1570 nm. The pulse duration was carefully determined for each wavelength used and varies from 32 fs to 60 fs. The pulse energy was measured just before the entrance window of the ToF mass spectrometer and the calibration of the laser intensity in the interaction region is based on multiple ionization of noble gases and especially the recorded ratio of the ionic signal corresponding to different charge states as a function of the energy per pulse.28The experiments with the asymmetric ω/2ω laser field were performed at 1400/700 nm. The electric field, in this case, is described by the equation: E(t) = E0(t)[cos(ωt) + γ![[thin space (1/6-em)]](https://www.rsc.org/images/entities/char_2009.gif) cos(2ωt + φ)], where E0(t) is the pulse envelope, γ is the ratio of the electric field strengths and φ is the phase difference between the two colors. The pulse duration of the beam at 1400 nm was measured to be 40 fs. The 1400 nm beam propagates through a BBO crystal (200 μm thick) in order to produce its second harmonic which is initially separated in order to control the phase between the beams and then recomposed with the fundamental by passing through a set of dichroic mirrors. The phase control is achieved by rotating a calcite plate (1.6 mm thick, cut angle 55°) by intervals of 0.02° resulting in the phase steps of 30.5 ± 0.6°. Two neutral density filters can manipulate the intensity of each beam, ensuring control over the total intensity and the γ parameter. The two beams are then focused by a silver-coated spherical mirror of 7.5 cm focal distance located in the homemade Wiley–McLaren ToF-mass spectrometer. A detailed description is given elsewhere.29 The resulting tunable total intensities range from 1–7 × 10¹⁴ W cm−2 and the γ parameter from 0.3–1. The resulting ionic signal is measured by a Chevron-type micro-channel detector and recorded by an Ultrafast Multiscaler card (FASTComTec, Model TOF P7888) which has a 1 ns time resolution. The ambient pressure of the chamber was around 1.8 × 10⁻⁷ mbar, while the pressure was kept around 5 × 10⁻⁷ mbar during the experiments. The D2O used was produced by Sigma-Aldrich (99.9% D atoms) and the substance flow was controlled via a needle valve with continuous flow.
cos(2ωt + φ)], where E0(t) is the pulse envelope, γ is the ratio of the electric field strengths and φ is the phase difference between the two colors. The pulse duration of the beam at 1400 nm was measured to be 40 fs. The 1400 nm beam propagates through a BBO crystal (200 μm thick) in order to produce its second harmonic which is initially separated in order to control the phase between the beams and then recomposed with the fundamental by passing through a set of dichroic mirrors. The phase control is achieved by rotating a calcite plate (1.6 mm thick, cut angle 55°) by intervals of 0.02° resulting in the phase steps of 30.5 ± 0.6°. Two neutral density filters can manipulate the intensity of each beam, ensuring control over the total intensity and the γ parameter. The two beams are then focused by a silver-coated spherical mirror of 7.5 cm focal distance located in the homemade Wiley–McLaren ToF-mass spectrometer. A detailed description is given elsewhere.29 The resulting tunable total intensities range from 1–7 × 10¹⁴ W cm−2 and the γ parameter from 0.3–1. The resulting ionic signal is measured by a Chevron-type micro-channel detector and recorded by an Ultrafast Multiscaler card (FASTComTec, Model TOF P7888) which has a 1 ns time resolution. The ambient pressure of the chamber was around 1.8 × 10⁻⁷ mbar, while the pressure was kept around 5 × 10⁻⁷ mbar during the experiments. The D2O used was produced by Sigma-Aldrich (99.9% D atoms) and the substance flow was controlled via a needle valve with continuous flow.
Results and discussion
In Fig. 1(a) the part of the mass spectrum of H2O corresponding to the H2+ fragment ion recorded at λ = 800 nm is presented. As expected, the ion signal assigned to the H2+ consists of many components which correspond to different dissociation channels and to ions ejected towards and backwards with respect to the ion detector. The kinetic energy of the fragments can be estimated by taking into account the temporal delay (Δt) between the backward and forward peak components:30where Δt is expressed in ns, F is the static electric field in the acceleration region of ToF in V cm−1, n is the charge and m is the fragment mass in amu.

 | ||
| Fig. 1 Part of ToF spectra of water's isotopomers recorded at 800 nm. The areas corresponding to H2+ (a) and to D2+ (b) ions are depicted. The ionic signal axis in (b) is presented magnified (×1.5). | ||
We, hereafter, focus on the molecular hydrogen (H2+ and D2+) mass spectra peak profiles, which are presented in Fig. 1(a) and (b) at two different laser intensities.
For the case of H2+ at ∼3.5 × 10¹⁵ W cm−2 high kinetic energy fragments (Ekin > 7.9 eV) are clearly observed and they can be attributed to a Coulomb explosion process of triply charged parent ions. This is in agreement with the study done by Hong et al.31 and the fact that the O2+ fragments of Ekin = 1.1 ± 0.2 eV are also recorded which is consistent with that predicted by momentum conservation for a two-body (H2+, O2+) dissociation channel. The intensity threshold for the particular channel is found to be ∼1.3 ± 1015 W cm−2 at 800 nm, while the corresponding ponderomotive energy (Up (eV) = 9.33 × 10⁻¹⁴I (W cm−2) λ2 (μm)) is evaluated to be ∼78 eV in accordance with the energy threshold determined by the electron impact experiments.32 It should be noted that there is no clear peak component with a kinetic energy around 4.8 eV, which is known to originate from the dissociation channel (2) even though the irradiation conditions are similar to the intensity threshold reported by Rajgara et al.24 More strikingly, the peak components that could be assigned to the high kinetic D2+ ions are absent from the D2O mass spectra in contrast to the H2O case.
Both of these observations seem to be in agreement with the recent work presented by McCracken et al.27 where it was found that double ionization is significantly less probable than the triple ionization for the case of D2O at similar irradiation conditions with the present work. Furthermore, as seen in Fig. 1(a) and (b), lower laser intensities do not reveal the second dissociative channel. However, the complete absence of high kinetic energy components from the D2+ mass spectra peak profile originating from D2O3+, contrary to the H2+ case, highlights a strong isotopic effect in the production efficiency of the particular two-body dissociation channel.
In Fig. 2(a), the part of the H2O mass spectra corresponding to the H2+ ions recorded at different near-IR laser wavelengths (λ = 1220 nm, 1300 nm, 1400 nm, 1500 nm and 1570 nm) are presented. The H2+ ions are produced with a remarkable kinetic energy meaning that their origin should be attributed to a fragmentation process within multiple charged parent ions, i.e. they are not molecules degassed from the water sample. In particular, H2+ with 4.8 ± 0.2 eV kinetic energy are recorded and are expected to be released via channel (2). Moreover, their appearance seems to be aided by longer wavelengths, since the laser intensity needed for their observation decreases as the wavelength increases, whilst the working pressure was constant (P = 5 × 10⁻⁷ mbar). At first glance, the latter could be attributed to the dependence on λ2 of the ponderomotive energy (Up), but this is not the case since the estimated Up also decreases. For instance, the estimated Up values corresponding to the intensity thresholds at 1220 nm and 1570 nm are found to be 75 eV and 55 eV, respectively.
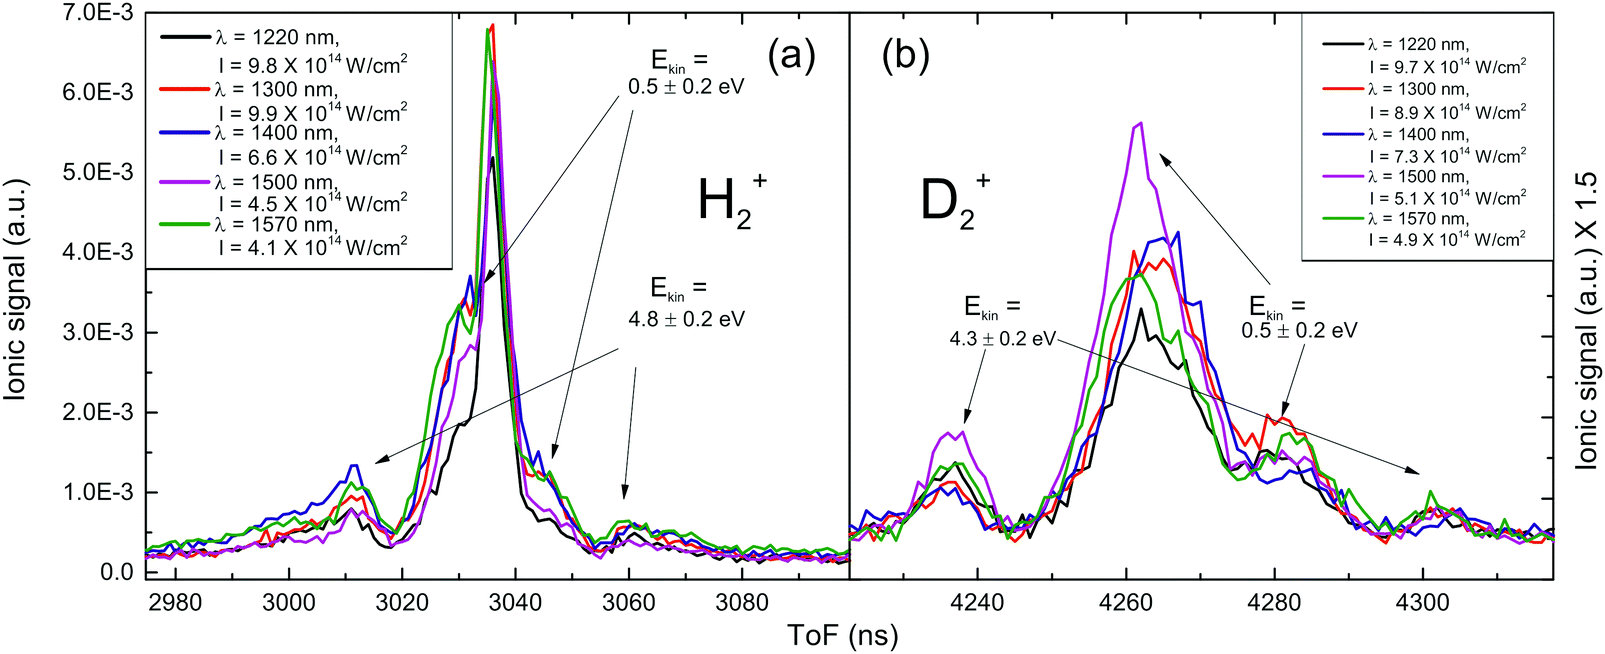 | ||
| Fig. 2 ToF spectra recorded at different wavelengths of near-IR. (a) H2+ spectrum, where the peaks corresponding to the dissociation of H2O2+ and H2O+ are noted. (b) D2+ spectrum, magnified by 1.5 for scale. The peaks that are mentioned in (a) emerge using the near-IR pulses. | ||
In Fig. 2(b), the same part of the mass spectrum of D2O is depicted. It is impressive that highly kinetic energy D2+ fragments (Ekin ∼ 4.3 ± 0.2 eV) are recorded for all the wavelengths used in the 1220–1570 nm range, while this was impossible for the 800 nm experiments, even though the maximum available intensity in the latter case is much higher. The Ekin = 4.3 eV value implies that these ions are produced through the dissociation route (2), since the total kinetic energy release (EkinD2+ and EkinO+ ∼ 5.4 eV) is the same as the one measured for the H2O case, within the experimental error. It is worth noting that the intensity thresholds for the observation of this fragmentation channel in D2O are decreasing for longer laser wavelengths, and their values are almost identical to those recorded for the H2O case.
As far as the production of O2+ ions from H2O3+ and D2O3+ is concerned, we found that although their intensity thresholds (Ithr) decrease at longer wavelengths (at λ = 800 nm the Ithr = 1.25 × 10¹⁵ W cm−2, while at λ = 1570 nm Ithr = 3.3 × 10¹⁴ W cm−2) the corresponding ponderomotive energy remains constant within all the spectral regions studied. The estimated value is Up = 75 eV, which is in absolute agreement with that determined by the electron impact technique.18 Therefore, it is reasonable to attribute the triple ionization of the parent molecules to an optical field ionization mechanism instead of a multiphoton ionization process.
From the above presented data, it is reasonable to conclude that: (i) the H-migration in H2O takes place before the molecular fragmentation, (ii) D-migration is also a probable process in the D2O2+ ions and (iii) these migration processes are dependent on laser wavelength; actually the abundance of the fragments released by channel (2) increases at the longer wavelengths used.
In order to further clarify the physical mechanism underlying the dissociation channel (2), we performed additional experiments using asymmetric laser fields at 1400/700 nm. At λ = 1400 nm, the available equipment ensures the production of the second harmonic beam with the required intensity. Moreover, for this ω/2ω field, we have recently performed experiments on CO molecules.29 The CO molecule is considered a prototype case in the related field of research.33,34 Therefore, it is used for the calibration of the Calcite plate's rotational angle in terms of the ω/2ω relative phase (30.6° per step, see Fig. 3). The advantage that the usage of the ω/2ω laser fields offers is the ability to interact selectively with molecules with the dipole moment aligned with the laser polarization vector and at the same time oriented with the laser electric field asymmetry. This facilitates the identification of the dissociation channels and often reveals information about the involved mechanisms.
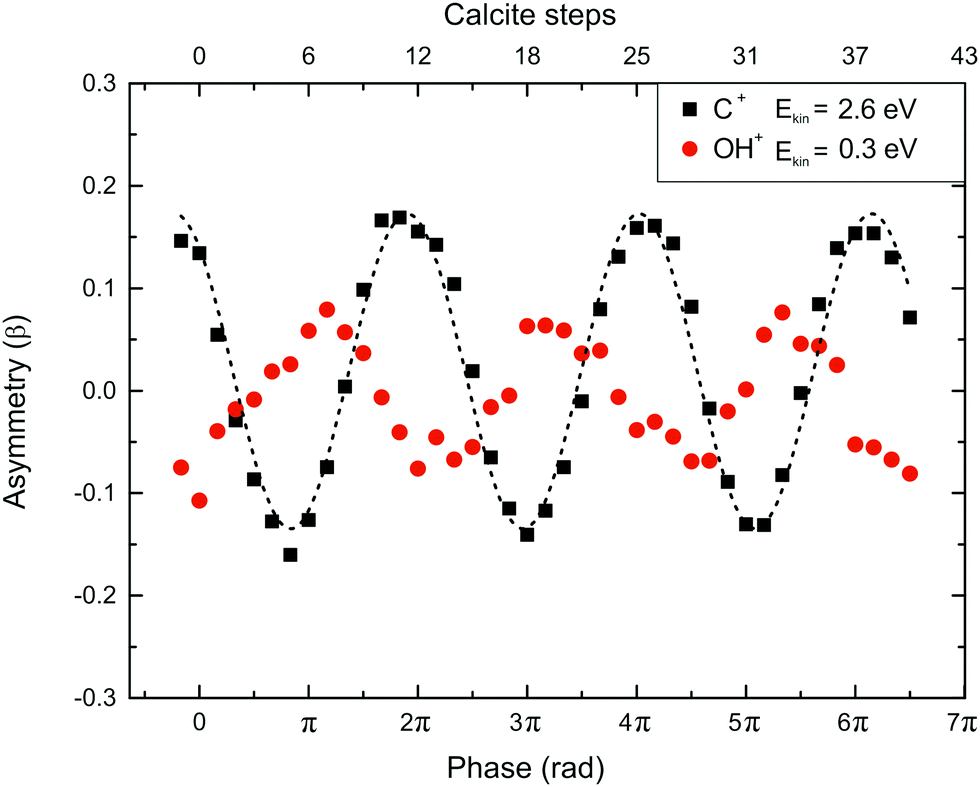 | ||
| Fig. 3 Asymmetry parameter (β) measurement and calibration of the calcite's plate rotation. The dotted line is used for eye-guiding purposes only. The C+ fragment is produced from the CO2+ dissociation recorded simultaneously with the H2O mass spectra induced by a 1400/700 nm asymmetric laser field (I = 5 × 10¹⁴ W cm−2 and γ = 0.76). | ||
As mentioned above, the phase difference between the two laser beams (ω,2ω) was introduced by fine-tuning of a calcite plate. For the H2O/D2O experiments, the phase calibration is done by simultaneously introducing CO in the interaction region and measuring fragments from both the water target molecule and the CO reference one. The measured asymmetry parameter (β) is defined by the relation:

The dependence of the asymmetry parameter (β) on the calcite plate angle for the C+ ions with Ekin = 2.6 eV released from the CO dissociation is presented (Fig. 3) along with that of the OH+ (Ekin = 0.3 eV) fragment of H2O. This dependence allows the calibration of the calcite plate angle in terms of the phase difference in rad. In particular, for the phase difference zero (or nπ, where n an even number) the asymmetry of the C+ ion production increases which implies that the maximum of the intensity of the asymmetric field is pointed towards the O atom, i.e. the electronic cloud is removed in the C side of the oriented CO molecules.33,34 Obviously, the situation is completely altered at the π (or at (n + 1) π) phase difference.
Having calibrated the induced phase difference between the two laser (1400/700 nm) beams, we recorded the phase dependence of the two dissociation channels of the doubly charged parent ions. In Fig. 4a, the phase dependence of the asymmetry for the component of the fragment ions H+ with Ekin = 4.8 eV and OH+ with Ekin = 0.3 eV is presented. These ions are released via channel (1) since the ratio of their kinetic energy is that expected by the aforementioned two-body dissociation. The same conclusion is further supported by the dependence of their asymmetry on the ω/2ω phase, presenting maximum values with a phase lag of π, which indicates that the specific fragments are released towards opposite directions. The analogous dependencies of the fragment components H2+ with Ekin = 4.8 eV and O+ with Ekin = 0.6 eV that are generated from the dissociation route (2), are presented in Fig. 4b. Clearly, there is a phase dependence but the interesting point is that the amplitude for the asymmetry parameter β values is increased.
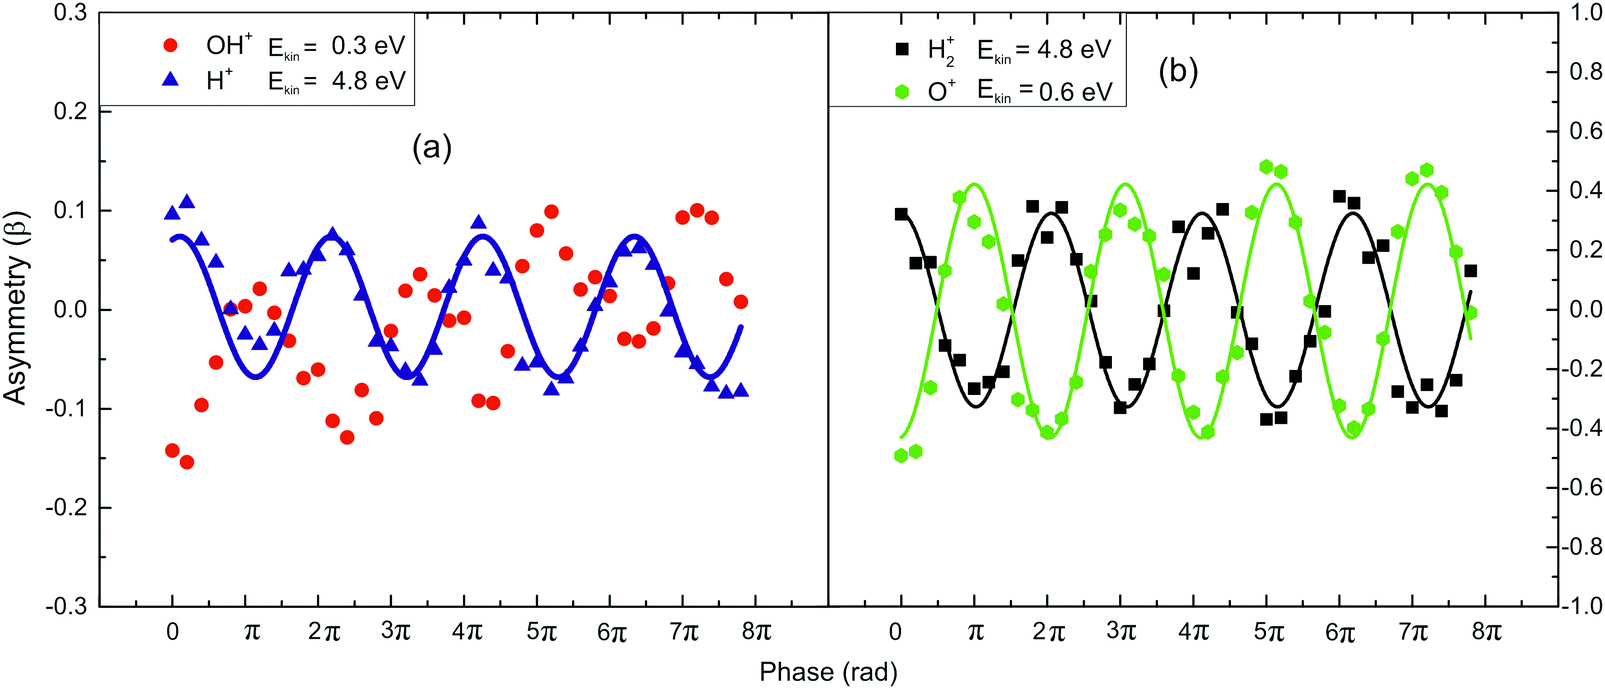 | ||
| Fig. 4 Asymmetry parameter (β) measurements for the H2O2+ fragment field (I = 5 × 10¹⁴ W cm−2 and γ = 0.76). The lines are only used for eye-guiding purposes. (a) The fragments arising in accordance with channel (1) and (b) for those of channel (2). | ||
In Fig. 5a, the asymmetry phase dependencies for the pairs of fragments OD+ (Ekin = 0.5 eV) and D+ (Ekin = 4.4 eV) (Fig. 5a) and for D2+ (Ekin = 4.3 eV) and O+ (Ekin = 1.1 eV) (Fig. 5b) released from the dissociation of D2O2+ are presented. It is obvious that the fragments exhibit the same dependence observed for the water molecule but the range within which the asymmetry parameter value varies is larger. It should be noted that the mass spectra of Fig. 4 and 5 were recorded under the same experimental conditions (I = 5 × 10¹⁴ W cm−2, γ = 0.76).
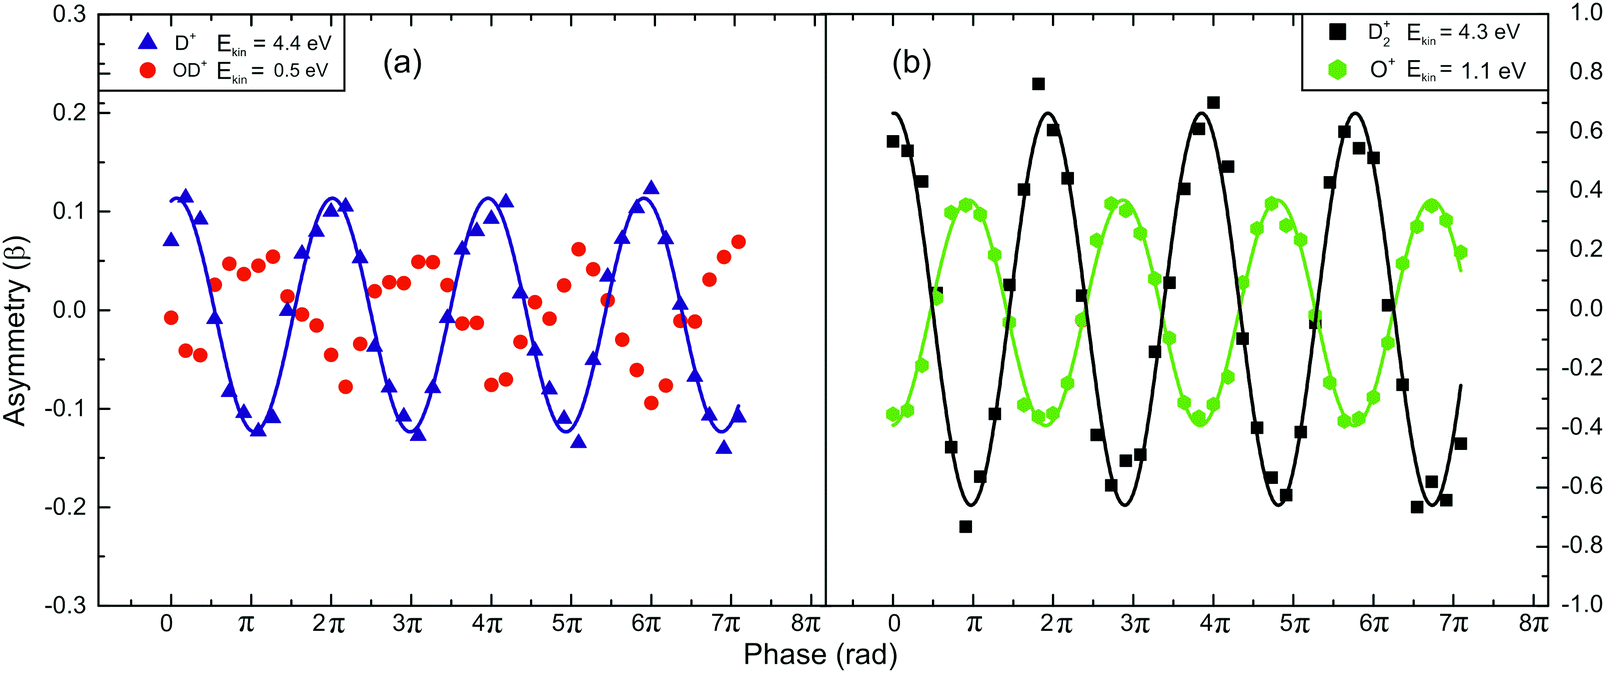 | ||
| Fig. 5 Asymmetry parameter (β) measurements of the fragments following D2O2+ dissociation (I = 5 × 10¹⁴ W cm−2 and γ = 0.76). The lines are used for eye-guiding purposes only: (a) the fragments of channel (1), and (b) the fragments of channel (2). | ||
The fact that the fragments ejected via the dissociation channel (2) exhibit large variation of the β parameter values on the phase difference, implies that this channel is strongly dependent on the laser field asymmetry. Moreover, the larger variation of the β parameter values for the D2O case reveals an isotopic effect.35
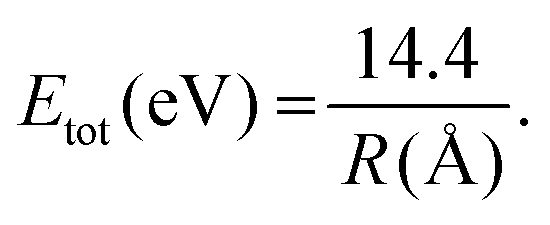
Garg et al. made dynamic calculations for H2O2+ and they focused on the dissociation channel that leads to the formation of H2+ and O+.36 Their study shows that for θ = 175° (the angle θ is in the Jacobi coordinate system and is illustrated in the inset of Fig. 6) there is a finite probability that within an interval up to 15 fs, the involved wavepacket evolution will emerge in two rectangular regions defined by the R and r coordinates. These two regions are related to the two dissociation channels of the dication. More specifically, the region of the potential energy surface (PES) where the r < 3.0a0 and R > 2.0a0 is expected to lead to H2+ formation since the two hydrogen atoms are close enough to form a bond while the O+ ion is far from the H2+ ion. Actually, from our data, it is easy to make an estimation of the distance (R) between the H2+ and O+ just before the dissociation by using a simple formula which takes into account the total kinetic energy:37
 | ||
| Fig. 6 Comparison of the asymmetry parameter (β) for the fragments arising from the two dissociation channels in D2O2+ (I = 5 × 10¹⁴ W cm−2 and γ = 0.76). The line is used for eye-guiding purposes only. On the right, an illustration of the Jacobi coordinates used is given. | ||
Thus, the estimated value for both isotopomer dications is R = 2.7 Å. This value is quite big and R is longer than that predicted (R < 4a0).36 This observation is conceivable if the H-(D-) migration is taking place prior to the double ionization while the R is elongated to a critical value where the enhanced ionization mechanism36 leads to the dication creation.
In Fig. 6, the asymmetry of the component of the D2+ peak corresponding to the ions released with Ekin = 4.3 eV and the component of the OD+ fragments ejected with Ekin = 0.53 eV are presented. Taking into account the π phase lag between the asymmetry of the OD+ and D2+ (and similarly the OH+ and H2+) fragment, coming from the two competing dissociation channels, and the simultaneously measured asymmetries of the CO and D2O molecules (Fig. 3), it is easy to conclude that the H2+ and D2+ ions are ejected preferentially towards the opposite direction with respect to the maximum composed electric field. Since the common dependence of the OD+ and OH+ ions on the field phase has been experimentally confirmed and by taking into account the discussion on Fig. 3, it is reasonable to conclude that the asymmetry of the D2+ ion production – which is in close resemblance with that of the C+ fragment of the CO molecule – increases when the maximum intensity of the asymmetric ω/2ω field is pointed towards the O atom, i.e. the electronic cloud is removed in the D side of almost aligned (θ = 175°) D2O molecules. Actually, this motion of the electronic cloud could visualize the D+ (or proton) migration in terms of electrostatic forces on the singly ionized molecule.
This motion of the electronic cloud implies the shape modification of the potential barriers. This is not surprising since for the laser beam intensity used (I = 5 × 10¹⁴ W cm−2) the corresponding electric field is ∼ 6 V Å−1, i.e. of the same order of magnitude with the internal molecular field. Thus, within the pulse laser duration, the internal potential barriers can be suppressed and this lasts longer for laser beams at longer wavelengths. These two parameters (laser intensity and wavelength) obviously facilitate the tunneling process of the D+ (H+). The advantage of using the asymmetric laser fields is that this technique offers an experimental tool to shape the asymmetric electronic charge distribution and in that way the direction towards D+ (or proton) migration takes place. It is easily conceivable that for the sinusoidal symmetrical laser fields the expected value for the asymmetric parameter β is zero.
Finally, the observation that the amplitude of the asymmetry parameter which is almost 150% larger for the D2+ compared to that of H2+ (Fig. 4b and 5b), should be checked in terms of the above-suggested interpretation for the same experimental conditions (same laser intensity and γ value). Given that the laser intensity applied for the two water isotopomers is the same, this difference is attributed to the heavier mass of D+ and therefore D+-tunneling becomes probable for a smaller part of the intensity distribution of the asymmetric field, and in particular, to that corresponding only to higher intensity values. Therefore, the D+ migration process is feasible only for a narrow range of values around the (2n + 1)π electric field maxima. Due to the smaller mass of the H+ isotope, the restriction in terms of intensity and ω/2ω phase values is looser than the D+ case. Therefore, this interpretation suggests that the asymmetry observed for the H+ ejection should be smaller in amplitude than that of the D+ case, coming from the dissociation channel (2). In other words, the D+-migration has a stronger dependence on the laser field asymmetry and this is imprinted in the D2+ ion production.
Conclusions
From the above work, it is concluded that H2+ and D2+ ionic fragments can be generated through the dissociation of doubly charged water isotopomers. The formation of these fragments follows an H-(D-) intramolecular migration which is enhanced for laser wavelengths longer than 800 nm. On the other hand, the migration is dependent on laser intensity too. These two characteristics imply that in the migration, a tunneling through internal barriers process is involved. The interaction of water isotopomers in the gas phase with a ω/2ω (1400/700 nm) asymmetric laser field indicates that the two dissociation routes of water dications have different dependencies on the phase of the asymmetric field. This difference offers a controlling ability over these two dissociation routes.By the same set of experiments, it is firmly determined that the H- and D-migration is facilitated when the electronic cloud is removed by the asymmetric laser field in a direction opposite to the oxygen atom.
Our preliminary results, not presented here, indicate that the production of H2+ and D2+ water fragment ions is dependent not only on the laser intensity but also on the γ parameter, i.e. the degree of anisotropy of the ω/2ω field. A systematic work on this issue that is extended also to longer wavelengths will be presented in a forthcoming paper.
Conflicts of interest
There are no conflicts to declare.Acknowledgements
The experiments were performed in the Central Laser Facility of the University of Ioannina and we would like to express our thanks for the use of their facilities and their assistance. The authors also acknowledge the support of this work by the project “ELI – LASERLAB Europe Synergy, HiPER & IPERION-CH.gr” (MIS 5002735) which is implemented under the Action “Reinforcement of the Research and Innovation Infrastructure”, funded by the Operational Programme “Competitiveness, Entrepreneurship and Innovation” (NSRF 2014-2020) and co-financed by Greece and the European Union (European Regional Development Fund).References
- J. C. Polanyi and A. H. Zewail, Acc. Chem. Res., 1995, 28(3), 119–132 CrossRef CAS.
- P. Dietrich and P. B. Corkum, J. Chem. Phys., 1992, 97(5), 3187–3198 CrossRef CAS.
- M. E. Corrales, et al. , Nat. Chem., 2014, 6, 785–790 CrossRef CAS PubMed.
- G. Paulus, et al. , Nature, 2001, 414, 182–184 CrossRef CAS PubMed.
- S. Miura, et al. , Chem. Phys. Lett., 2014, 595–596, 61–66 CrossRef CAS.
- H. Li., et al. , Opt. Express, 2017, 25, 14192–14203 CrossRef CAS PubMed.
- H. Ohmura, T. Nakanaga and M. Tachiya, Phys. Rev. Lett., 2004, 92, 113002 CrossRef PubMed.
- H. Ohmura and T. Nakanaga, J. Chem. Phys., 2004, 120, 5176–5180 CrossRef CAS PubMed.
- K. J. Betch, D. W. Pinkham and R. R. Jones, Phys. Rev. Lett., 2010, 105, 223002 CrossRef PubMed.
- N. Kotsina, et al. , J. Chem. Phys., 2013, 139, 104313 CrossRef CAS PubMed.
- S. Kaziannis, N. Kotsina and C. Kosmidis, J. Chem. Phys., 2014, 141, 104319 CrossRef CAS PubMed.
- P. Brumer and M. Shapiro, Chem. Phys. Lett., 1986, 126, 541 CrossRef CAS.
- M. Shapiro and P. Brumer, Chem. Phys. Lett., 1988, 149, 451 CrossRef CAS.
- R. V. Ambartzumian, et al. , Opt. Commun., 1976, 18(3), 400–402 CrossRef.
- H. Yazawa, et al. , J. Chem. Phys., 2007, 127, 124312 CrossRef CAS PubMed.
- A. Hishikawa, et al. , J. Chem. Phys., 2008, 128, 084302 CrossRef PubMed.
- N. Kotsina, S. Kaziannis and C. Kosmidis, Chem. Phys. Lett., 2014, 604, 27–32 CrossRef CAS.
- N. Kotsina, S. Kaziannis and C. Kosmidis, Int. J. Mass Spectrom., 2015, 380, 34–39 CrossRef CAS.
- B. J. Rao and A. J. C. Varandas, J. Phys. Chem. A, 2015, 119(20), 4856–4863 CrossRef CAS PubMed.
- N. Kotsina, S. Kaziannis and C. Kosmidis, Chem. Phys. Lett., 2016, 651, 97–102 CrossRef CAS.
- H. C. Straub, B. G. Lindsay, K. A. Smith and R. F. Stebbings, J. Chem. Phys., 1998, 108(1), 109–116 CrossRef CAS.
- J. H. D. Elland, Chem. Phys., 2006, 323, 391–396 CrossRef.
- I. Ben-Itzhak, et al. , Nucl. Instrum. Methods Phys. Res., Sect. B, 2005, 233(1–4), 56–61 CrossRef CAS.
- F. A. Rajgara, et al. , J. Chem. Phys., 2009, 130, 23 CrossRef PubMed.
- H. B. Pedersen, et al. , Phys. Rev. A: At., Mol., Opt. Phys., 2013, 87, 013402 CrossRef.
- D. Mathur, et al. , J. Phys. B: At., Mol. Opt. Phys., 2017, 50, 15 CrossRef.
- G. A. McCracken, et al. , J. Chem. Phys., 2017, 147, 12 CrossRef PubMed.
- E. F. Sistrunk, PhD thesis, The Ohio State University, 2011.
- S. Kaziannis, S. Danakas, N. Kotsina and C. Kosmidis, Laser Phys. Lett., 2013, 13, 055301 CrossRef.
- W. C. Wiley and I. H. McLaren, Rev. Sci. Instrum., 1955, 26, 1150 CrossRef CAS.
- L. Hong, et al. , Chin. Phys. Lett., 2006, 32, 6 Search PubMed.
- S. J. King and S. D. Price, Int. J. Mass Spectrom., 2008, 277(1–3), 84–90 CrossRef CAS.
- S. De, et al. , Phys. Rev. Lett., 2009, 103, 153002 CrossRef CAS PubMed.
- H. Li, et al. , Phys. Rev. A: At., Mol., Opt. Phys., 2011, 84, 043429 CrossRef.
- A. M. Sayler, et al. , J. Phys. B: At., Mol. Opt. Phys., 2006, 39, 7 CrossRef.
- M. Garg, A. K. Tiwari and D. Mathur, J. Chem. Phys., 2012, 136, 2 CrossRef PubMed.
- P. Siozos, S. Kazianis and C. Kosmidis, Int. J. Mass Spectrom., 2003, 225, 249 CrossRef CAS.
| This journal is © the Owner Societies 2019 |