 Open Access Article
Cation diffusion patterns across the magneto-structural transition in Fe7S8
Dimitrios
Koulialias
ab,
Peter G.
Weidler
c,
Michalis
Charilaou
d,
Jörg F.
Löffler
b and
Andreas U.
Gehring
 *a
*a
aInstitute of Geophysics, ETH Zurich, 8092 Zurich, Switzerland. E-mail: agehring@ethz.ch
bLaboratory of Metal Physics and Technology, Department of Materials, ETH Zurich, 8093 Zurich, Switzerland
cInstitute of Functional Interfaces, Karlsruhe Institute of Technology, 76131 Karlsruhe, Germany
dDepartment of Physics, University of Louisiana at Lafayette, Lafayette, LA 70504, USA
First published on 30th May 2019
Abstract
Migration of atoms in solids during diffusion-dependent reactions is relatively fast and generally not directly recordable in experiments. Here we present an experimental framework that includes fast differential scanning calorimetry to resolve cation-migration paths in crystalline solids using the reversible magneto-structural transition of 4C to 1C pyrrhotite as a testbed. The transition between these two polymorphic Fe7S8 phases at about 600 K is a diffusive process of vacancies, respectively of Fe in octahedral interstitial sites within a hexagonal close-packed lattice of sulfur, and it coincides with the Curie temperature of 4C pyrrhotite. The Fe cations migrate along three kinds of diffusion paths, and their enthalpy contributions to the total reaction enthalpy are taken to define the diffusion patterns in the endothermic reaction and the exothermic back-reaction, respectively. Our experimental findings provide insight into the potential of diffusion patterns to disentangle ordering mechanisms in solids.
1 Introduction
Metal-deficient solid phases, mainly oxides (M1−xO) or sulfides (M1−xS), exhibit physical properties that are of broad interest in Earth and astrophysical sciences to constrain physico-chemical processes during planetary evolution, but also in materials science as a concept to design functional compounds.1–6 These defective phases have in common that they undergo structural transitions under changing temperature and/or pressure conditions due to rearrangement of the cation-deficient sites.7–10Among defective solids the minerals of the pyrrhotite group (Fe1−xS; 0 < x ≤ 0.125) represent a classic omission solid-solution series formed by a hexagonal close-packing of sulfur with ordered Fe sites and vacancies in the octahedral interstices that results in a hexagonal NiAs-type substructure and variable commensurate and incommensurate superstructures.11,12 Slight changes in the chemical composition and the subsequent arrangement of the empty sites generate a rich variation of electromagnetic states and processes.11,13–15 At temperatures of about 600 K the superstructures of all pyrrhotite phases are unstable due to diffusion-controlled processes that randomize the Fe-deficient sites in a hexagonal 1C structure.9,16,17 Because of the unique structural and physico-chemical properties of the members of the pyrrhotite group and their potential for technological applications, great effort has been put into the synthesis of pyrrhotite nanostructures such as nanotubes and nanowires.5,18–21 The inherent difficulty associated with pyrrhotite is the synthesis of structurally and magnetically well-defined omission phases with highly ordered and stable arrangements of empty sites. Therefore, apart from a fundamental physio-chemical interest, detailed information on the cation-diffusion processes is a requirement on the route to the technological application of the pyrrhotite phases.
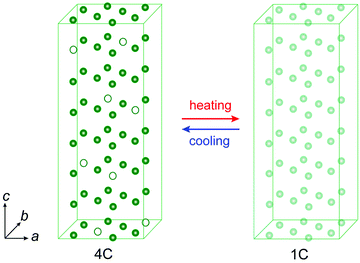
The Fe-deficient end-member (ideal formula Fe7S8) of the pyrrhotite omission series, denoted 4C pyrrhotite, is the ideal testbed to study diffusion mechanisms. The 4C phase has a monoclinic superstructure that stems from highly ordered vacancies in a stacking sequence of full and vacancy-bearing layers with a four-fold modulation per unit cell. Bertaut22 suggested that this ordering is a result of the Coulomb repulsion minimization of the Fe-deficient sites. The vacancy order generates a relatively strong ferrimagnetism (magnetic moment m ≈ 2.73 μB per Fe atom23) that stems from magnetically uncompensated sub-lattices due to ferromagnetic intra-layer and antiferromagnetic inter-layer couplings of the Fe magnetic moments with a Curie temperature (TC) of about 600 K.24,25 The loss of spontaneous magnetization occurs in the same temperature range as the polymorphic transition of the monoclinic 4C into a hexagonal 1C pyrrhotite. This transition goes along with a vacancy rearrangement that can be considered as a reversible diffusive process (e.g., ref. 26–28). In the 4C structure one of the four different Fe2+ sites has an occupancy probability of 0.5 and for the others it is zero, whereas in 1C the occupancy probability is theoretically 0.875 per Fe2+ site (Fig. 1). In the 4C pyrrhotite, the Fe2+ sites can schematically be subdivided into three crystallographic positions with inter-layer, intra-layer, or no vacancies in their vicinity and hence the cations have different diffusion coefficients and myriad combinations for their migration. Radiotracer-diffusion experiments and numerical simulations showed that inter-layer dominates intra-layer cation migrations.29,30 This information on the self-diffusion in pyrrhotite suggests anisotropy effects but provides only limited insight into the mechanism behind the reversible 4C to 1C transition, because in pyrrhotite the intrinsic diffusion is mainly determined by competing jumps of the Fe cations in altering structural configurations caused by vacancies. This complexity is the main reason why intrinsic diffusion processes in pyrrhotite and generally in defective structures are unresolved. Here, we present an experimental framework that opens a new way to decipher diffusion patterns in a methodological approach that can be extended towards a wide range of defective solids.
2 Materials and methods
In this study a natural 4C pyrrhotite crystal from the locality of Morro Velho (Minas Gerais, Brazil) was chosen.23 For the detailed crystallographic, chemical, and magnetic analyses powder samples were prepared by crushing and subsequently grinding the crystal sample in an agate mortar for about 30 minutes. For the calorimetric measurements crystal flakes were used. Powder X-ray diffractometry (XRD) at room temperature using untreated and heated samples was performed with a Bruker D8 device with Cu Kα1,2 radiation, and the patterns were Rietveld-refined with the Bruker software TOPAS.23,31 The chemical composition was determined by energy-dispersive X-ray fluorescence (ED-XRF) on a SPECTRO XEPOS spectrometer. The magnetic susceptibility upon heating between 300 and 650 K was determined on an AGICO KLY-2 Kappabridge in argon atmosphere with a heating/cooling rate of about 10 K min−1.Complementary thermal analysis of the magneto-structural transition was performed by differential scanning calorimetry (DSC) on crystal flakes (with masses between 10.5 and 18 mg) at heating/cooling rates between 1 and 30 K min−1 in a Mettler-Toledo DSC 1 device. For more detailed insight into the mechanism of the transition fast differential scanning calorimetry (FDSC) measurements were performed on microflakes at heating/cooling rates between 10 and 200 K s−1 using a Mettler-Toledo Flash DSC 1 with UFS1 sensor. The sensor support temperature was selected to 183 K and argon was used for purging. According to ref. 32 a difference in the temperature scale of 8 K was determined between FDSC and DSC. The FDSC temperatures were calibrated using an indium standard sample. The onsets of the endo- and exothermic events were determined after background correction using the Mettler-Toledo STARe software (Version V16.10). In the FDSC experiment, the heating/cooling cycles were continuously recorded with decreasing rate.
3 Results and discussion
3.1 Structural and magnetic properties
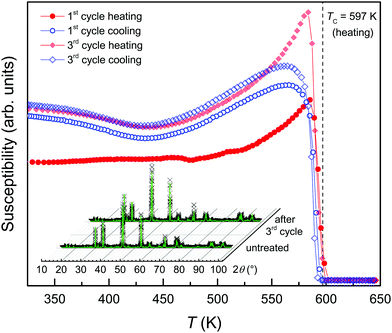
The powder XRD pattern of the Morro Velho sample shows a 4C pyrrhotite and no impurity phase was detected (Fig. 2, inset). The XRF analysis shows a chemical composition of 46.17 ± 0.1 at% Fe and 53.83 ± 0.1 at% S, and 377 ppm Ni traces, which corresponds to Fe6.9S8. The 4C pyrrhotite XRD pattern can be well refined in the C2/c space group with the structural model by Powell et al.27 The unit-cell parameters obtained at room temperature were a = 1.1918(2) nm, b = 0.6872(2) nm, c = 1.2913(2) nm, and β = 118.035(1)° with a goodness-of-fit of 3.67, a weighted Durbin–Watson value of 0.24, and an R-Bragg factor of 5.57. The refinement of the Fe-occupancy factor yielded a chemical composition of Fe6.6S8 that is slightly Fe-depleted compared to the Fe6.9S8 obtained from the chemical analysis. A mean crystallite size of about 220 nm was determined for the powder using the Scherrer equation33 after considering the instrumental and stress/strain contributions to the line broadening.The magnetic susceptibility (χ) of the heating–cooling cycles of the 4C pyrrhotite is shown in Fig. 2 for temperatures between 320 and 625 K. During the first heating, χ is constant up to 450 K, followed by an increase with a peak at 584 K and a drop down towards 600 K. The peak can be attributed to the Hopkinson effect, which is commonly observed in ferro-/ferrimagnetic materials just before the Curie temperature.34 For multi-domain particles, it is explained by enhanced domain-wall mobility with increasing temperature, which leads to an increase in the magnetic permeability and in turn to an increase in χ (e.g., ref. 35). Using the tangent method,36 a Curie temperature TC = 597 K was determined that is consistent with the values for 4C pyrrhotite reported in the literature (e.g.ref. 25 and 27). Troilite, the vacancy-free end-member of the pyrrhotite omission series has a Néel temperature TN ≈ 600 K (e.g.ref. 37 and 38), and therefore it is feasible to assume that the loss of magnetic ordering in the 4C phase is not critically affected by the vacancies. In the cooling curve, the onset of χ, however, occurs at 594 K, which indicates a minor hysteretic effect of 3 K between the heating and cooling curves. Upon further cooling, χ steeply increases down to 580 K, and reaches a maximum at 565 K followed by a minor overall decrease with a broad local minimum at 435 K. At 300 K, after the first heating/cooling cycle, χ is slightly higher compared to the initial value. In the subsequent heating curves, the Hopkinson peak becomes more pronounced but its peak position remains unchanged. The Curie temperatures and the hysteretic shifts between heating and cooling curves also remain constant within the experimental error. The cooling curves are nearly identical, but the comparison of the heating/cooling cycles indicates minor magneto-structural modifications during the first heating and this establishes a new thermodynamic equilibrium in the sample.
The XRD pattern obtained from the powder sample after the three cycles shows a single-phase 4C pyrrhotite (Fig. 2, inset) with the refined unit-cell parameters a = 1.1914(3) nm, b = 0.6870(2) nm, c = 1.2911(3) nm, and β = 118.025(1)° with a goodness-of-fit of 3.96, a weighted Durbin–Watson value of 0.21, and a R-Bragg factor of 6.73. The comparison of the crystallographic parameters of the untreated and the heat-treated samples reveals no significant changes. The chemical composition of Fe6.9S8 in the heated sample obtained from the refinement of the Fe-occupancy factor is equal to that yielded from the XRF analysis. Simultaneous to the shift in stoichiometry due to the heat treatment, the mean crystallite size in the powder increases by about 50% to 330 nm. The heat-induced sintering can also explain the more pronounced Hopkinson peaks, because larger crystallites in pyrrhotite grains are expected to contain more magnetic domain walls. The sintering can also account for the shift towards the ideal 4C stoichiometry in the cycled sample because small defects, such as stacking faults forming jogs,1 which are not detectable by XRD, can be eliminated by the heat treatment. Under the assumption that these defects are less Fe-deficient compared to the bulk material, their healing can explain the shift towards a stoichiometric pyrrhotite. Taking the susceptibility data into account, it is obvious that the sintering has no critical effect on the magnetic ordering in the 4C phase.
3.2 Calorimetric properties
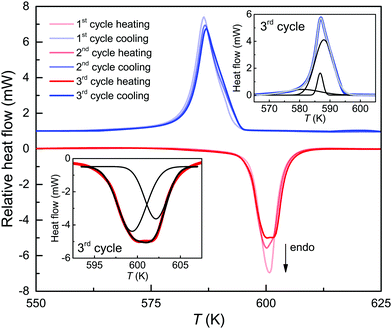
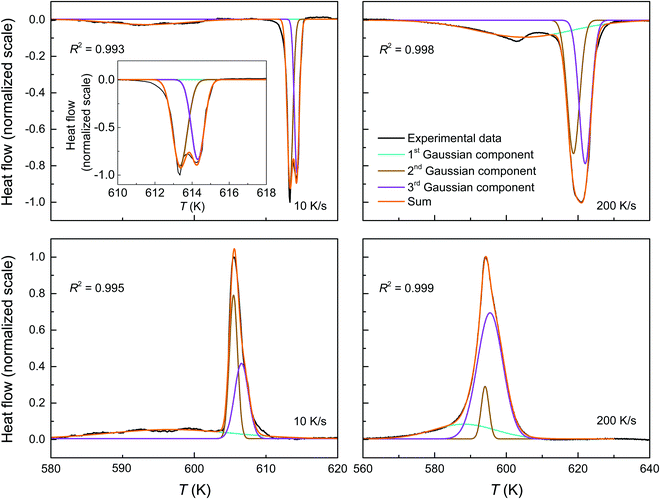
Thermodynamic analysis of the magneto-structural transition using a scanning rate of 10 K min−1 for the DSC cycles shows no apparent changes for temperatures between 300 K and 575 K (Fig. 3). Above 575 K, the three DSC cycles reveal an onset of the endothermic event at 595.4 ± 0.4 K upon heating with a mean peak temperature of 600.5 ± 0.4 K. For the exothermic event upon cooling the onset is at 593.4 ± 0.8 K with a mean peak temperature of 586.8 ± 0.2 K. The onsets of both events are slightly below TC = 597 K of 4C pyrrhotite, which accords with previous experimental studies.25,39For the transition of 4C to 1C pyrrhotite, the enthalpy changes ΔH4C→1C are 0.77 kJ mol−1 in the first two cycles and slightly increase to 0.81 kJ mol−1 in the third one. These ΔH4C→1C values are similar to those of a natural 4C pyrrhotite crystal from a different locality1 and somewhat lower than the 1.3 kJ mol−1 obtained from a synthetic 4C powder sample.28 Considering the XRD data, the increase in ΔH4C→1C during the cycling is probably a sintering effect, because more energy is needed for the 4C to 1C transition to occur when the vacancy order gets enhanced. The sintering also slightly changes the shape of the endothermic peak. In the third cycle, it is weakly split and can be fitted with two Gaussian components, and this in turn points to two events that slightly differ in their ΔH4C→1C (Fig. 3, inset). Taking this into account, the splitting provides evidence that the breakdown of the vacancy order in 4C pyrrhotite is subject to a heterogeneous diffusion mechanism, i.e., the probability for a cation movement is unequal for the four Fe-sites in the 4C pyrrhotite. Regarding the exothermic event the DSC curves exhibit asymmetric shapes that can only be fitted by three Gaussian components. This indicates that the 1C to 4C transition is also a heterogeneous diffusion process (Fig. 3). The enthalpy changes ΔH1C→4C obtained from the three cycles differ only slightly and their mean is −0.93 ± 0.03 kJ mol−1.
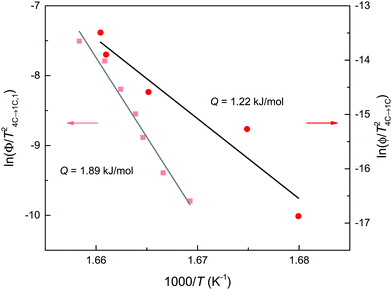
The change of the scanning rates in the DSC cycles has only minor effects on the onset temperatures with means of 595.1 ± 1.3 K for the endothermic and 592.9 ± 0.8 K for the exothermic event. The enthalpy changes are also nearly rate-independent with means ΔH4C→1C = 0.82 ± 0.05 kJ mol−1 and ΔH1C→4C = −0.81 ± 0.10 kJ mol−1, respectively (Fig. 3). In contrast, the difference of the heating and cooling peaks reveals a non-linear increase with the rate from 5 K at 1 K min−1 to 21 K at 30 K min−1 with a symmetric shift at around 593 K. Furthermore, taking the mean of the peak temperature Tpeak of the three scans for each heating rate, the apparent activation energy Q for the endothermic reaction can be extracted using the Kissinger relation ln(Φ/Tpeak2) ∝ 1/Tpeak, where Φ is the heating rate (Fig. 4). From the slope of the Kissinger plot m, the activation energy Q = mR can be determined (e.g.ref. 40), where R is the universal gas constant. A value of Q = 1.22 kJ mol−1 is obtained. The relative large scatter of the peak temperature data in Fig. 4 is probably caused by the influence of the heat transfer change of the sample due to sintering. The energy barrier, however, is nearly two orders of magnitudes lower than that obtained from radiotracer experiments.16,29 In such experiments, the tracer migration is a relatively slow process, and therefore it can mask the faster intrinsic diffusion. Moreover, Herbert et al.16 provided evidence that the increase of the relative, spontaneous magnetization (M) expressed as M(T)/M (T = 0 K) enhances the Q of the self-diffusion. Considering the magnetic data for 4C pyrrhotite reported by Powell et al.,27M is nearly zero in the temperature range of the structural transition. Therefore, a critical, magnetic effect on the intrinsic diffusion is unlikely.
3.3 Diffusion patterns
In order to provide further insight into the mechanism behind the diffusion-controlled reaction, FDSC is applied. In contrast to DSC, the peak positions and the shapes of the endothermic event are congruent in the FDSC scans with the same heating rate. The FDSC curves with heating rates between 10 and 100 K s−1 separate the endothermic event into three peaks, a relatively broad one and a doublet at relatively higher temperature (Fig. 5a). At higher rates up to 200 K s−1, two features of the doublet blur (Fig. 5a and b). The asymmetric peaks in the cooling curves have similar shapes as in the conventional DSC measurements. (Fig. 3b and 5b).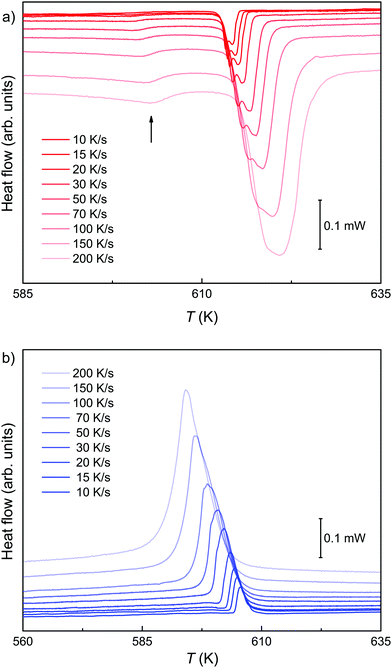 | ||
| Fig. 5 FDSC of a pyrrhotite microflake recorded with rates between 10 and 200 K s−1 during heating (a) and (b) cooling. The first events in the heating curves are marked by an arrow. | ||
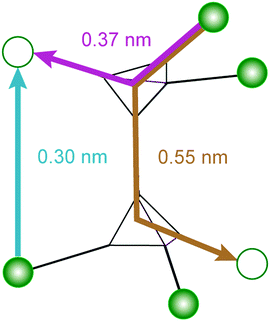
Assuming that the total transformation enthalpies (ΔHtot) obtained from DSC correspond to those from FDSC, the enthalpies of the 4C to 1C and the 1C to 4C transformations can both be subdivided into three contributions ΔHi (i = 1, 2, 3) derived from the three Gaussian components (Fig. 6) with  . The relative contributions are then ΔHi/ΔHtot. The ΔHi is affected by the three crystallographic positions of Fe cations with respect to the vacancy sites, i.e., by the diffusion coefficient and the diffusion path (Fig. 1). Considering the hexagonal close-packing of the sulfur atoms in the pyrrhotite structure, three kinds of paths for the Fe2+ cations can be inferred. There is a direct diffusion jump into a vacancy via the openings formed by face-shared sulfur octahedra in the c-plane with only one degree of freedom along the c-axis (o–o) (Fig. 7). In the 4C structure with the stacking sequence of full and vacancy layers, one quarter of the Fe sites can follow such path (Fig. 1). For the other Fe sites the cations may migrate through tetrahedral interstices either in the c-plane (o–t–o) or along the c-axis (o–t–t–o) with degrees of freedom >1 (Fig. 7). The different paths vary by their lengths. The shortest one with nearly 0.30 nm is o–o followed by o–t–o and o–t–t–o with lengths of about 0.37 nm and 0.55 nm, respectively (Fig. 7). It was shown that self-diffusion along the c-axis is faster than in the c-plane.29 Powell et al.27 also demonstrated that with the onset of the transition the occupancy probability of Fe sites next to vacancies decreases from 0.5 to 0.38. Thus, it can be assumed that the Fe migrations in 4C pyrrhotite starts along the o–o path, which is energetically more favorable compared to those via tetrahedral interstices. With this in mind the initial o–o jumps can be attributed to ΔH1. They break the local cation-vacancy relations in the 4C structure while the number of vacancies remains constant. These o–o jumps are thus expected to trigger a state with a dynamic opening and closing of diffusion paths, where all the cations are captured and encountered until a new equilibrium in the Fe-vacancy configuration is established. In the 1C structure this configuration shows no crystallographic long-range order. At T < 600 K, the initial o–o jumps (ΔH1), however, are always unaffected by the two high-temperature events ΔH2 and ΔH3, and, therefore, they can be taken to determine the activation energy of the initial diffusion step using the Kissinger plot (Fig. 4). The yielded activation energy of Q = 1.89 kJ mol−1 is similar to that of the overall diffusion obtained from the average peak Tpeak of the conventional DSC measurements. This is consistent with the idea that the initial o–o jumps destabilize the 4C structure and thus trigger the breakdown of the cation order in which all sites become involved. With this in mind the enthalpy contributions ΔH2 and ΔH3 indicate the onset of the diffusion along the o–t–o and o–t–t–o paths, respectively. In fact, the diffusion patterns obtained from the FDSC curves with variable heating rates are described by three components ΔH4C→1C,i/ΔH4C→1C,tot with variable contributions that fluctuate in a range between 19% and 45% (Fig. 8a). The variations of the mean contributions, which are 32.6 ± 8.3% for ΔH4C→1C,1, 36.8 ± 5.3% for ΔH4C→1C,2, and 30.6 ± 3.7% for ΔH4C→1C,3, show that the heating rate has no significant effect on the overall diffusion pattern and that there is no apparent preferred path during the randomization of the vacancy distribution.
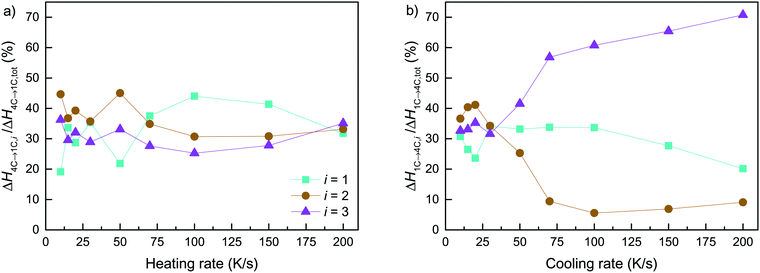 | ||
| Fig. 8 Rate-dependence of the relative enthalpy contributions for the three different diffusion paths with respect to the endothermic (a) and exothermic (b) reactions. | ||
The FDSC measurements of the reversed 1C to 4C transition yield that the exothermic heat flow is characterized by an asymmetric peak (Fig. 5b). The ΔH1C→4C,tot, however, can also be fitted with three Gaussian components ΔH1C→4C,i (i = 1, 2, 3), similar to those found in the DSC measurements. The contributions of ΔH1C→4C,i are rate-dependent. Between 10 and 30 K s−1, the average contributions of 28.8 ± 4.6% for ΔH1C→4C,1 is significantly lower compared to those of 38.1 ± 3.2% for ΔH1C→4C,2 and 33.2 ± 1.5% for ΔH1C→4C,3, respectively (Fig. 8b). At higher rates the differences between them increase drastically and the diffusion patterns split into a relative dominant ΔH1C→4C,3, a minor ΔH1C→4C,2, and a relatively stable ΔH1C→4C,1. Compared to the 4C phase, the Coulomb repulsion between vacancies in the 1C structure is enhanced and the structural relation of the Fe sites and the vacancies is not explicitly defined. Given this, an unambiguous assignment of individual ΔH1C→4C,i to specific diffusion paths is impossible. Moreover, the back-reaction to minimize the repulsion starts in a structurally undefined state and may be considered a stochastic process. This may also explain why the exothermic events cannot be isolated in the DSC and FDSC experiments.
4 Conclusions
The thermally-induced magneto-structural 4C to 1C transition in Fe7S8 is a reversible cation-diffusion reaction in a stable hexagonal close-packing of sulfur. There is no evidence for a magnetic effect on the intrinsic diffusion processes during the transition. Three diffusion patterns during the endothermic reaction can be separated due to different migration paths and jumping frequencies of the cations. The onset of the transition is triggered by direct jumps of Fe into vacancies, destabilizing the 4C structure and resulting in a complex diffusion formed by dynamic variations of the vacancy distribution towards a thermally-activated state. For the back-reaction from a disordered to the ordered 4C structure three patterns are also identified, but they are superimposed in such a way that they cannot be explicitly resolved in the experimentally determined enthalpy changes. This probably results from the absence of a crystallographically well-defined spatial relation between Fe sites and vacancies in the 1C structure. Considering the experimental results, the identification of diffusion patterns based on their dynamics opens new perspectives for the investigation of intrinsic diffusive reactions in solids. This is expected to be highly beneficial for the understanding of dynamic processes in geological and technical systems that are driven by diffusion.Conflicts of interest
There are no conflicts to declare.Acknowledgements
The authors would like to thank Barbara Lesniak for performing the XRF measurements and Jürgen Schawe (Mettler-Toledo) for the critical discussion of the calorimetric data. The project was supported by the Swiss National Science Foundation, Grant No. 200021-153173.References
- D. Koulialias, R. Schäublin, G. Kurtuldu, P. G. Weidler, J. F. Löffler and A. U. Gehring, J. Geophys. Res. Solid Earth, 2018, 123, 6236–6246 CAS.
- C.-S. Horng and A. P. Roberts, Geochem. Geophys. Geosyst., 2018, 19, 3364–3375 CrossRef.
- K. L. Louzada, S. T. Stewart and B. P. Weiss, Geophys. Res. Lett., 2007, 34, L05204 CrossRef.
- C. Koike, J. Matsuno and H. Chihara, Astrophys. J., 2017, 845, 1–11 CrossRef.
- D. M. Roberts, A. R. Landin, T. G. Ritter, J. D. Eaves and C. R. Stoldt, Sci. Rep., 2018, 8, 6591 CrossRef.
- R. M. Hazen and R. Jeanloz, Rev. Geophys., 1984, 22, 37–46 CrossRef CAS.
- J. Zhang, Phys. Rev. Lett., 2000, 84, 507–510 CrossRef CAS PubMed.
- H.-K. Mao, J. Shu, Y. Fei, J. Hu and R. J. Hemley, Phys. Earth Planet. Inter., 1996, 96, 135–145 CrossRef CAS.
- S. A. Kissin and S. D. Scott, Econ. Geol., 1982, 77, 1739–1754 CrossRef CAS.
- P. Rochette, G. Fillion, R. Ballou, F. Brunet, B. Ouladdiaf and L. Hood, Geophys. Res. Lett., 2003, 30, 1683 CrossRef.
- H. Wang and I. Salveson, Phase Transitions, 2005, 78, 547–567 CrossRef CAS.
- D. Harries, K. Pollok and F. Langenhorst, Am. Mineral., 2011, 96, 716–731 CrossRef CAS.
- C. I. Pearce, R. A. D. Pattrick and D. J. Vaughan, Rev. Mineral. Geochem., 2006, 61, 127–180 CrossRef CAS.
- K. Zhang, T. Zhang, J. Liang, Y. Zhu, N. Lin and Y. Qian, RSC Adv., 2015, 5, 14828–14831 RSC.
- M.-J. Choi, J. Kim, J.-K. Yoo, S. Yim, J. Jeon and Y. S. Jung, Small, 2018, 14, 1702816 CrossRef PubMed.
- F. W. Herbert, A. Krishnamoorthy, L. Rands, K. J. Van Vliet and B. Yildiz, Phys. Chem. Chem. Phys., 2015, 17, 11036–11041 RSC.
- E. Schwarz, Geol. Surv. Can., 1975, 1–24 Search PubMed.
- J. M. Rhodes, C. A. Jones, L. B. Thal and J. E. Macdonald, Chem. Mater., 2017, 29, 8521–8530 CrossRef CAS.
- C.-R. Lin, S.-Z. Lu, I. S. Lyubutin, Y. V. Korzhetskiy, S.-C. Wang and I. P. Suzdalev, J. Appl. Phys., 2010, 107, 09A335 CrossRef.
- T. Takayama and H. Takagi, Appl. Phys. Lett., 2006, 88, 12512 CrossRef.
- G. H. Yue, P. X. Yan, X. Y. Fan, M. X. Wang, D. M. Qu, D. Yan and J. Z. Liu, J. Appl. Phys., 2006, 100, 124313 CrossRef.
- E. F. Bertaut, Acta Crystallogr., 1953, 6, 557–561 CrossRef.
- D. Koulialias, E. Canévet, M. Charilaou, P. G. Weidler, J. F. Löffler and A. U. Gehring, J. Phys.: Condens. Matter, 2018, 30, 425803 CrossRef CAS PubMed.
- L. Néel, Rev. Mod. Phys., 1953, 25, 58–63 CrossRef.
- E. Schwarz and D. J. Vaughan, J. Geomagn. Geoelectr., 1972, 24, 441–458 CrossRef CAS.
- U. Becker, A. W. Munz, A. R. Lennie, G. Thornton and D. J. Vaughan, Surf. Sci., 1997, 389, 66–87 CrossRef CAS.
- A. V. Powell, P. Vaqueiro, K. S. Knight, L. C. Chapon and R. D. Sánchez, Phys. Rev. B: Condens. Matter Mater. Phys., 2004, 70, 014415 CrossRef.
- F. W. Herbert, A. Krishnamoorthy, B. Yildiz and K. J. Van Vliet, Appl. Phys. Lett., 2015, 106, 092402 CrossRef.
- R. H. Condit, R. R. Hobbins and C. E. Birchenall, Oxid. Met., 1974, 8, 409–455 CrossRef CAS.
- G. E. Murch, J. M. Rolls and H. J. De Bruin, Philos. Mag., 1974, 29, 337–348 CrossRef CAS.
- A. A. Coelho, Bruker AXS, 2005.
- S. Pogatscher, P. J. Uggowitzer and J. F. Löffler, Appl. Phys. Lett., 2014, 104, 251908 CrossRef.
- P. Scherrer, Bestimmung der inneren Struktur und der Größe von Kolloidteilchen mittels Röntgenstrahlen, Springer, Berlin, Heidelberg, 1912, pp. 387–409 Search PubMed.
- J. Hopkinson, Philos. Trans. R. Soc., A, 1889, 180, 443–465 CrossRef.
- O. Popov and M. Mikhov, J. Magn. Magn. Mater., 1988, 75, 135–140 CrossRef CAS.
- E. Petrovský and A. Kapička, J. Geophys. Res. Solid Earth, 2006, 111, B12S27 Search PubMed.
- J. L. Horwood, M. G. Townsend and A. H. Webster, J. Solid State Chem., 1976, 17, 35–42 CrossRef CAS.
- A. F. Andresen, Acta Chem. Scand., 1960, 14, 919–926 CrossRef CAS.
- H. Haraldsen, Z. Anorg. Allg. Chem., 1941, 246, 195–226 CrossRef CAS.
- H. E. Kissinger, J. Res. Natl. Bur. Stand., 1956, 57, 217–221 CrossRef CAS.
| This journal is © the Owner Societies 2019 |

