
 Open Access Article
 This Open Access Article is licensed under a
 Creative Commons Attribution 3.0 Unported Licence
Using nanotubes to study the phonon spectrum of two-dimensional materials
Jesús
Carrete
 *a,
Vu
Ngoc Tuoc
b and
Georg K. H.
Madsen
a
*a,
Vu
Ngoc Tuoc
b and
Georg K. H.
Madsen
a
aInstitute of Materials Chemistry, TU Wien, A-1060 Vienna, Austria. E-mail: jesus.carrete.montana@tuwien.ac.at
bInstitute of Engineering Physics, Hanoi University of Science and Technology, 1 Dai Co Viet Road, Hanoi 100000, Vietnam
First published on 6th February 2019
Abstract
We propose a convenient method to characterize the acoustic phonon branches of 2D monolayer materials using measurements of the infrared- and Raman-active vibrational modes of nanotubes. The relations we employ are derived from a symmetry analysis based directly on the line groups of nanotubes. We perform extensive ab initio calculations for the MoS2 monolayer and nanotubes to evaluate the method and illustrate all our results. Specifically, we show how the low-energy phonon transmission, a determining factor in thermal transport, can be easily and successfully reconstructed by this procedure.
1 Introduction
One- (1D) and two-dimensional (2D) crystalline materials are among the most popular topics in contemporary materials science. While graphene and carbon nanotubes (NTs) have become paradigms of these families, new members are being continually proposed and experimentally characterized, and the array of potential applications has not ceased to expand.Among non-elemental compounds, transition-metal dichalcogenides (TMDs) have attracted significant attention. TMDs follow the formula TX2, where T is a transition metal from groups IV–VI (e.g. Mo, Ti, Nb), and X is a chalcogen (S, Se, or Te). They crystallize in several different bulk phases, all of which consist of covalently bonded layers held together by weaker interactions. This fact opens the door to exfoliation to obtain large-area single layers.1 In particular, monolayer (ML) TMDs have been extensively studied as direct-band-gap semiconductors.2 Even long before the rediscovery of graphene, early observations of the polyhedral and cylindrical structures of WSe2 led to the proposal that it could be unstable in a planar structure and spontaneously assemble into a fullerene-like or NT form.3 MoS2 NTs were synthesized three years later.4
The properties of TMD NTs depend on their diameter and chirality. Computational studies have shown that zigzag (ZZ) MoS2 NTs, like the corresponding ML, are direct-band-gap semiconductors, while armchair (AM) MoS2 NTs show an indirect gap like the bulk 2H phase.5 The gap width varies from almost 0 eV to 1.5 eV depending on the diameter and strain.6 The tunability has aroused interest for applications in nano- and optoelectronics, where absorption could be shifted from the near infrared (IR) range to the visible one. Further applications include valleytronics, as 2D field-effect transistors (FETs), logical circuits and amplifiers.7,8 The first actual device based on MoS2 NTs, with diameters of 20 nm to 100 nm and lengths 1 μm to 2 μm, is a FET with mobilities up to 0.014 cm2 V−1 s−1 and an on/off ratio9 of 60. General perspectives on the challenges and opportunities for a number of potential applications in the fields of lubrication, high-performance nanocomposites, sensors, renewable energy, energy storage, and catalysis are discussed in recent reviews.8,10–12
A central question for the characterization of 1D and 2D systems is their stability, and vibrational properties are one of the key elements determining it. Not only is a fully real phonon spectrum a requirement for mechanical stability, but the vibrational free energy can also alter the order of thermodynamic stability.13 Furthermore, in addition to their singular electronic features, 1D and 2D systems have attracted attention because of their thermal transport properties, especially in connection with the important problem of heat dissipation in nanodevices. Part of this appeal is due to the extremely high thermal conductivity of graphene14–16 and carbon NTs.17–20 As in the case of stability, characterizing the thermal transport properties of a material requires a detailed understanding of its phonon physics.
The phonon spectrum of the MoS2 ML has been characterized both using semi-empirical potentials21 and from first principles,22 with the latter article also calculating its thermal conductivity. The phonon spectra of MoS2 NTs have also been studied using both families of methods.6,23,24 However, a significant stumbling block for calculations comes from the particular features of the phonon dispersions of 1D and 2D systems. Electronic structure programs typically fall into one of two categories: those designed to work on crystals, with periodic boundary conditions along every axis, and those that focus on aperiodic systems like molecules. Regarding symmetry, the former typically implement space groups and the latter point groups. Therefore, none of them adequately supports the subperiodic groups required to deal with systems that are only periodic in one or two dimensions.
Translational symmetry guarantees that, for long enough wavelengths, phonons from any of the three acoustic branches in 3D periodic systems have a linear dispersion relation. In contrast, crystals that are only periodic along one spatial axis have four acoustic branches: two linear ones and two quadratic ones. Likewise, systems periodic along two axes have a single quadratic branch, corresponding to vibrations along the non-periodic direction, and its existence is guaranteed by rotational symmetry. Unfortunately, the periodic boundary conditions employed in electronic structure calculations introduce violations of this fundamental symmetry. Typical manifestations of the problem are spurious imaginary frequencies close to the Γ point.25–27 It is therefore important to correct such artifacts, which can have a significant effect on derived quantities like thermal conductivity or lead to a mischaracterization of the mechanical stability of a system. To overcome this issue, two very different approaches have been devised. A first possibility is to exploit the fact that continuum theory can provide the long-wavelength limit of the acoustic modes, and to use electronic-structure software to estimate the elastic parameters defining those.26,27 A second approach consists in finding the maximum projection of the interatomic-force-constant (IFC) tensor on a subspace of internal coordinates that cannot express rigid translations or rotations, hence removing the artifactual elements introduced by periodic boundary conditions and recovering the phonon dispersions that fulfill the physical constraints by construction.25
Here we apply a consistent, ab initio methodology to illustrate the connection between the phonon spectra of the MoS2 NTs and both the continuum limit and the spectrum of the corresponding ML. We analyze the symmetry of the NT phonon modes, both in terms of their chirality and their irreducible representations (irreps), to associate them to those of the ML. The agreement observed between the ML and large-radius NTs makes it reasonable to reconstruct the ML acoustic bands based on the phonon frequencies of the NTs at the Γ point. We exploit the connection between the phonon spectra of the NTs and that of a ML to show that IR and Raman measurements, which can only provide data about optical branches at the Γ point, on single-walled NTs can be used to extract key features of the phonon spectrum of the ML. Thereby information on the acoustic branches at q ≠ 0 can be obtained which would otherwise require data from more specialized measurement methods like inelastic neutron scattering.28 Finally, we calculate the thickness- and chirality-dependent ballistic phonon transmission and compare it to that of the ML.
2 Methods
2.1 Nanotube construction
We build NTs by “rolling up” a rectangular section of the honeycomb lattice MoS2 ML. This conceptual process is illustrated in the top panel of Fig. 1. The “rolling-up” operation can more precisely be described as a conformal mapping between coordinates on a plane and coordinates on a cylinder.29 A particular MoS2 NT is characterized by two orthogonal vectors: T, which defines the axis of the tube, and the chiral vector Ch, whose norm determines the diameter. Either vector can be conveniently expressed on the {a1,a2} basis represented in the figure. In particular, an infinitely long NT is completely specified by the pair of integers (n1,n2) required to define Ch = n1a1 + n2a2. Although NTs of any chirality can in principle be defined, the most interesting families in practice are (n,0) (ZZ) and (n,n) (AM) NTs. We restrict this study to those two classes. We built the ZZ NTs with n ∈ {6,9,12,24}. The (6,0) NT turns out to be mechanically unstable as evidenced by abundant imaginary modes in its phonon spectrum. Furthermore, we built the AM NTs with n ∈ {6,9,12,17}.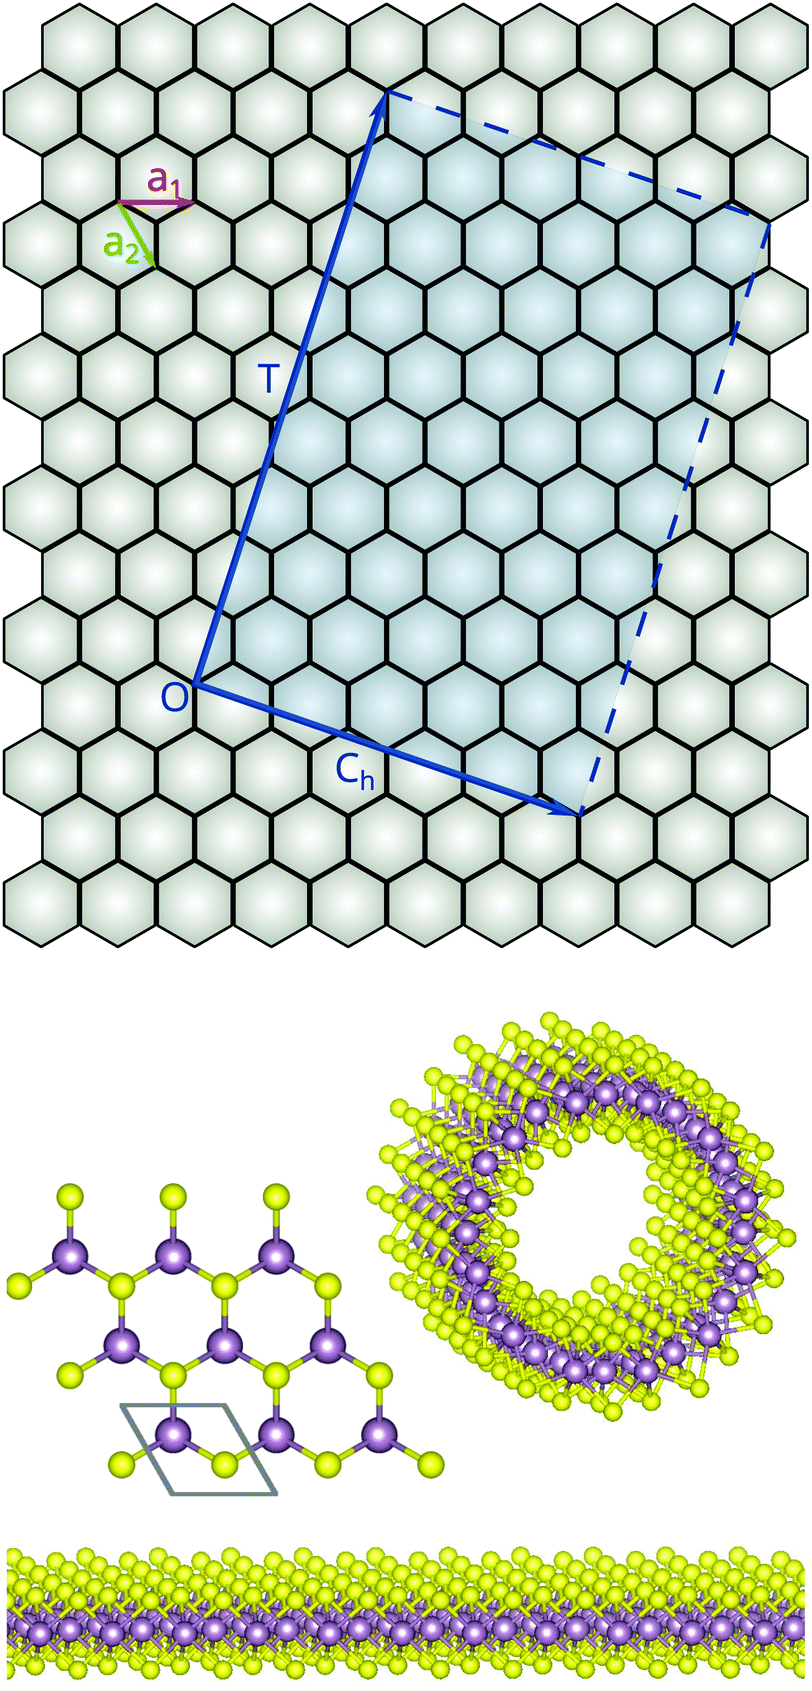 | ||
| Fig. 1 Top: Schematic description of how NTs are conceptually built from an infinite monolayer of a honeycomb lattice. Ch is the chiral vector and T defines the tube axis. a1 and a2 are a particular choice of basis vectors for the lattice. The atomic motif of MoS2 is not represented. Bottom: Lateral and top views of a monolayer of MoS2, along with a view of a (12,0) NT. | ||
2.2 First-principles calculations
We obtain the second-order IFCs for the MoS2 ML and NTs using density functional theory (DFT) calculations. Specifically, we employ the VASP30 implementation of the projector-augmented-wave formalism,31 and the Perdew–Burke–Ernzerhof approximation to the exchange and correlation energy.32 We choose 4p65s14d5 and 3s23p4 as valence configurations for Mo and S, respectively, and a plane-wave cutoff energy of 252 eV. For the MoS2 ML we obtain a relaxed lattice parameter of 3.18 Å, only slightly higher than the low-temperature experimental value of ∼3.12 Å.33 We perform an additional VASP run for the ML to estimate the elastic parameters using density functional perturbation theory (DFPT).The procedure for each system starts with an energetic minimization to find the equilibrium ionic positions. We use a 17 × 17 × 1 Monkhorst–Pack grid for the ML and a 4 × 1 × 1 grid for the NTs. We add 10 Å of empty space to the unit cell along each of the non-periodic directions to reduce spurious interactions between copies of the system, and we check that the results are well converged with respect to this parameter by repeating some selected calculations with 15 Å of padding. Once the minimum-energy coordinates are known, we use Phonopy34 to generate a symmetry-reduced set of displaced configurations for supercells with sizes 8 × 8 × 1 (for the ML) or 4 × 1 × 1 (for the NTs). After using VASP again to obtain the forces on atoms in each of those configurations, we rebuild the matrix of IFCs with Phonopy. In the case of NTs, we post-process that matrix to extract a minimal set of constants corresponding to the reduced motif discussed in Section 3.1. For the ML we use a force-constant projection scheme to symmetrize the force constants.25 In 1D it is straightforward to extrapolate the ZA branch quadratically towards the Γ point from points that are free from artifacts.
2.3 Symmetry analysis
We start from the Cartesian dynamical matrix for each value of q and use projection operators to transform it to a block-diagonal form where each block corresponds to a different irreducible representation (irrep) of the symmetry group of the NT.35 Specifically, we build an unnormalized incomplete projection operator of irrep J as the following sum over all symmetry operations (O) in the group: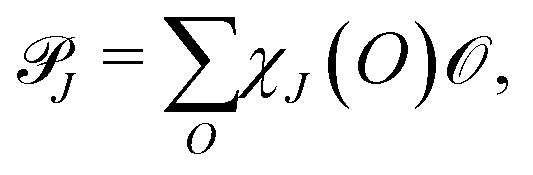 | (1) |
![[scr O, script letter O]](https://www.rsc.org/images/entities/char_e52e.gif) is the linear operator performing the operation O on the 3N-dimensional space of atomic displacements of the NT unit cell, and χJ(O) is the character of O for irrep J. We then extract an orthonormal basis for the columns of
is the linear operator performing the operation O on the 3N-dimensional space of atomic displacements of the NT unit cell, and χJ(O) is the character of O for irrep J. We then extract an orthonormal basis for the columns of ![[scr P, script letter P]](https://www.rsc.org/images/entities/char_e52f.gif) J using a singular value decomposition based on interpolative methods,36 and project the dynamical matrix on that basis. The eigenvalues and eigenvectors of the resulting block describe the vibrational modes transforming according to irrep J.
J using a singular value decomposition based on interpolative methods,36 and project the dynamical matrix on that basis. The eigenvalues and eigenvectors of the resulting block describe the vibrational modes transforming according to irrep J.
2.4 The continuum limit
In the q → 0 (or long-wavelength) limit, the phonon branches of a NT enter the domain of validity of continuum theory, i.e., the low-frequency branches become analogous to the vibrational modes of a rod.37 In this long-wavelength limit, explicit dispersion relations can be obtained for the acoustic branches, as well as a value for the the RBM frequency, taking only the energy of the ML deformation into account:27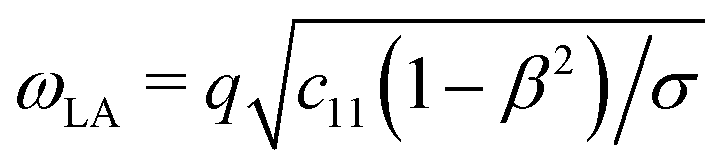 | (2a) |
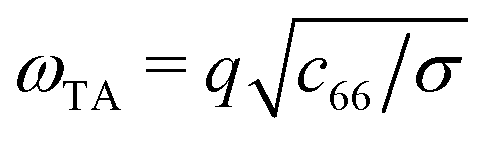 | (2b) |
 | (2c) |
 | (2d) |
3 Results & discussion
3.1 Vibrational dynamics of NTs
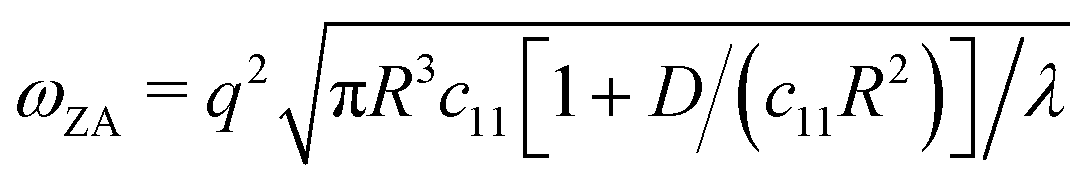
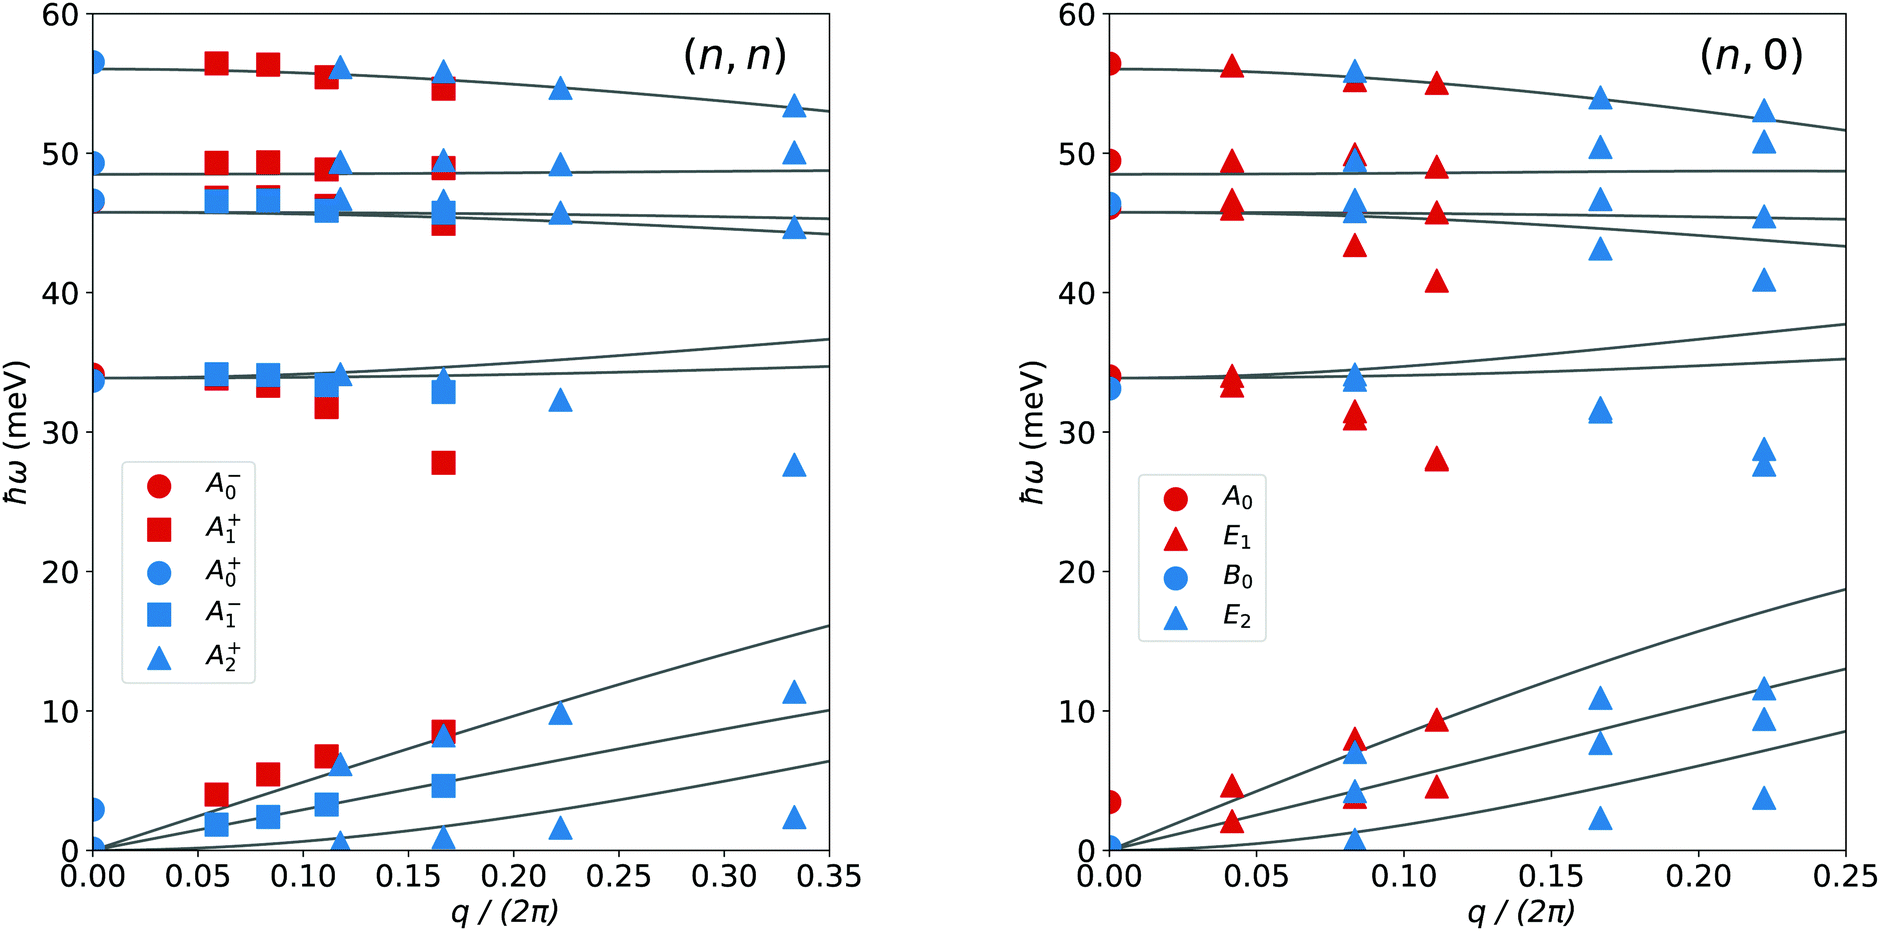
When periodicity is only considered along the direction of T, the normal modes of a NT can be indexed by a wave number qz along the periodic direction and by a phonon branch index j. In this description, a NT is obtained by translation of a large atomic motif [Fig. 1] and hence there is a very large number of phonon branches. A more compact description is obtained by expressing the dynamical matrix in the planar coordinate system [Fig. 1] where the NT is translationally symmetric in two independent directions. In this revised description, the helical symmetry of the NT is harnessed to reduce the motif to three atoms, the same number as in the ML. The corresponding vibrational modes are indexed by means of three numbers (qz, j, m).38 Here, qz is the continuous wave number along the NT axis and the branch index j runs from 1 to 9. m is a discrete angular pseudo-wave-number running from −n to n and describes how the phase of the vibration changes under application of the helical transformation. It plays an important role in the context of anharmonic phonon scattering, where selection rules link the values of m for three-phonon processes.38Fig. 2 shows the phonon band structure of the ML together with those of the two largest-diameter NTs studied here. In the simplest picture, the phonon band structure of the NTs can be viewed as a projection of the slices of the 2D ML band structure onto the 1D Brillouin zone (BZ) of the NTs. To see this, denote the reciprocal basis of the ML by {b1,b2} and observe (see inset in Fig. 2) that the phonon wave vectors parallel to the NT axis are parallel to the b2 and b1 + 2b2 vectors of the (n,0) and (n,n) NTs respectively. In Fig. 2 we mark the m = 0 and m = n branches of the two thickest NTs with bold lines and observe a good correspondence with the corresponding branches of the ML. The main exception is the quadratic ZA branch of the ML. It is evident from the start that the ML ZA branch transforms differently from the other acoustic branches. Perhaps most notably, if one rolled up a piece of ML vibrating according to the q → 0 limit of its ZA branch, the result would not be a NT vibrating according to one of its ZA branches. Instead, all atoms would vibrate in phase inwards or outwards. In other words, one would obtain a NT vibrating according to its radial breathing mode (RBM) with a non-zero frequency. In the continuum limit this branch is expected to be flat around Γ and converge slowly towards ω = 0 with the NT radius [eqn (5)]. One can identify this branch around 4 meV for the two NTs.
 | ||
| Fig. 2 Phonon spectra of 1D and 2D MoS2. The left pane shows the spectrum of the (17,17) NT and the right pane shows that of the (24,0) NT, plotted from the Γ point to the edge of the Brillouin zone. Branches for the NT are colored according to the absolute value of m with dark blue corresponding to m = 0 and red corresponding to m = n. Branches with m = 0 and m = n are highlighted in bold. The central figure shows the spectrum of the monolayer. The states are colored according to the corresponding m value in the two NTs. The ML Raman and IR active modes are labeled by their irreps in blue and red respectively. The Raman- and IR-active modes of the NTs are also marked with blue and red lines next to the Γ points. | ||
3.2 Line groups of the NTs
While the “rolled-up sheet” view directly relates the NT band-structure to that of the ML, more insight into the nature of each quantum number is gained by an alternative method to arrive at the (qz, j, m) description. The method is based on the irreps of the line groups formed by the symmetry operations of the NTs,39–41 and presents several advantages. Most importantly, it provides selection rules for Raman and IR activity.40,42 Furthermore, it reveals the parity of each mode with respect to inversions across the symmetry planes containing the axis [in the (n,0) case] or perpendicular to it [in the (n,n) case], a symmetry which had not entered our analysis so far.The (n,0) NTs belong to the L(2n)nmc group and four one-dimensional, qA0, qAn, qB0, and qBn, and 2n − 2 two-dimensional irreps, qEm with 1 ≤ |m| ≤ n − 1, need to be considered for each value of q in the BZ. Among the one-dimensional irreps, modes belonging to A are even and modes belonging to B are odd with respect to inversion across a symmetry plane containing the NT axis. The subscript denotes the value of m in each case. At the Γ point, modes transforming according to 0A0 and 0E1 are IR-active, while those transforming according to 0B0 and 0E2 are Raman-active.43 Due to time-reversal symmetry, the frequencies only depend on |m|.
The (n,n) NTs belong to the L(2n)n/m group. For a q not at the center or the edge of the BZ, all irreps are two-dimensional, −qqEm with 0 ≤ |m| ≤ n. At Γ each of those can be further reduced according to parity with respect to inversion across the plane perpendicular to the NT axis, giving rise to the one-dimensional irreps 0A+m and 0A−m. Hence, IR and Raman activity analyses must be performed in terms of one-dimensional irreps. Modes transforming according to 0A−0 and 0A+1 are IR active, while those transforming according to 0A+0, 0A−1 and 0A+2 are Raman active.43Table 1 summarizes this information for both kinds of NTs.
| ZZ nanotubes | AM nanotubes | ||
|---|---|---|---|
| m = 0 | IR | 0A0 | 0A−0 |
| Raman | 0B0 | 0A+0 | |
| |m| = 1 | IR | 0E1 | 0A+1 |
| Raman | ∅ | 0A−1 | |
| |m| = 2 | IR | ∅ | ∅ |
| Raman | 0E2 | 0A+2 | |
The symmetry analysis makes it straightforward to identify the acoustic branches which can be related to the continuum limit and the modes of the ML. Specifically, the frequencies of the two lowest-lying branches with m = 0 become linear functions of qz, as the LA and TA modes of a beam. In light of the parities introduced above, for (n,0) NTs the lowest-lying branch in qA0 tends to the longitudinal acoustic branch, whereas the lowest-lying branch in qB0 converges to the transverse acoustic branch. For (n,n) NTs, in a neighborhood of Γ the LA and TA branches both emerge from −qqE0. Exactly at Γ the LA branch will connect to the zero-frequency vibrational mode in 0A0− and the TA branch will connect to the zero-frequency vibrational mode in 0A+0. For both kinds of NT, the next m = 0 branch in order of frequency has a nonzero horizontal asymptote in the q → 0 limit, corresponding to the RBM of a beam, rod or tubule, whereas the two degenerate lowest-lying branches with |m| = 1 converge to the quadratic ZA branches. In (n,0) NTs both ZA branches belong to qE1, whereas for (n,n) NTs one ZA branch emerges from each of the −qqE1. They are still degenerate because of the time-reversal symmetry, which is not part of the line group.
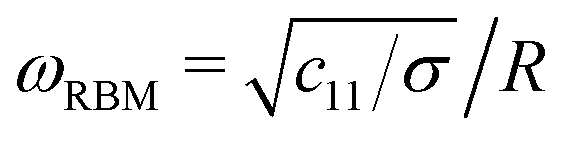
To illustrate the advantages of this method for calculating the phonon spectrum of a NT over the more usual approach that only takes into consideration the space group of the three-dimensional crystal formed by the NT and the simulation cell, in Fig. 3 we compare the results of both techniques for the case of the (17,17) MoS2 NT, focusing on the low-energy part of the spectrum. At least six kinds of artifacts can be identified, all of which are avoided by the symmetry-based analysis. The 3D calculation enforces the homogeneity but not the isotropy of free space, meaning that one of the acoustic branches is misidentified as optical, with a non-zero frequency at Γ. Furthermore, the two ZA branches are incorrectly described: in the case shown, they contain “pockets” of imaginary frequencies in the long-wavelength limits which mistakenly point to a mechanical instability of the system. More generally, the basic parameters of the acoustic branches, including the speed of sound, are grossly mispredicted. Finally, branches which should be degenerate because of the discrete rotational symmetries are split.
 | ||
| Fig. 3 Detail of the vibrational spectrum of the (17,17) MoS2 NT showing the main types of artifacts introduced by a calculation that treats it as a 3D crystal (gray lines) vs. our symmetry-adapted approach (colored lines): (1) there are three acoustic branches instead of four, (2) artifactual pockets of imaginary frequencies appear close to the Γ point, (3) degeneracies are spuriously broken, (4) crossings/avoided crossings are mispredicted, (5) the ZA branches are not quadratic, and (6) large errors are introduced in the predicted speeds of sound. Naturally, only with the symmetry-adapted method can one assign a value of |m| to each branch. | ||
3.3 The continuum limit
We start by assessing how well the continuum model of ref. 27 describes the acoustic branches and the RBM for the NTs studied here. The DFPT calculation yields elastic constants of c11 = 135 N m−1 and c66 = 51.6 N m−1 for the ML. These are corroborated from the values extracted from the LA and TA speeds of sound in the ML, c11 = 133 N m−1 and c66 = 46.5 Nm−1. The corresponding Poisson's ratio β = 0.24 is very close to the value of 0.25 reported by other authors.44 Using the calculated values for the ML, we evaluate the derivatives for the NTs in the continuum limit [eqn (2)] and give the results in Table 2.| (m,n) | R (Å) | ν TA (Å ps−1) | ν LA (Å ps−1) |
|
ω RBM (rad ps−1) |
|---|---|---|---|---|---|
| (9,0) | 5.3 | 32.3 (39.1) | 54.5 (64.3) | 249 (254) | 14.2 (12.4) |
| (6,6) | 5.8 | 29.9 (39.1) | 56.4 (64.3) | 270 (276) | 11.7 (11.5) |
| (12,0) | 6.7 | 33.8 (39.1) | 58.9 (64.3) | 313 (317) | 10.6 (9.90) |
| (9,9) | 8.3 | 35.6 (39.1) | 56.7 (64.3) | 387 (390) | 8.04 (8.00) |
| (12,12) | 10.7 | 36.4 (39.1) | 61.9 (64.3) | 504 (508) | 6.22 (6.13) |
| (24,0) | 12.5 | 41.5 (39.1) | 63.0 (64.3) | 530 (588) | 5.25 (5.28) |
| (17,17) | 15.1 | 36.1 (39.1) | 61.1 (64.3) | 310 (708) | 4.42 (4.38) |
The decomposition in terms of irreps makes it possible to identify the lowest m = 0 bands as the TA, LA and RBM and the lowest m = 1 band as the ZA of the NTs. Consequently, the group velocities and second-order coefficients can be extracted directly from the phonon spectra and compared to the continuum predictions [Table 2]. For the thinner NTs, the deviations are considerable and in general the agreement gets better with increasing diameter. Two different types of circumstances may contribute to this: local strain not completely captured by elasticity theory, and nonlocal interactions with parts of the sheet brought closer by the process of rolling up the NT. Thinner NTs deviate the most from the cylindrical geometry with uniform curvature, and have a shorter average interatomic distance that promotes interactions between different segments. The effect is more noticeable in the case of the TA branch, which involves displacements in the azimuthal direction, while the LA branch involves displacement along the z direction, which is not affected by the rolling-up. The frequencies of the RBM are predicted fairly accurately and their order is perfectly aligned with the ω ∝ R−1 prediction of eqn (2c). An exception to the general trend of better agreement between the continuum and atomistic predictions for thicker radii happens for the parabolic ZA branches, whose second derivative seems to be severely mispredicted for the (24,0) and (17,17) NTs. However, this disagreement essentially reflects that the quadratic part of the ZA branches covers only a small interval in the neighborhood of Γ, after which they hybridize with the other acoustic branches [Fig. 2].
3.4 Raman and IR activity
In Fig. 2 the Raman and IR active modes are marked. As can be seen the highest optical branches of the NTs are predicted to be Raman active. For the (24,0) NT they transform according to the 0E2 irrep, whereas for the (17,17) NT two modes near the band edge transform according to 0A+0 and 0A+2. In the ML the highest optical branch transforms as A2′′ and is Raman inactive [Fig. 2]. In this respect it is interesting that the Raman spectrum of the related WS2 NT shows a clear peak at around 420 cm−1 (52 meV),45 corresponding to the highest optical branch (located at 57 meV in MoS2). This illustrates how the ML does not necessarily provide a good description of the symmetry and spectroscopic behavior of the NT vibrations. The same experimental data show what is presumably a combination mode approximately 60 cm−1 (7 meV) above the band edge in the IR.45 The symmetry analysis shows that both types of NTs have IR active low-lying modes in the frequency range from 4–9 meV. As will be discussed in the following, these correspond to the Γ point but m ≠ 0 modes of the NTs and thus to off-Γ point modes in the ML.The different IR and Raman activity, but overall agreement between the ML and large-radius NT bands [Fig. 2] makes it interesting to investigate the relation further. As mentioned above, phonon wave vectors parallel to the NT axis are parallel to the b2 and to b1 + 2b2 vectors for the (n,0) and (n,n) NTs, repectively. The m ≠ 0 modes thus correspond to phonon modes in the ML with a projection of  along an axis perpendicular to the NT axis, which are defined by b2 and b1 + 2b2 for the (n,n) and (n,0) NTs. In Fig. 4 we plot the frequencies of all IR- and Raman-active modes at the Γ point of the NTs, and compare them with the acoustic branches of the MoS2 ML plotted along the corresponding directions, with the relevant wave number (m, or the corresponding component of q) reduced to the same scale. Given the values of |m| < 3 of all Raman- and IR-active irreps, the
  value of the detectable modes depends fundamentally on the value of n and thereby on the NT radius. This explains why points towards the right of both panels in Fig. 4 deviate more clearly from the bulk phonon bands. They correspond to NTs with smaller diameters, and thus are more affected by the curvature and inter-segment interactions. For smaller values of q the active vibrational modes of the NTs trace the linear acoustic branches of the bulk very closely. This is, however, not the case for the ZA branch of the ML, whose curvature is much higher than what a naive reading of the NT results would suggest, even if restricted to the same range of q values that give good results for the linear branches. Hence, understanding and accounting for this deviation is the crucial step missing if one wants to reconstruct the most relevant features of the acoustic branches of ML MoS2.
 | ||
| Fig. 4 IR- (red) and Raman- (blue) active modes at Γ for all the NTs studied. The phonon branches of the bulk monolayer along the corresponding direction in reciprocal space (see the main text) are plotted for comparison. The horizontal axis represents a dimensionless wave number:|m|/n for the NTs and a projection between 0 and 1 along the reciprocal lattice vector perpendicular to the NT axis for the monolayer. For modes with m = 0 we only show the points obtained for the thickest NTs. | ||
We have already mentioned how the RBM has full rotational symmetry (m = 0) while the ZA branches of the NT belong to irreps with m = 1. Hence, the approximation to the ZA branch of the ML reconstructed from a single NT by sampling the corresponding modes at Γ and taking  will not have a minimum at m = 0, but two minima at m = ±1, making it a poor estimate of the actual ML phonon branch. Moreover, the frequency of the RBM at q = 0 does not depend on the flexural rigidity of the ML [eqn (2d)], which determines the curvature of the ZA branch of the ML [eqn (2c)], but on the speed of sound of the linear branches. This suggests the possibility of devising a scheme to eliminate that effect and extract a corrected curvature.
For each of the low-lying triangles in Fig. 4 corresponding to the NT branches with |m| = 2 that we would like to use to reconstruct the ZA branch of the bulk, we define a “corrected q” as Q = 2π(|m| − m0)f/n. Here, f is a predefined factor with the values 1 and  for the AM and ZZ NTs, respectively, and m0 ∈ (0,1) is a uniform offset. The f prefactor ensures that all wave numbers are measured in the same units, in keeping with the reciprocal-space basis discussed above. m0 accounts for the nonzero RBM frequency, and becomes less relevant with increased n, consistent with the continuum limit [eqn (2d)]. We then fit the frequencies of those points to a parabola of the form
  , with k and m0 as fitting parameters. The result is shown in Fig. 5. The fitted value of m0 is 0.69, and the curvature of the ZA branch close to Γ is in excellent agreement with the actual calculation. It is important to emphasize that the curve is not fitted to the ML data, but to the Raman-active frequencies of the NTs. The introduction of f allows us to obtain better statistics for the fit by including both types of NTs in the same plot, and is consistent with the prediction of an isotropic curvature in eqn (2c).
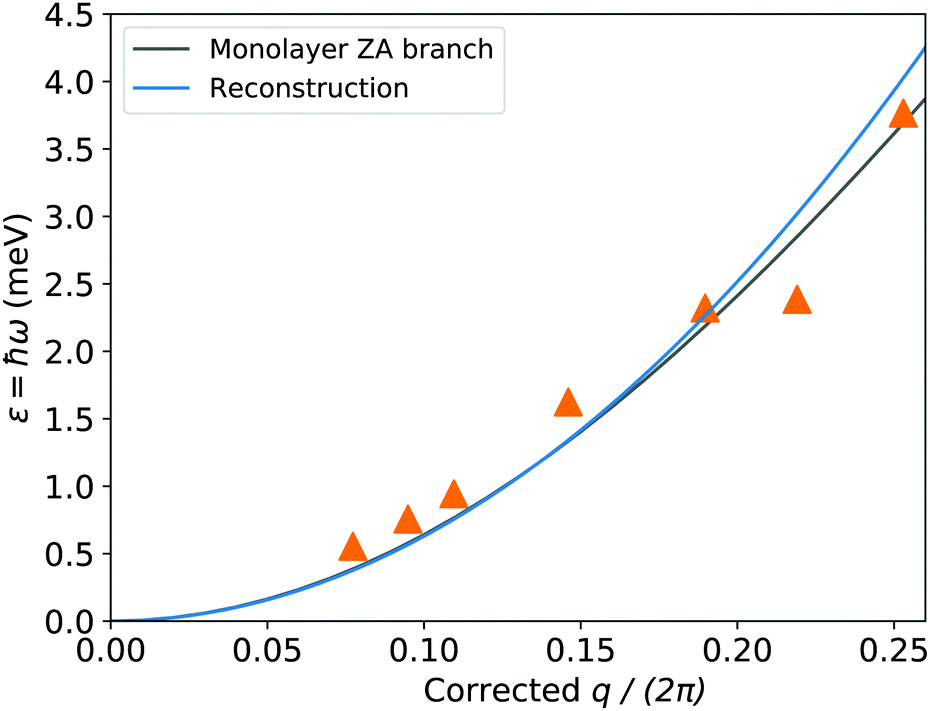 | ||
| Fig. 5 Reconstruction of the ZA branch of monolayer MoS2 based on the low-lying points with |m| = 2 from Fig. 4, after applying the correction described in the main text. Note that the blue curve is fitted to the orange points and not to the reference bulk band (gray) but manages to reproduce the curvature of the latter. | ||
An interesting question when trying to apply this set of techniques to obtain information about the spectrum of other 2D crystals is which NTs to choose. Is it likely that some preexisting constraints exist: for instance, NTs of a particular chirality might be easier to synthesize. However, some general guidelines can be formulated. Firstly, although large NTs should, in principle, provide a better approximation of bulk-like behavior, and sample the monolayer dispersions at points closer to Γ, our example shows that NTs with diameters in the nm scale can afford very good results. Using smaller NTs has the advantage that the frequencies to be measured are larger and more spaced. Moreover, the isotropy predicted by eqn (2c) can be exploited by combining data from NTs with different chiralities to obtain more points in the same range of frequencies and therefore a better characterization of the ZA branch of the monolayer.
3.5 Phonon transmission
In order to perform a more global comparison between the spectrum of the NTs and that of the bulk, we compute the ballistic phonon transmission in the Landauer formalism, T(ω). This is both a count of the number of phonon modes available to transfer energy at a particular frequency, and an upper bound to the transmission in a defect-laden NT.46,47 Hence it is also an important variable in assessing the suitability of the NTs for heat transport. In 1D systems the ballistic transmission can be computed directly from the definition: each branch ωj(qz) is evaluated on a dense q-point grid and split into monotonic segments that can be inverted to give q(ω); the number of such functions available at a particular frequency is the transmission. For the ML one can only define a number of phonon transmission channels per unit of length in the direction perpendicular to transport. This transmission per unit length is easily reformulated as: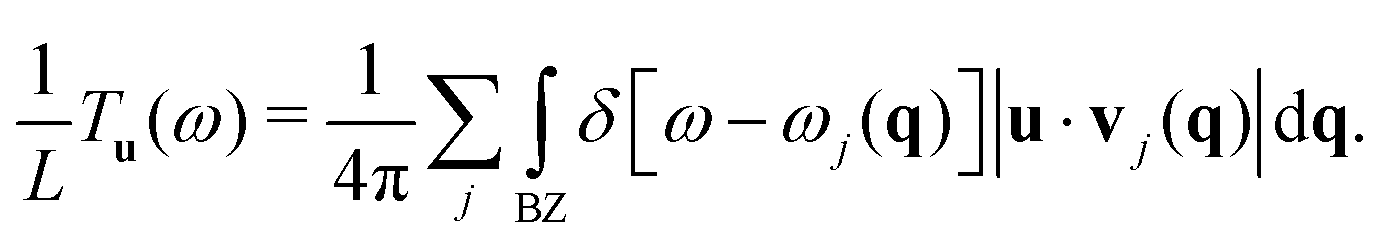 | (3) |
Fig. 6 shows the result for all transmissions per unit length. The NTs with the largest diameters show an almost perfect ML-like transmission in the part of the spectrum below ∼30 meV (corresponding to the acoustic branches of the bulk ML) thanks to the contributions of higher values of |m|. This is to be expected since thicker NTs are locally closer to a planar structure and also less affected by the discretization of m, but it is still remarkable that the (9,9) is already close to the bulk in this region. In contrast, even for those thicker NTs the high-energy region of the phonon spectrum has marked discrepancies with the ML and a clear dependence on size and chirality. This phenomenon is most clearly observable by focusing on the region from 30 meV to 36 meV, a gap devoid of allowed phonon modes in the ML: in the (12,12) NT the gap is shifted to the left, while in the (12,0) NT it appears shifted to the right, with a second gap at a slightly lower frequency, and in the (9,9) NT it almost disappears due to the appearance of a new bundle of branches in that region of the spectrum.
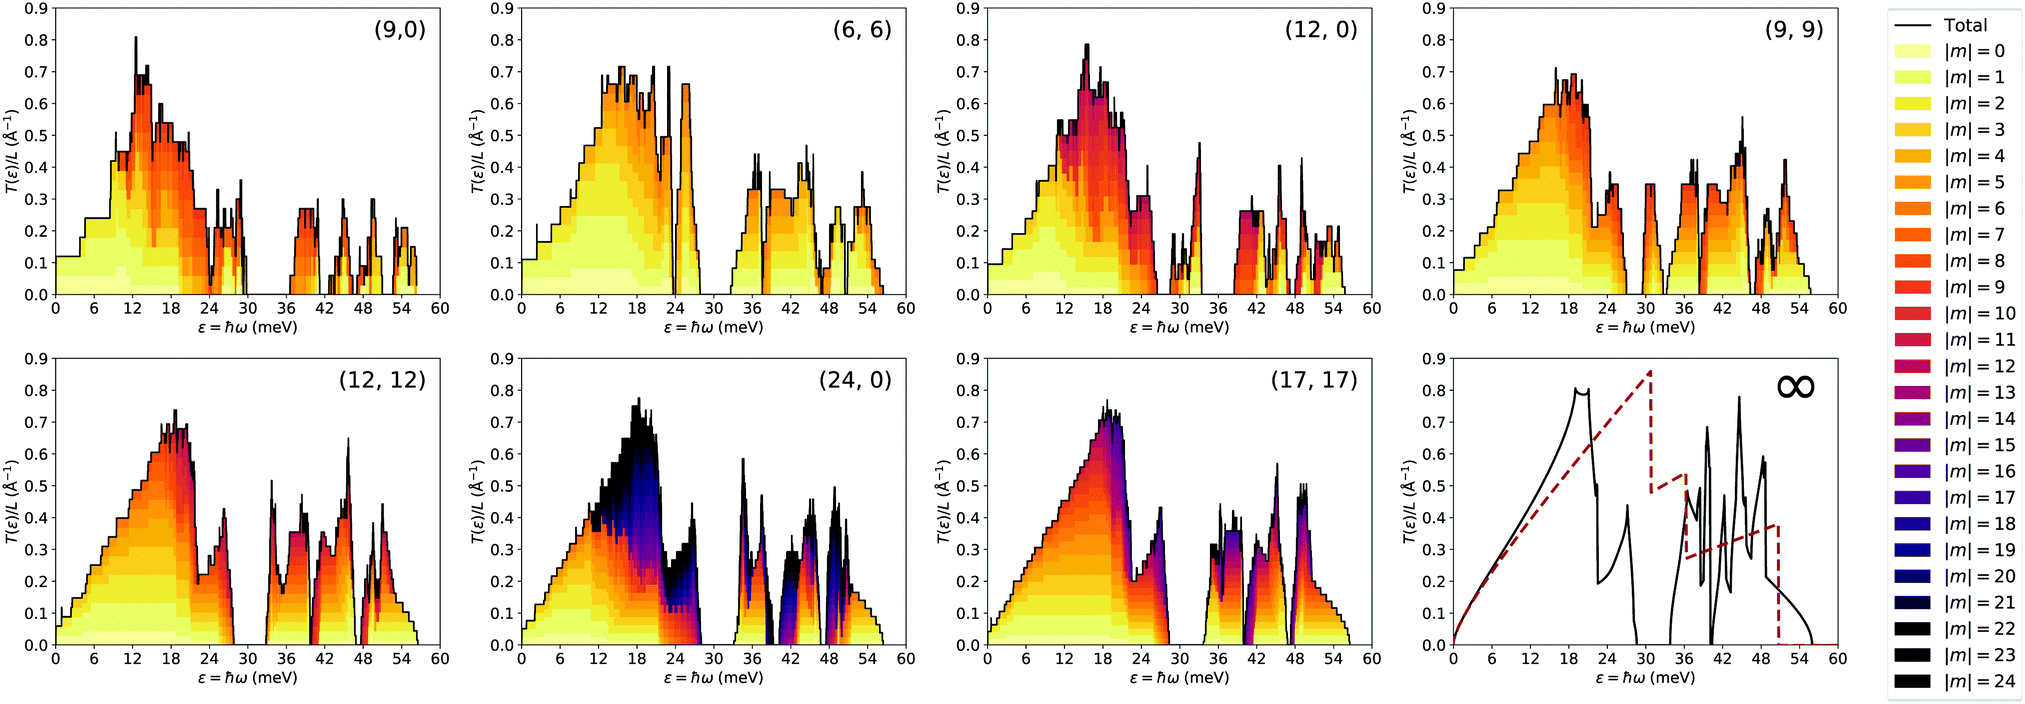 | ||
| Fig. 6 Ballistic phonon transmission of all stable NTs studied in this work, normalized to the perimeter of each NT and decomposed in contributions from each value of |m|. The ballistic phonon transmission per unit length of the monolayer and an approximation based on a Debye-like model (dashed red line) using the first nonzero derivative of each branch at Γ are included for comparison. | ||
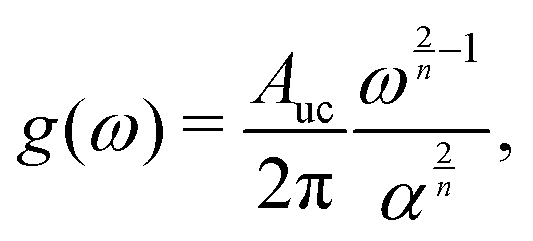
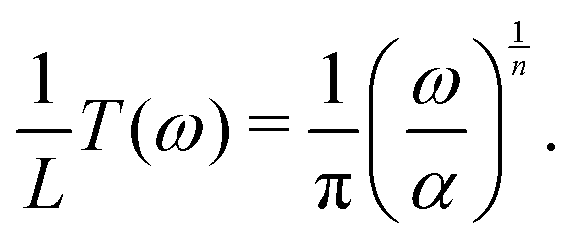
The pieces of information obtained above (speeds of sound of the TA and LA branches, and second derivative of the ZA branch) can be used to build a Debye-like model to obtain a first approximation to the phonon transmission. The contribution to the density of states per unit cell from a phonon branch whose dispersion follows a power law of the form ω = αqn is
 | (4) |
 | (5) |
4 Conclusions
We have performed ab initio calculations for the phonon dispersions of the MoS2 monolayer, and for a set of zigzag and armchair MoS2 nanotubes with different radii. We have employed a method based on symmetry-adapted projection operators that clearly splits the numerous phonon branches among irreducible representations of the line group of each NT and determine which of them are infrared- or Raman-active.Based on these results and on the connections between the phonon branches of quasi-2D materials and the continuum theory of elastic waves, we have proposed a method to reconstruct the slopes of the two linear branches and the second derivative of the quadratic acoustic branch of a 2D ML based on measurements of the corresponding NTs. The proposed method has the advantage of relying only on Raman and infrared measurements of modes at the Γ point, which are more easily accessible than specialized techniques like inelastic neutron scattering that can offer a more comprehensive picture of the ML phonon bands. We have tested the proposed method on MoS2, showing a very good agreement with direct ab initio calculations. Finally, we have used the reconstructed branches to create an estimate of the phonon transmission of single-layer MoS2, which provides a reasonable level of accuracy in the low-energy region.
Our method and results provide an alternative method to access information about the low-frequency vibrational modes of 2D materials that is difficult to measure directly. Those pieces of information act as a first fundamental building block and a way to test models of their thermal transport properties, which are crucial in several applications. Furthermore, we have provided a detailed example of a symmetry-based approach for the phonon spectrum of a relatively complex family of nanotubes, which significantly reduces the complexity of the problem and provides important additional information about the results.
Conflicts of interest
There are no conflicts to declare.Acknowledgements
Work by V. N. T. is supported by the Vietnamese National Foundation for Science and Technology Development (NAFOSTED) under Grant No. 103.01-2017.24 and the ASEAN-European Academic University Network (ASEA-UNINET). The computational results presented have been achieved in part using the Vienna Scientific Cluster (VSC).References
- A. Gupta, V. Arunachalam and S. Vasudevan, J. Phys. Chem. Lett., 2016, 7, 4884–4890 CrossRef CAS PubMed.
- Q. H. Wang, K. Kalantar-Zadeh, A. Kis, J. N. Coleman and M. S. Strano, Nat. Nanotechnol., 2012, 7, 699–712 CrossRef CAS PubMed.
- R. Tenne, L. Margulis, M. Genut and G. Hodes, Nature, 1992, 360, 444–446 CrossRef CAS.
- Y. Feldman, E. Wasserman, D. J. Srolovitz and R. Tenne, Science, 1995, 267, 222–225 CrossRef CAS PubMed.
- G. Seifert, H. Terrones, M. Terrones, G. Jungnickel and T. Frauenheim, Phys. Rev. Lett., 2000, 85, 146–149 CrossRef CAS PubMed.
- M. Ghorbani-Asl, N. Zibouche, M. Wahiduzzaman, A. F. Oliveira, A. Kuc and T. Heine, Sci. Rep., 2013, 10, 2961 CrossRef PubMed.
- F. L. Deepak and M. Jose-Yacaman, Isr. J. Chem., 2010, 50, 426–438 CrossRef CAS.
- X. Wang, W. Xing, X. Feng, L. Song and Y. Hu, Polym. Rev., 2017, 57, 440–466 CrossRef CAS.
- M. Strojnik, A. Kovic, A. Mrzel, J. Buh, J. Strle and D. Mihailovic, AIP Adv., 2014, 4, 097114 CrossRef.
- R. Tenne, R. Rosentsveig and A. Zak, Phys. Status Solidi A, 2013, 210, 2253–2258 CrossRef CAS.
- R. Tenne, Front. Phys., 2014, 9, 370–377 CrossRef.
- N. A. Kumar, M. A. Dar, R. Gul and J.-B. Baek, Mater. Today, 2015, 18, 286–298 CrossRef CAS.
- J. Carrete, L. J. Gallego and N. Mingo, J. Phys. Chem. Lett., 2017, 8, 1375–1380 CrossRef CAS PubMed.
- L. Lindsay, W. Li, J. Carrete, N. Mingo, D. A. Broido and T. L. Reinecke, Phys. Rev. B: Condens. Matter Mater. Phys., 2014, 89, 155426 CrossRef.
- G. Fugallo, A. Cepellotti, L. Paulatto, M. Lazzeri, N. Marzari and F. Mauri, Nano Lett., 2014, 14, 6109–6114 CrossRef CAS PubMed.
- X. Xu, L. F. C. Pereira, Y. Wang, J. Wu, K. Zhang, X. Zhao, S. Bae, C. T. Bui, R. Xie, J. T. L. Thong, B. H. Hong, K. P. Loh, D. Donadio, B. Li and B. Oezyilmaz, Nat. Commun., 2014, 5, 3689 CrossRef CAS PubMed.
- P. Kim, L. Shi, A. Majumdar and P. L. McEuen, Phys. Rev. Lett., 2001, 87, 215502 CrossRef CAS PubMed.
- M. Fujii, X. Zhang, H. Xie, H. Ago, K. Takahashi, T. Ikuta, H. Abe and T. Shimizu, Phys. Rev. Lett., 2005, 95, 065502 CrossRef PubMed.
- C. Yu, L. Shi, Z. Yao, D. Li and A. Majumdar, Nano Lett., 2005, 5, 1842–1846 CrossRef CAS PubMed.
- E. Pop, D. Mann, Q. Wang, K. Goodson and H. Dai, Nano Lett., 2006, 6, 96–100 CrossRef CAS PubMed.
- A. Molina-Sánchez and L. Wirtz, Phys. Rev. B: Condens. Matter Mater. Phys., 2011, 8415, 155413 CrossRef.
- W. Li, J. Carrete and N. Mingo, Appl. Phys. Lett., 2013, 103, 253103 CrossRef.
- J.-W. Jiang, B.-S. Wang and T. Rabczuk, Nanotechnology, 2014, 25, 105706 CrossRef PubMed.
- M. Damnjanović, T. Vuković and I. Milošsević, Isr. J. Chem., 2017, 57, 450–460 CrossRef.
- J. Carrete, W. Li, L. Lindsay, D. A. Broido, L. J. Gallego and N. Mingo, Mater. Res. Lett., 2016, 4, 204–211 CrossRef CAS.
- D. Liu, A. G. Every and D. Tománek, Phys. Rev. B: Condens. Matter Mater. Phys., 2016, 94, 165432 CrossRef.
- D. Liu, A. G. Every and D. Tománek, Phys. Rev. B: Condens. Matter Mater. Phys., 2017, 95, 205407 CrossRef.
- B. S. Hudson, J. Phys. Chem. A, 2001, 105, 3949–3960 CrossRef CAS.
- R. Saito, M. Fujita, G. Dresselhaus and M. S. Dresselhaus, Appl. Phys. Lett., 1992, 60, 2204–2206 CrossRef CAS.
- G. Kresse and D. Joubert, Phys. Rev. B: Condens. Matter Mater. Phys., 1999, 59, 1758–1775 CrossRef CAS.
- P. E. Blöchl, Phys. Rev. B: Condens. Matter Mater. Phys., 1994, 50, 17953–17979 CrossRef.
- J. P. Perdew, K. Burke and M. Ernzerhof, Phys. Rev. Lett., 1996, 77, 3865–3868 CrossRef CAS PubMed.
- R. Soklaski, Y. Liang and L. Yang, Appl. Phys. Lett., 2014, 104, 193110 CrossRef.
- A. Togo and I. Tanaka, Scr. Mater., 2015, 108, 1–5 CrossRef CAS.
- F. A. Cotton, Chemical applications of group theory, Wiley, 1990 Search PubMed.
- P.-G. Martinsson, V. Rokhlin and M. Tygert, Appl. Comput. Harmon. Anal., 2011, 30, 47–68 CrossRef.
- L. Landau, E. Lifshitz, A. Kosevich and L. Pitaevski, Theory of Elasticity, Butterworth-Heinemann, 1986 Search PubMed.
- L. Lindsay, D. A. Broido and N. Mingo, Phys. Rev. B: Condens. Matter Mater. Phys., 2009, 80, 125407 CrossRef.
- I. B. Bozovic, M. Vujicic and F. Herbut, J. Phys. A: Math. Gen., 1978, 11, 2133 CrossRef CAS.
- I. B. Bozovic and M. Vujicic, J. Phys. A: Math. Gen., 1981, 14, 777 CrossRef CAS.
- M. Damnjanović and I. Milošsević, Line Groups in Physics, Springer Berlin Heidelberg, Berlin, Heidelberg, 2010, vol. 801 Search PubMed.
- I. Milošsević, T. Vuković, M. Damnjanović and B. Nikolić, Eur. Phys. J. B, 2000, 17, 707–712 CrossRef.
- M. Damnjanović, E. Dobardšsić, I. Milošsević, M. Viršek and M. Remškar, Mater. Manuf. Processes, 2008, 23, 579–582 CrossRef.
- K. Liu, Q. Yan, M. Chen, W. Fan, Y. Sun, J. Suh, D. Fu, S. Lee, J. Zhou, S. Tongay, J. Ji, J. B. Neaton and J. Wu, Nano Lett., 2014, 14, 5097–5103 CrossRef CAS PubMed.
- K. R. O’Neal, J. G. Cherian, A. Zak, R. Tenne, Z. Liu and J. L. Musfeldt, Nano Lett., 2016, 16, 993–999 CrossRef PubMed.
- I. Savić, N. Mingo and D. A. Stewart, Phys. Rev. Lett., 2008, 101, 165502 CrossRef.
- J. Carrete, L. J. Gallego, L. M. Varela and N. Mingo, Phys. Rev. B: Condens. Matter Mater. Phys., 2011, 84, 075403 CrossRef.
- W. Li, J. Carrete, N. A. Katcho and N. Mingo, Comput. Phys. Commun., 2014, 185, 1747 CrossRef CAS.
| This journal is © the Owner Societies 2019 |