 Open Access Article
Creative Commons Attribution 3.0 Unported Licence
Experimental and theoretical 2p core-level spectra of size-selected gas-phase aluminum and silicon cluster cations: chemical shifts, geometric structure, and coordination-dependent screening†
Michael
Walter
 *ab,
Marlene
Vogel
c,
Vicente
Zamudio-Bayer
 d,
Rebecka
Lindblad
 de,
Thomas
Reichenbach
b,
Konstantin
Hirsch
 c,
Andreas
Langenberg
 c,
Jochen
Rittmann
c,
Alexander
Kulesza
c,
Jochen
Rittmann
c,
Alexander
Kulesza
 f,
Roland
Mitrić
 g,
Michael
Moseler
 bh,
Thomas
Möller
i,
Bernd
von Issendorff
 h and
J. Tobias
Lau
 *dh
*dh
aFreiburger Zentrum für interaktive Werkstoffe und bioinspirierte Technologien, Universität Freiburg, Georges-Köhler-Allee 105, 79110 Freiburg, Germany. E-mail: michael.walter@fmf.uni-freiburg.de
bFraunhofer IWM, MikroTribologie CentrumμTC, Wöhlerstraße 11, 79108 Freiburg, Germany
cInstitut für Methoden und Instrumentierung der Forschung mit Synchrotronstrahlung, Helmholtz-Zentrum Berlin für Materialien und Energie, Albert-Einstein-Straße 15, 12489 Berlin, Germany
dAbteilung für Hochempfindliche Röntgenspektroskopie, Helmholtz-Zentrum Berlin für Materialien und Energie, Albert-Einstein-Straße 15, 12489 Berlin, Germany. E-mail: tobias.lau@helmholtz-berlin.de
eDepartment of Physics, Lund University, Box 118, 22100 Lund, Sweden
fFachbereich Physik, Freie Universität Berlin, Arnimallee 14, 14195 Berlin, Germany
gInstitut für Physikalische und Theoretische Chemie, Universität Würzburg, Emil-Fischer-Straße 42, 97074 Würzburg, Germany
hPhysikalisches Institut, Universität Freiburg, Hermann-Herder-Straße 3, 79104 Freiburg, Germany
iInstitut für Optik und Atomare Physik, Technische Universität Berlin, Hardenbergstraße 36, 10623 Berlin, Germany
First published on 25th February 2019
Abstract
We present 2p core-level spectra of size-selected aluminum and silicon cluster cations from soft X-ray photoionization efficiency curves and density functional theory. The experimental and theoretical results are in very good quantitative agreement and allow for geometric structure determination. New ground state geometries for Al12+, Si15+, Si16+, and Si19+ are proposed on this basis. The chemical shifts of the 2p electron binding energies reveal a substantial difference for aluminum and silicon clusters: while in aluminum the 2p electron binding energy decreases with increasing coordination number, no such correlation was observed for silicon. The 2p binding energy shifts in clusters of both elements differ strongly from those of the corresponding bulk matter. For aluminum clusters, the core-level shifts between outer shell atoms and the encapsulated atom are of opposite sign and one order of magnitude larger than the corresponding core-level shift between surface and bulk atoms in the solid. For silicon clusters, the core-level shifts are of the same order of magnitude in clusters and in bulk silicon but no obvious correlation of chemical shift and bond length, as present for reconstructed silicon surfaces, are observed.
1 Introduction
The investigation of materials properties at the nanoscale remains a very attractive field of study not only because of potential applications such as in semiconductor information technology but also because it allows for obtaining fundamental knowledge on the interplay of electronic and geometric structure, which is essential for the improvement of theoretical modeling that has become an indispensable tool in materials research. The regime of small clusters is particularly interesting because one can learn about electronic and structural properties in a size-range where many unusual structures exist and electronic properties can be very different from bulk. For this reason, size-selected clusters have been studied as model systems in order to obtain information on, e.g., ionization energies,1,2 fragmentation pathways,3 reactivity towards gaseous molecules,4–7 or interaction with a surface or support.8,9 Experimental exploration of the most stable structures of small metal or semiconductor particles is a rather difficult task as the particles are typically too small to be observed directly, in spite of a remarkable progress in this direction.10,11 Therefore joint efforts are made for experiments and simulations to relate observables to structural properties. Typical methods used in this context are electron diffraction,12 ion mobility mass spectrometry,13–15 infrared, visible, and ultraviolet photodissociation spectroscopy,16–18 valence band photoionisation,2 as well as ultraviolet photoelectron spectroscopy.19–22 Recently, core-level spectra, which are known to provide direct information about the local electronic structure,23 have also been introduced for geometric structure determination of size-selected gas-phase clusters.24Aluminum and silicon, as neighbouring elements in the periodic table, are very different materials: aluminum is a trivalent metal with free-electron like bands and a complex Fermi surface whereas silicon is a semiconductor with directional covalent bonding because of tetrahedral sp3 hybridization. These differences are reflected in very different atomic packing factors of 0.74 for fcc aluminum but only 0.34 for diamond-lattice silicon. Not only the bulk solids but also clusters of aluminum and silicon have very different structural and electronic properties. Medium-sized aluminum clusters generally prefer rather compact structures.21,25 Smaller aluminum clusters with ≤21 atoms adopt structures that are based on icosahedral growth patterns,25 where anionic Al13− forms a perfect icosahedron because of electronic and geometric shell closure.2 Larger clusters already show first expression of the bulk fcc arrangement, albeit still in competition with decahedral or disordered structures.25 With respect to the electronic structure of aluminum clusters, it was found that at least some cluster sizes express an electronic shell structure as expected from a simple spherical jellium model, in spite of the trivalent nature of aluminum, although the model does not deliver a correct description for all cluster sizes.21 The bonding can thus be described as non-directional and metallic. Medium-sized silicon clusters with less than 30 atoms, on the other hand, are characterized by rich growth patterns due to directional bonding that lead to a variety of different structures with similar total energy.13 Geometric structures that are based on a nine-atom tricapped trigonal prism unit26 have often been assigned as low-lying isomers of silicon clusters. The same structural motif exists in the trigonal prism Si6 cluster for which a relatively large binding energy of 3.42(4) eV per atom is reported.27 In the size range of ≈20–30 atoms per cluster, the stacking of tricapped trigonal prism units presumably results in the extended, prolate structures before the observed prolate-to-spherical or extended-to-compact transition of the cluster geometries takes place.13–15,28,29 Smaller silicon clusters with n < 20 form relatively open structures in general, such that Si13+, e.g., does not possess icosahedral geometry.18,24
Synchrotron based core-level spectroscopy techniques, such as X-ray photoelectron spectroscopy, have been used to study free clusters of rare gases, molecules and metals.30–33 For metallic clusters in neutral cluster beams, the average cluster size of the broad size distribution in these experiments has, however, typically been very large, with cluster sizes of up to 1000 atoms. Free size-selected clusters are more challenging to study due to the low sample density, but core level binding energy spectra have nevertheless been obtained using vacuum-ultraviolet, extreme-ultraviolet, and soft-X-ray radiation from free-electron lasers34,35 or storage rings.36 These investigations also include vacuum-ultraviolet and soft X-ray photoionization studies of size-selected silicon clusters.24,37–39
Depending on the level of spectral resolution and inhomogeneous broadening, most of these studies either focus on the size-dependent electrostatic charging energy contribution to ionization potentials40,41 or decompose the spectra into known surface and bulk contributions to the electron binding energy as a way to determine cluster and nanoparticle radii. Only recently an example has been given of geometric structure determination from a detailed analysis of core-level binding energy shifts in size-selected silicon clusters.24
Here we present a detailed study of 2p core-level binding energy spectra of size-selected aluminum and silicon cluster cations in combination with density functional theory calculations. While core-level shifts in aluminum clusters can be easily understood in terms of structural parameters, no simple explanation for the strong variation of core-level shifts in silicon clusters24 can be given so far. Nevertheless, the experimental spectra can in all cases be well reproduced by theory for the energetically lowest lying isomer, confirming the structural sensitivity of core-level binding energy spectra.
2 Experimental and theoretical methods
2.1 Cluster source and ion trap setup for spectroscopy with synchrotron radiation
The experimental studies were performed in a dedicated setup for core-level spectroscopy of size-selected cluster ions with synchrotron radiation.42 Aluminum and silicon cluster ions were generated by magnetron sputtering of high-purity (99.999%) aluminum and p-type silicon sputtering targets with mixed argon (flow rate ≈ 0.1 l min−1) and helium (flow rate ≈ 0.5 l min−1) gas at typical pressures of ≈0.1–1 mbar in a liquid-nitrogen-cooled gas-aggregation cluster source. High-purity (99.9999%) gases were used in all cases. Cationic clusters were collected at the cluster source exit diaphragm and were guided by a radio-frequency hexapole ion guide through a differential pumping stage into a radio-frequency quadrupole mass filter. Beams of mass-selected cluster ions were guided by electrostatic ion lenses into a liquid-nitrogen cooled linear quadrupole ion trap where they were thermalized by collisions with ≈10−4 mbar helium buffer gas. Extreme-ultraviolet to soft X-ray radiation from BESSY II undulator beamline U125/2-SGM was coupled into the ion trap on-axis for maximum overlap with the ion cloud.42,43 Photon-energy dependent photoionization and photofragmentation mass spectra24 were recorded by sweeping the photon energy across the aluminum and silicon 2p edges with photon energy bandwidth and step width of 50–100 meV, where a step size of 100 meV was used for overview scans while 50 meV steps were used for a detailed investigation in the vicinity of the continuum step edge that is used to determine the 2p electron binding energy. The accuracy of the absolute photon energy calibration was 200 meV and 300 meV for the aluminum and silicon 2p edges, respectively, as verified for the helium double resonance excitation.44 Product ions that were generated in the photoexcitation and decay processes were collected in the ion trap along with the parent ions and extracted as ion bunches by a pulsed exit aperture. The extracted ion bunches were then deflected by 90° by an electrostatic quadrupole deflector and guided, by electrostatic ion lenses, into the first acceleration stage of a reflectron time-of-flight mass spectrometer for detection.42 The photon energy dependence of the individual product ion intensities gave the partial ion yield spectra that were analyzed to obtain the 2p core-level spectra from photoionization efficiency curves.24,382.2 Core-level spectra from photoionization efficiency curves
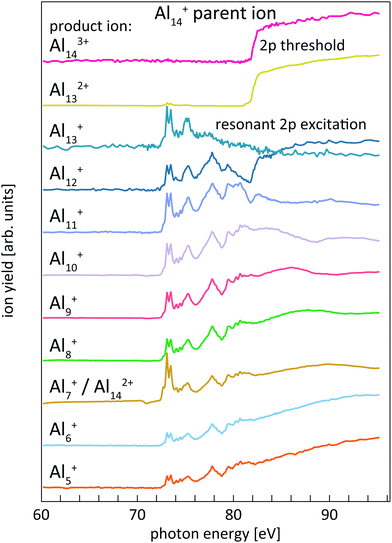
The determination of core-level electron binding energies from 2p photoionization efficiency curves has already been reported in detail for size-selected pristine and doped silicon cluster cations;24,38 therefore only a brief summary will be given here. Resonant 2p → nd, (n + 1)s photoexcitation and direct 2p → εl photoionization of size-selected aluminum and silicon cluster cations occur at photon energies above the respective thresholds. Both processes are followed by Auger decay of the 2p core-excited state. For the excitations considered here, Auger decay leads to up to triply charged cluster ions with the same number of atoms as in the parent ion. The resulting excited cluster ions typically carry sufficient internal energy to undergo dissociation, resulting in complex photoionization mass spectra.24,38,39 Both, ion intensity and mass-to-charge distribution of the product ions, change markedly as a function of photon energy for aluminum and silicon cluster 2p excitation. These Alnq+ partial ion yield spectra are exemplarily shown in Fig. 1 for 2p excitation of the parent ion Al14+.Similar to the case of silicon clusters,24 also for aluminum clusters the direct 2p photoionization shows up as a pronounced step edge at threshold only in specific ion yield channels as shown in the upper traces of Fig. 1 for Al14+. As summarized in Table 1 and shown in Fig. 1, these are mainly Aln3+, Aln−12+, and Aln−2+ product ions for Aln+ parent ions in the size range that is investigated here, i.e., these product ion channels are linked by the sequential loss of Al+ ions. Direct 2p photoionization of Aln+ and subsequent LVV Auger decay creates two additional holes in the 3s and 3p derived valence states, in addition to the valence hole that is already present in the monocation parent. In contrast to Sin+ clusters,24 where directional bonding results in complex fragmentation patterns, relaxation of the excited state in Alnq+ occurs via loss of Al+, by asymmetric fission, or by evaporation of aluminum atoms from the thermally excited cluster after internal vibrational relaxation.
| Parent ion | Product ions | Corrected by |
|---|---|---|
| Al12+ | Al112+ | |
| Al13+ | Al122+ | Al7+ |
| Al14+ | Al143+, Al132+ | |
| Al15+ | Al142+, (Al132+, Al13+) | Al6+, Al9+ |
This is exemplarily shown for 2p excitation of the Al14+ parent ion in Fig. 1 by the Aln+ (n = 5–12) ion yield channels. Since aluminum is a mononuclidic element, Al(n−1)/2+ signals coincide in the mass spectrum with Aln−12+ for odd numbers of atoms n in the parent ion Aln+. This complicates the analysis, because the partial ion yield contributions of doubly charged species that contain information on the direct 2p photoionization process have to be separated from the overlapping contributions of singly charged species that contain information on the resonant X-ray absorption process. This separation is achieved by subtracting partial ion yield signals that only contain the resonant part of the spectrum, typically Al[(n−1)/2]±1+, from ion yield curves that show strong direct photoionization steps but are masked by resonant photoionization. Even though 2p excitation energies of aluminum and silicon are of the same order of magnitude, and clusters of similar size are studied here, direct and resonant photoionization channels were separated more clearly in the case of silicon clusters, presumably because of differences in directional covalent and non-directional metallic bonding. This leads to a lower signal-to-noise ratio in the experimental photoionization efficiency spectra of Aln+ as compared to Sin+. To reduce the noise level in the experimental data, photon energy steps of 50 meV were binned to 100 meV steps in the data evaluation process. After binning, the direct 2p photoionization efficiency curves for a given parent ion were summed up and differentiated with respect to photon energy, which yields 2p core-electron binding energy spectra as illustrated in Fig. 2.
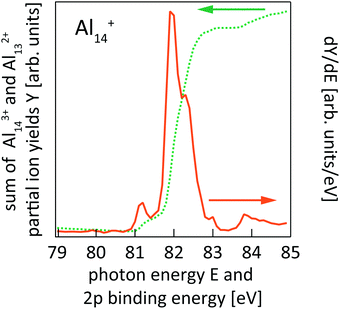 | ||
| Fig. 2 Sum of Al143+ and Al132+ partial ion yield channels of Al14+ 2p photoionization (cf.Fig. 1) after binning to 100 meV photon energy steps (dotted line) and the derivative of the partial ion yield with respect to photon energy (solid line) which gives the 2p core-level binding energy spectrum of Al14+. | ||
2.3 Global optimization of cationic aluminum and silicon clusters
For comparison with the experimental data, available ground state geometries of aluminum and silicon cluster cations18,25 and neutrals13 in the size-range of interest were reoptimized and tested. In cases where no reported structures were available or where reported geometries failed to reproduce the experimental 2p binding energy spectra, two variants of global optimization were applied. Global minima of Sin+ clusters with n = 14, 15, 16, 18, 19 were searched for using the genetic algorithm implemented by Vilhelmsen and Hammer,45 detailed parameters of which are summarized in the ESI.† This structure search was performed with spin-paired density functional theory calculations as implemented in GPAW46,47 within the projector augmented wave formalism.48 The exchange correlation energy was evaluated in the approximations devised by Perdew, Becke and Ernzerhof49 (PBE) and the smooth part of the Kohn–Sham states and the density were represented on real space grids with grid spacing of 0.2 Å for the wave functions and 0.1 Å for the density. The grid was ensured to contain a spatial region of at least 4 Å around each atom; Dirichlet (zero) boundary conditions were applied outside. The structures were considered to be relaxed when all forces were below 0.05 eV Å−1. The 1s, 2s, and 2p electrons were treated in the frozen core approximation.46Several of these global optimization runs were performed for each size, viz. 3 runs each with about 400 candidates for Si14+; 2 runs each with about 600 candidates for Si15+; 2 runs each with about 400 candidates for Si16+; 6 runs each with 1000 to 1700 candidates for Si18+; and 7 runs each with 700 to 1200 candidates for Si19+. While for the smaller sizes (n = 14–16) all runs ended up in the same global minimum structure, the search turned out to be much more challenging for the two larger sizes. In the case of n = 19, only a single run found the presumed global minimum, while five runs indicate the same local minimum, namely isomer 19-B described below, as the best structure. Similarly, the lowest energy structure18 of Si18+, described by Lyon et al., was found by one of the runs only, while the other runs resulted in an energetically higher isomer which has the same geometry as the one proposed by Ho et al.13 to be the global minimum for neutral Si18.
In order to determine the ground state geometry of Al12+, global optimization by simulated annealing coupled to molecular dynamics simulations was performed, followed by optimization with gradient based techniques and characterization of the stationary points by vibrational frequency calculation. Gradients for molecular simulations have been obtained using the Becke exchange functional50 combined with the Perdew correlation functional51 (BP86) or the Lee–Yang–Parr correlation functional50,52 (BLYP) together with the split valence plus polarization (def2-SVP) basis set53 and employing the resolution of identity approximation. This structure search was based on density functional theory as implemented in TURBOMOLE54,55 and started from re-optimized structures that were obtained by removing one atom from the known structure of Al13+.25
Cluster geometry files for all Sin+ and Aln+ clusters considered here, including higher isomers, are given as ESI.†
2.4 Calculation of core-level electron binding energy and infrared spectra.
In order to calculate 2p core-level spectra, all trial structures have been relaxed with GPAW as described above, independent of the specific method that was employed to identify candidates for the global minimum. Spin-polarized density functional theory was used in case of open electronic shells to obtain the relaxed configuration.2p core-electron binding energies for a given cluster were evaluated in a final-state approach as the energy differences between the cationic ground state and the dicationic 2p core-hole excited state in the geometry of the monocation parent.56 The energy differences between ground and core hole excited states are corrected by an empirical shift δ that accounts for our approximations in our definition of the core hole and possible inaccuracies of the functional approximation applied. The empirical shift δ was extracted from a comparison of theoretical and tabulated experimental core-electron binding energies of molecular systems and depends only on the element and excitation edge, δ(Al 2p3/2) = 0.74 ± 0.06 eV and δ(Si 2p) = 0.76 ± 0.06 eV.56 The approach of using the ground-state geometry of the cation also for the core-hole excited state is based on the sudden approximation57–59 and is justified by the much faster time scale of electron motion as compared to nuclear motion. This description of core-level photoionization, where the core-hole is explicitly modeled in the final state, correctly describes the adiabatic photoionization process.58–61 For each atom of the cluster, the final core-hole excited state is approximated as the lowest-energy electronic state of the cluster with an electron removed from the 2p state in the frozen core of this given atom.47,62 In our simplified approximation the 2p core hole is spherically symmetric and carries no spin, resulting only in a single 2p binding energy for each atom in the cluster.
Since our calculations do not consider spin orbit-coupling, the separation into 2p1/2 and 2p3/2 contributions has to be introduced ex post in order to compare the calculated energies to experimental core-level binding energy spectra.56 For this, we have used the experimental 2p spin–orbit splittings of 0.44 eV for aluminum63,64 and 0.6 eV for silicon.65–68 The intensities are modeled according to the statistical weight of 2/3 and 1/3 of j = 3/2 and j = 1/2 core hole states, respectively.
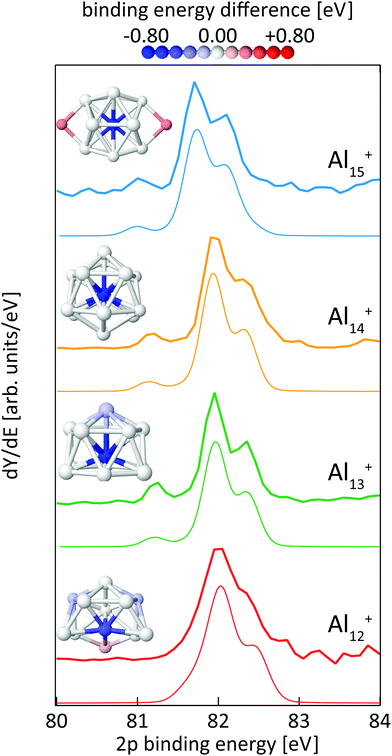
To better illustrate the distribution of 2p binding energies within the cluster, the calculated 2p binding energies were binned with an energy interval of ±0.08 eV and the difference of the local 2p binding energy at a given atom to the most frequent 2p electron binding energy of all atoms in this cluster has been calculated. Using this 2p binding energy difference removes the size-dependent electrostatic charging energy contribution24,39 and allows us to directly compare the binding energy distribution in clusters of the same element but of different size. The binding energy difference of each atomic site is color coded in the cluster geometries shown in Fig. 3 and 8.
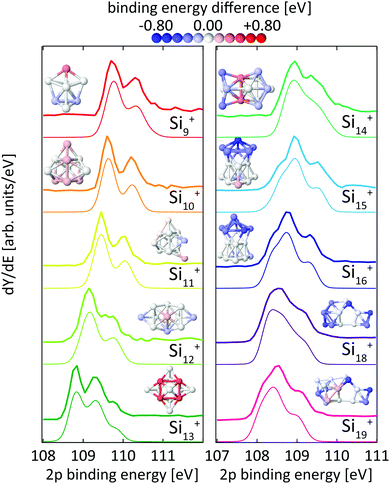 | ||
| Fig. 3 Experimental24 (thick lines) and theoretical (thin lines) 2p binding energy spectra of Sin+ clusters. Theoretical spectra are broadened by Lorentzians of 0.04 eV and Gaussians of 0.36 eV width to account for lifetime broadening and experimental photon energy resolution, respectively. The structures are shown both as ball and stick models and colored by their Si 2p binding energy difference to the most frequent binding energy within each cluster after binning with an energy interval of ±0.08 eV. The color scale for these relative binding energies is given on the top of the figure. | ||
Calculated infrared spectra for comparison with published experimental data18 were obtained by finite difference calculations69 within the framework described above, where the subsequent relaxation has been refined until all forces were below a threshold of 0.01 eV Å−1. The infrared spectra have been broadened by Gaussians of 8 cm−1 width to simulate finite experimental resolution. No scaling of calculated vibrational energies was applied.
3 Results
We will first present the results on silicon clusters as the experimental 2p core-level binding energy spectra of Sin+ have already been reported24 for n = 9–27 and have been discussed in detail for compact structures of n = 9–13, for which proposed ground state geometries13,18,24 were shown to reproduce the experimental 2p binding energy spectra within a simple initial-state approach. The focus therefore will be on larger clusters in the size range of 14 ≤ n ≤ 19 where the structures are predominantly prolate15,28 and where we can contribute with new ground state structures.243.1 Silicon clusters
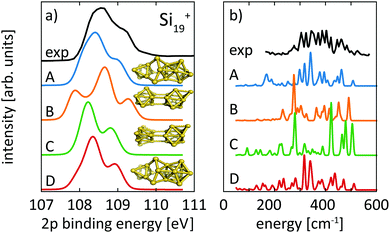
For the size range of n = 9–19, calculated 2p core-level binding energy spectra are compared to the experimental data in Fig. 3. The calculated spectra are all rigidly shifted in energy by −0.3 eV to match the experimental spectra. The predicted absolute energies thus agree well with the experimental values as this difference in energy equals the experimental uncertainty of the photon energy calibration. As can be seen from Fig. 3, the theoretical 2p core-level spectra are in very good agreement with experiment. In particular the spectra of smaller clusters with previously assigned ground state structures,13,18,24 Si9+ to Si14+ match very well, as do the spectra of Si15+ and Si16+ for which new structures are found. In the case of Si15+, the structure proposed here is related to the structure proposed by Lyon et al.18 but does not contain a tetracapped trigonal prism subunit and is thus of lower symmetry, Cs instead of C3v. The agreement is good for Si18+, for which our global minimum search confirms the proposed structure,18 as well as for Si19+ where we propose a global minimum structure that was not reported before.
From our calculations, individual 2p binding energies can be assigned to each constituent atom in the Sin+ clusters. The variations of 2p binding energies within a given cluster are visualized by color coding of the individual atoms in Fig. 3, where the color scale represents the deviation from the most frequent 2p binding energy within each cluster, after binning with an energy interval of ±0.08 eV. This visualization shows that a correlation of 2p binding energy and coordination number is not very pronounced but strongly varies with cluster size. For example, the structures of Si10+ and Si11+ are based on a tetracapped trigonal prism geometry. The 2p binding energies at different sites in Si10+ are identical to within ±0.09 eV. To form Si11+, an extra atom that caps a facet of the original Si10+ is added with 0.2 eV higher relative 2p binding energy. The relative 2p binding energy of the adjacent capping Si atom is slightly reduced by 0.15 eV while the other sites are left unaffected. Contrastingly, in Si13+ the four Si atoms with fivefold coordination have the highest 2p binding energy.24 This correlation can still be discerned in Si14+ with two atoms at the center of the cluster with eightfold coordination having the highest relative 2p binding energy. For Sin+ with n = 15–19 no obvious correlation of coordination and relative 2p binding energy is found and only a slight tendency of sites with similar relative 2p binding energy to be geometrically grouped together can be identified. In general, the 2p binding energy of atoms situated at convex vertices seems to be systematically lower than that of atoms at concave vertices. For Si18+ and Si19+, it can be seen that the 2p binding energy at most of the sites in the midsection of these elongated structures is higher than at sites located at both ends. Note that in the midsection a six-atom motif is discernible, indicated by black lines in the structure of Si18+ in Fig. 6, which is related to the six-atom ‘chair’ in the diamond structure of bulk silicon.70
Core-level shifts have been studied in detail for reconstructed silicon surfaces.58,60,61,66–68,71 While for these reconstructed surfaces, correlations of the 2p electron binding energy with bond lengths or distances to Wannier centers have been proposed,61 we did not observe any significant correlation with simple structural parameters for silicon clusters as is shown in the ESI.† It is interesting to note that 2p core-level shifts of −0.6 eV to +0.5 eV in Sin+ clusters are of the same order of magnitude as those observed on silicon surfaces, which range from −0.5 eV to +0.225 eV for Si(001) and −0.7 eV to +0.53 eV for Si(111).58,60,61,66–68,71 At the same time, the range of coordination numbers, 3–8, and the variation of bond lengths, 2.35–2.60 Å, in the clusters studied here is noticeably larger than in silicon surfaces. A more detailed study of the local electronic structure at each atomic site in Sin+ is beyond the scope of the present study but might explain the seemingly unsystematic variation of 2p binding energies in silicon clusters.
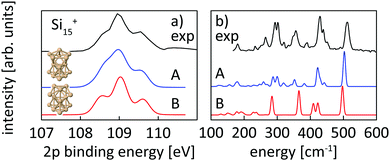 | ||
| Fig. 4 Experimental core level binding energy (a) and infrared spectra taken from Lyon et al.18 (b) of Si15+ in comparison to the calculated spectra of two different isomers, isomer 15-A found in this work and isomer 15-B, proposed as the ground state by Lyon et al. The comparison clearly indicates isomer 15-A as the ground state. | ||
Structural assignment is more difficult for Si16+ because the two lowest energy isomers show very similar core-level and infrared spectra in spite of their different geometric structure. The ground-state structure of Si16+ that is proposed here has not been found in previous calculations reported in the literature,13,18 but shows good agreement in the 2p core level spectrum between calculation and experiment and also the infrared spectra from our simulation and the experiment18 of Lyon et al. match very well, in particular around 500 cm−1, as shown in Fig. 5. This further confirms our structural assignment.
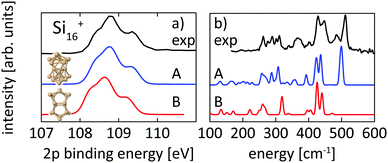 | ||
| Fig. 5 Experimental core level binding energy (a) and infrared spectra18 (b) of Si16+ in comparison to the calculated spectra of two different isomers, 16-A found in this work and 16-B, which we found to be the next higher (+0.20 eV) lying isomer while other isomers proposed in the literature13,18,72 are higher in energy by ≥ +0.39 eV. | ||
For Si18+, Fig. 6 compares calculated 2p core level spectra of the two lowest lying isomers of our global optimization to our experimental data. Isomer 18-A, the lowest energy structure that we found, is identical to the structure proposed by Lyon et al., while isomer 18-B, which is identical to the structure proposed by Ho et al. for neutral Si18, turned out to be 0.1 eV higher in energy. Both, our 2p binding energy spectra and the reported infrared photodissociation18 spectra, show better agreement with experiment for isomer 18-A than for isomer 18-B. This confirms the previous assignment18 and indicates a pronounced change of geometry upon ionization of Si18+.
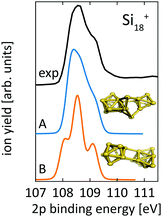 | ||
| Fig. 6 Core level binding energy spectra of two proposed isomers,13,18 18-A and 18-B, of Si18+ in comparison to experimental data confirm the assignment of isomer 18-A as the global minimum. Theoretical spectra are broadened by Lorentzians of 0.04 eV and Gaussians of 0.3 eV width to account for lifetime broadening and experimental photon energy resolution, respectively. | ||
For neutral Si19, Ho et al. found a compact symmetric cage-like structure as the lowest energy isomer in their LDA calculations. In contrast, all our lowest isomers consist of joined subunits of varying symmetry. Calculated spectra for our isomers 19-A, as well as 19-B, 19-C, and 19-D, which are 0.11 eV, 0.14 eV, and 0.17 eV higher in energy than our proposed ground state 19-A, are compared to experimental spectra in Fig. 7. Interestingly, the lowest isomer 19-A is the least symmetric of all structures but fits best the 2p core-level spectrum, while isomers 19-B, 19-C, and 19-D of Si19+ disagree in their calculated 2p core-level spectra with experiment. Isomers 19-A and 19-D are visually remarkably similar and only differ in the capping position of the extra atom on the tricapped trigonal prism. Despite the structural similarity between 19-A and 19-D, the differences in their 2p spectra are significant enough as to exclude isomer 19-D where the one facet of the tricapped trigonal prism is doubly capped. This demonstrates the sensitivity of core-level binding energy spectra for structure determination of clusters. The assignment of the structural ground state, isomer 19-A, is further corroborated by the agreement of our calculated infrared absorption spectrum with the infrared photodissociation spectrum reported by Lyon et al., shown in panel b of Fig. 7.
3.2 Aluminum clusters
Fig. 8 shows the calculated 2p core-level spectra of Aln+ in comparison to the experimental data. The calculated spectra require a shift in energy of only −0.2 eV to match the experimental spectra, which is within the experimental photon energy uncertainty and once again demonstrates the level of accuracy of the theoretical approach56 to predict absolute 2p binding energies.In contrast to silicon clusters with n = 12–15, the 2p core-level binding-energy spectra of Aln+ in the same size range display much less variation. As can be seen in Fig. 8, the spectra for n = 13–15 show a clearly resolved 2p spin–orbit splitting of the main peak. In addition, a well separated line is visible at 0.73–0.84 eV lower average excitation energy, i.e., lower than the main line by a significantly higher energy difference than the value of the aluminum 2p spin–orbit splitting of 0.44 eV. In contrast to spectra for n = 13–15, this pre-peak is less well separated in the 2p binding energy spectrum of Al12+, resulting only in a shoulder in the low energy tail of the 2p3/2 main line. In addition, the line width is broader and the spin–orbit splitting is less well resolved in the main line of Al12+ than for the other aluminum clusters, indicating contributions to the spectrum of several lines that are all within an excitation energy range in the order of the 2p spin–orbit splitting. For all cases shown in Fig. 8, the theoretical and experimental spectra are in very good agreement and all main features, in particular the separation and intensity of the low binding-energy peak for n = 13–15, are well reproduced by the calculations.
For a quantitative comparison to calculated data, experimental core-level binding energy shifts of the low-energy component in the spectra of Aln+ were obtained from energy differences of the fitted Voigt profiles as illustrated in Fig. S4 of the ESI.† Comparison to theoretical values shows that predicted and observed core-level binding energy shifts are in very good agreement, as summarized in Table 2. Fig. S4 of the ESI,† also indicates that the integrated intensity of the low binding energy peak in relation to the main peak for Aln+ roughly matches the expected intensity ratio of 1/(n − 1) for 2p photoemission from a single atom of the n-atom cluster.
| Average 2p core-level shift [eV] | ||
|---|---|---|
| Experiment | Theory | |
| Al12+ | 0.44 ± 0.19 | 0.41 ± 0.11 |
| Al13+ | 0.73 ± 0.10 | 0.75 ± 0.04 |
| Al14+ | 0.84 ± 0.19 | 0.80 ± 0.03 |
| Al15+ | 0.73 ± 0.15 | 0.77 ± 0.11 |
The color-coded view of Aln+ clusters in Fig. 8 visualizes the strong anticorrelation of the 2p binding energy with the coordination number, where highly coordinated atoms have low 2p binding energies and lower coordination leads to higher binding energy. In particular, this color code visualization shows that the weak line at low 2p binding energy can indeed be assigned to the central atom of Aln+, n = 13–15, whereas the intense main peak is composed of the binding energy contributions of the atoms in the first shell around the central atom. In agreement with the experimental data, this colour coding reveals that also Al12+ contains one atom with significantly lower 2p binding energy although this contribution to the spectrum could not be fully resolved but only leads to a shoulder which is at 0.44 ± 0.19 eV lower binding energy than the main peak, i.e., lower in energy by a difference of the same order of magnitude as the 2p spin–orbit splitting. This is because isomer 12-A of Al12+ does not contain a true central atom or a closed first shell, but still one particular atom with higher coordination number. As shown in Fig. 8, isomer 12-A of Al12+ can be derived from Al13+ when one atom is removed from the six-membered ring at the base of Al13+. As a consequence, this now five-membered ring opens up and, for Al12+, exposes the atom marked in blue that would correspond to the central atom in Al13+.
For the size-range investigated here, static dipole polarizabilites of aluminum clusters are lower than predicted by the jellium model.73,74 This would agree with our findings of significantly reduced 2p core hole screening for the atoms in the outer shell, which leads to higher core-electron binding energies as shown in Fig. 8. Very recently, the existence of a pre-peak in the X-ray photoelectron spectrum of Al13− synthesized in solution was proposed but could not be resolved experimentally.75 This pre-peak as well as its origin is clearly evidenced by the data presented here.
In line with the reasoning above, the two atoms in the second shell of Al15+ show the highest 2p electron binding energies in this cluster. Apparently, a 2p core hole cannot be screened nearly as efficiently in these low-coordinated sites as it can be in the highly-coordinated central atom, leading to a blue-shift in the calculated binding energy of 0.37 eV that again cannot be resolved in the spectrum because of the low relative intensity, of 1/7 of the main line, as well as because the separation from the other components of the main line is less than the 2p spin–orbit splitting.
While our results confirm the reported structures25 of Aln+, n = 13–15, by Aguado and López, the structure of Al12+ was not known before to the best of our knowledge, but a similar structure has been reported76 for neutral Al12. The comparison between experimental and theoretical 2p binding energy spectra of the two lowest energy isomers found for Al12+ is shown in Fig. 9. Isomer 12-B is 146 meV higher in energy than isomer 12-A. The good match of the experimental and theoretical 2p binding energy spectra gives confidence that we have indeed found the structural ground state of Al12+. The similarity of the geometric structure of neutral and cationic Al12 also indicates that only little rearrangement takes place upon ionization of aluminum clusters, in contrast to silicon clusters. This might be related to the compact, close-packed structures that are present in aluminum clusters as a result of non-directional bonding in aluminum in contrast to directional bonding in silicon. Notably, the surface core-level shift of −0.73 to −0.84 eV relative to the central atom in Aln+ (n = 13–15) is about one order of magnitude larger but of opposite sign than the experimental surface core-level shift of 96 ± 5 meV for Al(100), and the even smaller surface core-level shift of only ≤27 meV for Al(111).77,78 Similarly small surface core-level shifts of Al(111) and Al(100) are found by theoretical calculations within the Z + 1 approximation79 or a final state approximation78 as well as within our theoretical description, as illustrated in the ESI.†
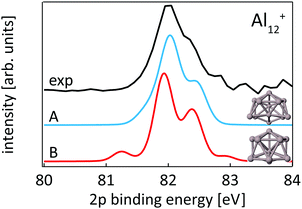 | ||
| Fig. 9 Core level binding energy spectra of two isomers 12-A and 12-B of Al12+ in comparison to experimental data confirm the assignment of isomer 12-A as the global minimum. | ||
It can furthermore be seen from Fig. 8 that the positive electrostatic charging-energy contribution to the 2p electron binding energy24,39 is very similar, within 0.05 eV, for n = 12–14 but decreases significantly, by 0.21 eV, when going from n = 14 to n = 15, resulting in a general shift of 2p electrons to lower binding energy that is typically attributed to changes in the radius of curvature in the spherical metallic particle model.40,41 In agreement with this macroscopic model, the additional atom in Al15+ in comparison to Al14+ leads to a rather prolate structure of larger volume, with, on average, longer bond lengths between central atom and the surrounding atoms (2.89 ± 0.44 Å and 2.77 ± 0.19 Å in Al15+ and Al14+, respectively) and thus a larger average radius of curvature than Al14+ with its rather compact, spherical shape.
4 Conclusions
In conclusion, the analysis of core-level spectra of size-selected clusters is a sensitive tool for the exploration of structural motifs that are tightly interlinked with electronic properties. We have shown that the final state description in combination with the empirical fitting of the element and state dependent energy scale is able to predict core-level spectra in very good quantitative agreement with experiment. Using this approach in combination with global optimization, we have found new ground state structures for Al12+, Si15+, Si16+, and Si19+ for which calculated 2p binding energies are in good quantitative agreement with 2p core electron spectra and, in the case of silicon, also previously reported infrared spectra can be well reproduced. In all cases the comparison of simulated and experimental spectra confirm the lowest lying isomer as the ground state. In general, aluminum clusters prefer compact structures and thus high average coordination numbers while silicon clusters prefer more extended geometries and thus lower average coordination numbers. This is reflected by the dependency of the 2p binding energy on the atomic site. In aluminum clusters the variation of 2p binding energies reflects the clear distinction of atomic sites into shell and central ones. Contrastingly, in silicon clusters the 2p binding energy cannot be classified in a simple geometrical scheme. These observations indicate that already at these smallest cluster sizes, the electronic configuration with one additional 3p electron per silicon atom, which results in the strong energetic favoring of sp3 hybridization and directional bonding in bulk silicon, plays a crucial role for the electronic and geometric structure. Core-level binding energy spectra from photoionization efficiency curves of size-selected clusters should also be a powerful tool to investigate the changes in electronic structure that occur between exohedral and endohedral doped silicon clusters.80 It might be particular useful to elucidate the degree of valence electron delocalization, which should have a pronounced effect on electron binding energies and core-level excitation energies via charge screening,43,81 but also on the quenching of local magnetic moments.80,82–85Conflicts of interest
There are no conflicts to declare.Acknowledgements
This work was supported by DFG grant LA 2398/5 within FOR 1282. Beam time for this project was granted at BESSY II beamline U125/2-SGM, operated by Helmholtz-Zentrum Berlin. The authors thank A. Aguado, J. T. Lyon, and A. Fielicke for kindly sharing their cluster geometry files; and A. Fielicke for kindly providing experimental infrared spectra. TR and MW thank FZ Jülich (projects HFR04 and HFR08) and the bwHPC-C5 project (clusters Justus/Ulm and Nemo/Freiburg) for providing computational resources. BvI thanks HZB for travel support. Calculations for aluminum clusters were carried out on the FOR 1282 computer cluster, funded by DFG. RL acknowledges the Swedish Research Council (grant no. 637-2014-6929) for financial support.References
- W. A. de Heer, Rev. Mod. Phys., 1993, 65, 611–676 CrossRef CAS
.
- J. Akola, M. Manninen, H. Häkkinen, U. Landman, X. Li and L.-S. Wang, Phys. Rev. B: Condens. Matter Mater. Phys., 1999, 60, R11297–R11300 CrossRef CAS
.
- P. Ferrari, E. Janssens, P. Lievens and K. Hansen, J. Chem. Phys., 2015, 143, 224313 CrossRef PubMed
.
- M. F. Jarrold, U. Ray and Y. Ijiri, Z. Phys. D: At., Mol. Clusters, 1991, 19, 337–342 CrossRef CAS
.
- T. Lange and T. P. Martin, Angew. Chem., Int. Ed. Engl., 1992, 31, 172–173 CrossRef
.
- B. D. Leskiw, A. W. Castleman Jr, C. Ashman and S. N. Khanna, J. Chem. Phys., 2001, 114, 1165–1169 CrossRef CAS
.
- M. Walter and H. Häkkinen, Phys. Chem. Chem. Phys., 2006, 8, 5407–5411 RSC
.
- J. E. Bower and M. F. Jarrold, J. Chem. Phys., 1992, 97, 8312–8321 CrossRef CAS
.
- M. Grass, D. Fischer, M. Mathes, G. Ganteför and P. Nielaba, Appl. Phys. Lett., 2002, 81, 3810–3812 CrossRef CAS
.
- Z. W. Wang, O. Toikkanen, B. M. Quinn and R. E. Palmer, Small, 2011, 7, 1542–1545 CrossRef CAS PubMed
.
- J. Lee, W. Zhou, S. J. Pennycook, J.-C. Idrobo and S. T. Pantelides, Nat. Commun., 2013, 4, 1650 CrossRef PubMed
.
- T. Rapps, R. Ahlrichs, E. Waldt, M. M. Kappes and D. Schooss, Angew. Chem., Int. Ed., 2013, 52, 6102–6105 CrossRef CAS PubMed
.
- K.-M. Ho, A. A. Shvartsburg, B. Pan, Z.-Y. Lu, C.-Z. Wang, J. G. Wacker, J. L. Fye and M. F. Jarrold, Nature, 1998, 392, 582–585 CrossRef CAS
.
- R. R. Hudgins, M. Imai, M. F. Jarrold and P. Dugourd, J. Chem. Phys., 1999, 111, 7865–7870 CrossRef CAS
.
- K. A. Jackson, M. Horoi, I. Chaudhuri, T. Frauenheim and A. A. Shvartsburg, Phys. Rev. Lett., 2004, 93, 013401 CrossRef
.
- S. Li, R. J. Van Zee, W. Weltner and K. Raghavachari, Chem. Phys. Lett., 1995, 243, 275–280 CrossRef CAS
.
- J. M. Antonietti, F. Conus, A. Châtelain and S. Fedrigo, Phys. Rev. B: Condens. Matter Mater. Phys., 2003, 68, 035420 CrossRef
.
- J. T. Lyon, P. Gruene, A. Fielicke, G. Meijer, E. Janssens, P. Claes and P. Lievens, J. Am. Chem. Soc., 2009, 131, 1115–1121 CrossRef CAS PubMed
.
- N. Binggeli and J. R. Chelikowsky, Phys. Rev. Lett., 1995, 75, 493–496 CrossRef CAS PubMed
.
- J. Müller, B. Liu, A. A. Shvartsburg, S. Ogut, J. R. Chelikowsky, K. W. M. Siu, K.-M. Ho and G. Ganteför, Phys. Rev. Lett., 2000, 85, 1666–1669 CrossRef PubMed
.
- L. Ma, B. von Issendorff and A. Aguado, J. Chem. Phys., 2010, 132, 104303 CrossRef PubMed
.
- X. Wu, X. Liang, Q. Du, J. Zhao, M. Chen, M. Lin, J. Wang, G. Yin, L. Ma, R. B. King and B. von Issendorff, J. Phys.: Condens. Matter, 2018, 30, 354002 CrossRef PubMed
.
-
K. Siegbahn, C. Nording, J. Hedman, P. F. Heden, K. Hamrin, U. Gelius, T. Bergmark, L. Werme, R. Manne and Y. Baer, ESCA Applied to Free Molecules, North-Holland, Amsterdam, 1969, p. 208 Search PubMed
.
- M. Vogel, C. Kasigkeit, K. Hirsch, A. Langenberg, J. Rittmann, V. Zamudio-Bayer, A. Kulesza, R. Mitrić, T. Möller, B. v. Issendorff and J. T. Lau, Phys. Rev. B: Condens. Matter Mater. Phys., 2012, 85, 195454 CrossRef
.
- A. Aguado and J. M. López, J. Chem. Phys., 2009, 130, 064704 CrossRef PubMed
.
- A. A. Shvartsburg, M. F. Jarrold, B. Liu, Z.-Y. Lu, C.-Z. Wang and K.-M. Ho, Phys. Rev. Lett., 1998, 81, 4616–4619 CrossRef CAS
.
- K. A. Gingerich, Q. Ran and R. W. Schmude Jr., Chem. Phys. Lett., 1996, 256, 274–278 CrossRef CAS
.
- M. F. Jarrold and V. A. Constant, Phys. Rev. Lett., 1991, 67, 2994–2997 CrossRef CAS PubMed
.
- L. P. Ding, F. H. Zhang, Y. S. Zhu, C. Lu, X. Y. Kuang, J. Lv and P. Shao, Sci. Rep., 2015, 5, 15951 CrossRef CAS PubMed
.
- O. Björneholm, F. Federmann, F. Fössing and T. Möller, Phys. Rev. Lett., 1995, 74, 3017–3020 CrossRef PubMed
.
- O. Björneholm, G. Öhrwall and M. Tchaplyguine, Nucl. Instrum. Methods Phys. Res., Sect. A, 2009, 601, 161–181 CrossRef
.
- T. Andersson, C. Zhang, M. Tchaplyguine, S. Svensson, N. Mårtensson and O. Björneholm, J. Phys. Chem., 2012, 136, 204504 CrossRef PubMed
.
- J. Meinen, S. Khasminskaya, M. Eritt, T. Leisner, E. Antonsson, B. Langer and E. Rühl, Rev. Sci. Instrum., 2010, 81, 085107 CrossRef PubMed
.
- V. Senz, T. Fischer, P. Oelssner, J. Tiggesbäumker, J. Stanzel, C. Bostedt, H. Thomas, M. Schöffler, L. Foucar, M. Martins, J. Neville, M. Neeb, T. Möller, W. Wurth, E. Rühl, R. Dörner, H. Schmidt-Böcking, W. Eberhardt, G. Ganteför, R. Treusch, P. Radcliffe and K.-H. Meiwes-Broer, Phys. Rev. Lett., 2009, 102, 138303 CrossRef CAS PubMed
.
- J. Bahn, P. Oelßner, M. Köther, C. Braun, V. Senz, S. Palutke, M. Martins, E. Rühl, G. Ganteför, T. Möller, B. von Issendorff, D. Bauer, J. Tiggesbäumker and K.-H. Meiwes-Broer, New J. Phys., 2012, 14, 075008 CrossRef
.
- T. Schramm, G. Ganteför, A. Bodi, P. Hemberger, T. Gerber and B. von Issendorff, Appl. Phys. A: Mater. Sci. Process., 2014, 115, 771–779 CrossRef CAS
.
- O. Kostko, S. R. Leone, M. A. Duncan and M. Ahmed, J. Phys. Chem. A, 2010, 114, 3176–3181 CrossRef CAS PubMed
.
- J. T. Lau, M. Vogel, A. Langenberg, K. Hirsch, J. Rittmann, V. Zamudio-Bayer, T. Möller and B. von Issendorff, J. Chem. Phys., 2011, 134, 041102 CrossRef CAS PubMed
.
- C. Kasigkeit, K. Hirsch, A. Langenberg, T. Möller, J. Probst, J. Rittmann, M. Vogel, J. Wittich, V. Zamudio-Bayer, B. von Issendorff and J. T. Lau, J. Phys. Chem. C, 2015, 119, 11148–11152 CrossRef CAS
.
- J. P. Perdew, Phys. Rev. B: Condens. Matter Mater. Phys., 1988, 37, 6175–6180 CrossRef
.
- J. Jortner, Z. Phys. D: At., Mol. Clusters, 1992, 24, 247–275 CrossRef CAS
.
- K. Hirsch, J. T. Lau, P. Klar, A. Langenberg, J. Probst, J. Rittmann, M. Vogel, V. Zamudio-Bayer, T. Möller and B. von Issendorff, J. Phys. B: At., Mol. Opt. Phys., 2009, 42, 154029 CrossRef
.
- J. T. Lau, J. Rittmann, V. Zamudio-Bayer, M. Vogel, K. Hirsch, P. Klar, F. Lofink, T. Möller and B. v. Issendorff, Phys. Rev. Lett., 2008, 101, 153401 CrossRef CAS PubMed
.
- M. Domke, K. Schulz, G. Remmers, G. Kaindl and D. Wintgen, Phys. Rev. A: At., Mol., Opt. Phys., 1996, 53, 1424–1438 CrossRef CAS
.
- L. B. Vilhelmsen and B. Hammer, J. Chem. Phys., 2014, 141, 044711 CrossRef PubMed
.
- J. J. Mortensen, L. B. Hansen and K. W. Jacobsen, Phys. Rev. B: Condens. Matter Mater. Phys., 2005, 71, 035109 CrossRef
.
- J. Enkovaara, C. Rostgaard, J. J. Mortensen, J. Chen, M. Dułak, L. Ferrighi, J. Gavnholt, C. Glinsvad, V. Haikola, H. A. Hansen, H. H. Kristoffersen, M. Kuisma, A. H. Larsen, L. Lehtovaara, M. Ljungberg, O. Lopez-Acevedo, P. G. Moses, J. Ojanen, T. Olsen, V. Petzold, N. A. Romero, J. Stausholm-Møller, M. Strange, G. A. Tritsaris, M. Vanin, M. Walter, B. Hammer, H. Häkkinen, G. K. H. Madsen, R. M. Nieminen, J. K. Nørskov, M. Puska, T. T. Rantala, J. Schiøtz, K. S. Thygesen and K. W. Jacobsen, J. Phys.: Condens. Matter, 2010, 22, 253202 CrossRef CAS PubMed
.
- P. E. Blöchl, Phys. Rev. B: Condens. Matter Mater. Phys., 1994, 50, 17953–17979 CrossRef
.
- J. P. Perdew, K. Burke and M. Ernzerhof, Phys. Rev. Lett., 1996, 77, 3865–3868 CrossRef CAS PubMed
.
- A. D. Becke, Phys. Rev. A: At., Mol., Opt. Phys., 1988, 38, 3098–3100 CrossRef CAS
.
- J. P. Perdew, Phys. Rev. B: Condens. Matter Mater. Phys., 1986, 33, 8822–8824 CrossRef
.
- C. Lee, W. Yang and R. G. Parr, Phys. Rev. B: Condens. Matter Mater. Phys., 1988, 37, 785–789 CrossRef
.
- F. Weigend and R. Ahlrichs, Phys. Chem. Chem. Phys., 2005, 7, 3297–3305 RSC
.
- R. Ahlrichs, M. Bär, M. Häser, H. Horn and C. Kölmel, Chem. Phys. Lett., 1989, 162, 165–169 CrossRef CAS
.
- P. Deglmann, K. May, F. Furche and R. Ahlrichs, Chem. Phys. Lett., 2004, 384, 103–107 CrossRef CAS
.
- M. Walter, M. Moseler and L. Pastewka, Phys. Rev. B, 2016, 94, 041112 CrossRef
.
- T. Åberg, Ann. Acad. Sci. Fenn., Ser. A6, 1969, 308, 1 Search PubMed
.
- E. Pehlke and M. Scheffler, Phys. Rev. Lett., 1993, 71, 2338–2341 CrossRef CAS PubMed
.
- M. Walter and H. Häkkinen, New J. Phys., 2008, 10, 043018 CrossRef
.
- P. E. J. Eriksson and R. I. G. Uhrberg, Phys. Rev. B: Condens. Matter Mater. Phys., 2010, 81, 125443 CrossRef
.
- O. V. Yazyev and A. Pasquarello, Phys. Rev. Lett., 2006, 96, 157601 CrossRef PubMed
.
- M. P. Ljungberg, J. J. Mortensen and L. G. M. Pettersson, J. Electron Spectrosc. Relat. Phenom., 2011, 184, 427–439 CrossRef CAS
.
- P. H. Citrin, G. K. Wertheim and Y. Baer, Phys. Rev. B: Solid State, 1977, 16, 4256–4282 CrossRef CAS
.
- A. Agui, S. Shin, C. Wu, K. Shiba and K. Inoue, Phys. Rev. B: Condens. Matter Mater. Phys., 1999, 59, 10792–10795 CrossRef CAS
.
- T. Takagaki, Y. Igari, T. Takaoka and I. Kusunoki, Appl. Surf. Sci., 1996, 92, 287–290 CrossRef CAS
.
- R. I. G. Uhrberg, T. Kaurila and Y.-C. Chao, Phys. Rev. B: Condens. Matter Mater. Phys., 1998, 58, R1730–R1733 CrossRef CAS
.
- E. Landemark, C. J. Karlsson, Y.-C. Chao and R. I. G. Uhrberg, Phys. Rev. Lett., 1992, 69, 1588 CrossRef CAS PubMed
.
- C. J. Karlsson, E. Landemark, Y.-C. Chao and R. I. G. Uhrberg, Phys. Rev. B: Condens. Matter Mater. Phys., 1994, 50, 5767–5770 CrossRef CAS
.
- D. Porezag and M. R. Pederson, Phys. Rev. B: Condens. Matter Mater. Phys., 1996, 54, 7830–7836 CrossRef CAS
.
- I. Rata, A. A. Shvartsburg, M. Horoi, T. Frauenheim, K. W. M. Siu and K. A. Jackson, Phys. Rev. Lett., 2000, 85, 546–549 CrossRef CAS PubMed
.
- J. J. Paggel, W. Theis, K. Horn, C. Jung, C. Hellwig and H. Petersen, Phys. Rev. B: Condens. Matter Mater. Phys., 1994, 50, 18686–18689 CrossRef CAS
.
- S. Yoo and X. C. Zeng, Angew. Chem., Int. Ed., 2005, 44, 1491 CrossRef CAS PubMed
.
- W. de Heer, P. Milani and A. Châtelain, Phys. Rev. Lett., 1989, 63, 2834 CrossRef CAS PubMed
.
- P. Milani, W. de Heer and A. Châtelain, Z. Phys. D: At., Mol. Clusters, 1991, 19, 133–135 CrossRef CAS
.
- T. Kambe, N. Haruta, T. Imaoka and K. Yamamoto, Nat. Commun., 2017, 8, 2046 CrossRef PubMed
.
- F.-C. Chuang, C. Z. Wang and K.-M. Ho, Phys. Rev. B: Condens. Matter Mater. Phys., 2006, 73, 125431 CrossRef
.
- R. Nyholm, J. N. Andersen, J. F. van Acker and M. Qvarford, Phys. Rev. B: Condens. Matter Mater. Phys., 1991, 44, 10987–10990 CrossRef CAS
.
- M. Borg, M. Birgersson, M. Smedh, A. Mikkelsen, D. L. Adams, R. Nyholm, C.-O. Almbladh and J. N. Andersen, Phys. Rev. B: Condens. Matter Mater. Phys., 2004, 69, 235418 CrossRef
.
- P. J. Feibelman, Phys. Rev. B: Condens. Matter Mater. Phys., 1989, 39, 4866–4872 CrossRef
.
- V. Zamudio-Bayer, L. Leppert, K. Hirsch, A. Langenberg, J. Rittmann, M. Kossick, M. Vogel, R. Richter, A. Terasaki, T. Möller, B. v. Issendorff, S. Kümmel and J. T. Lau, Phys. Rev. B: Condens. Matter Mater. Phys., 2013, 88, 115425 CrossRef
.
- K. Hirsch, V. Zamudio-Bayer, J. Rittmann, A. Langenberg, M. Vogel, T. Möller, B. v. Issendorff and J. T. Lau, Phys. Rev. B: Condens. Matter Mater. Phys., 2012, 86, 165402 CrossRef
.
- J. T. Lau, K. Hirsch, P. Klar, A. Langenberg, F. Lofink, R. Richter, J. Rittmann, M. Vogel, V. Zamudio-Bayer, T. Möller and B. v. Issendorff, Phys. Rev. A: At., Mol., Opt. Phys., 2009, 79, 053201 CrossRef
.
- V. T. Ngan, E. Janssens, P. Claes, J. T. Lyon, A. Fielicke, M. T. Nguyen and P. Lievens, Chem. – Eur. J., 2012, 18, 15788–15793 CrossRef CAS PubMed
.
- V. Arcisauskaite, D. Fijan, M. Spivak, C. de Graaf and J. E. McGrady, Phys. Chem. Chem. Phys., 2016, 18, 24006–24014 RSC
.
- S. T. Akin, V. Zamudio-Bayer, K. Duanmu, G. Leistner, K. Hirsch, C. Bülow, A. Ławicki, A. Terasaki, B. von Issendorff, D. G. Truhlar, J. T. Lau and M. A. Duncan, J. Phys. Chem. Lett., 2016, 7, 4568–4575 CrossRef CAS PubMed
.
Footnote |
| † Electronic supplementary information (ESI) available: Computational details, xyz coordinates of cluster structures, relative energies, further analysis of core-level shifts. See DOI: 10.1039/c8cp07169a |
| This journal is © the Owner Societies 2019 |

