 Open Access Article
Creative Commons Attribution 3.0 Unported Licence
Fluorescence correlation spectroscopy for multiple-site equilibrium binding: a case of doxorubicin–DNA interaction†
Xuzhu
Zhang
ab,
Andrzej
Poniewierski
a,
Krzysztof
Sozański
a,
Ying
Zhou
a,
Anna
Brzozowska-Elliott
 a and
Robert
Holyst
 *a
*a
aDepartment of Soft Condensed Matter, Institute of Physical Chemistry, Polish Academy of Sciences, Warsaw, Poland. E-mail: rholyst@ichf.edu.pl
bDepartment of Biochemistry and Molecular Pharmacology, New York University School of Medicine, New York, NY, USA
First published on 8th January 2019
Abstract
Quantitative description of the interaction between doxorubicin (DOX), a broadly used anticancer drug, and DNA is the key to understand the action mechanism and side effects of its clinical use. However, the reported equilibrium constants of DOX–DNA interaction obtained using a range of different analytical methods vary even by several orders of magnitude. Herein, we propose a novel application of a single-molecule technique – fluorescence correlation spectroscopy (FCS) – to probe the interaction between DOX and two types of DNA (pUC19 and calf thymus DNA), taking advantage of intrinsic self-fluorescence of DOX. We provide an analytical formula for autocorrelation analysis to determine the equilibrium constant of DOX–DNA complex-formation, where binding of multiple DOX molecules to a DNA chain is included in the reaction–diffusion model. Our FCS-based method not only quantitatively revealed the values of equilibrium constant, but also implied that the stability of DOX–DNA complex is related to the types of base pair rather than the length or structure of the DNA. This work opens a promising pathway toward quantitative determination of molecular interactions in complex systems such as living cells or organisms at single-molecule level.
1 Introduction
Doxorubicin (DOX), an important member of the anthracycline antibiotics family, is one of the most effective anticancer drugs ever developed in the chemotherapeutic treatment of various tumors such as hematological malignancies, carcinoma, soft tissue sarcomas, etc.1–3 Numerous studies have been performed to reveal its anticancer mechanism, including i.e. DOX–DNA adduct formation, topoisomerase II poisoning.3–5 Clearly, formation of DOX–DNA adduct is the key step, where the planar DOX molecule intercalates between the base pairs (BP) of double-stranded DNA (dsDNA) and anchors its sugar moieties in the DNA minor groove. This inhibits the replication and transcription processes of DNA, eventually leading to cell apoptosis.4,6 Considerable effort has been put into quantitative studies the DOX–DNA interaction using a variety of methods in recent decades,7 such as fluorescence spectroscopy,8–11 circular dichroism,8–10 UV-visible spectrometry,8,11 isothermal titration calorimetry,8,9 X-ray crystallography,12,13 and computer simulations.8,14,15 However, the reported values of equilibrium constants for this interaction, ranging from 104 to 108 M−1, are highly inconsistent. The challenge is largely related to the fact that multiple DOX molecules bind to a single DNA chain, so that a series of consecutive reactions and a multitude of interconnected equilibria need to be considered. Therefore, an accurate, well-controlled experimental approach with an appropriate theoretical apparatus for data analysis is necessary to obtain reliable results.Fluorescence correlation spectroscopy (FCS), first introduced by Magde et al. in the early 1970s,16–18 is an ideal experiment tool that can be used for investigations of molecular interactions with single molecule sensitivity.19–21 FCS provides more precise values in the determination of molecular interactions in comparison with classical methods, since bigger errors may be introduced to the system in the latter case where much larger amount (several orders of magnitude) of reactants are required. In principle, FCS records the fluctuations in the fluorescence intensity of probes diffusing within a femtoliter focal volume (0.2 fL, FV) created by the excitation laser beam. Autocorrelation of such signal reveals the characteristic time-scales of fluorescence fluctuations, which correspond to the time of residence of probes inside the focal volume. Application of an appropriate theoretical model to the resulting autocorrelation curve allows to retrieve a variety of physicochemical information on the system of interest, such as diffusion coefficients, conformational changes, singlet–triplet dynamics, reaction rate and equilibrium constants.22–28 Due to the lack of suitable models for data analysis, however, application of FCS to the kinetic studies of biochemical reactions has not been widely reported since the idea was initially conceived by Manfred Eigen and Rudolf Rigler in 1993.29
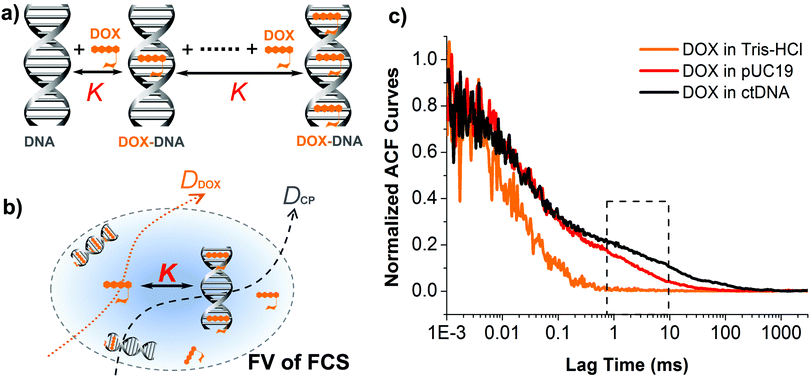
In this work, we demonstrate an application of label-free FCS method to quantification of DOX–DNA interaction in a reaction–diffusion model, taking advantage of the intrinsic fluorescence of DOX.30 We derive a new formula for the autocorrelation function of FCS, allowing to determine the equilibrium constant of typical complex formation in a variety of biochemical reactions where multiple binding of ligands (e.g., DOX) to macromolecules (e.g., DNA) is involved (Fig. 1a and b). The formula is validated by our experimental study of interaction between DOX and two types of dsDNA, namely, plasmid DNA (pUC19) and calf thymus DNA (ctDNA).
2 Experiments and theory
Materials
Doxorubincin hydrochloride (DOX·HCl, ≥99%) was purschased from Santa Cruz Biotechnology Inc, USA. Dye rhodamine 110 chloride (Rh110, ≥99%) was purcahsed from Sigma-Aldrich Inc. Plasmid DNA pUC19 and calf thymus DNA (ctDNA) were bought from Thermo Fisher Scientific and Merck Inc, respectively. All DNA samples were diluted in Tris–HCl solutions (pH 7.4, I = 10 mM) for each experimental use; samples were freshly prepared prior to every experiment. All chemicals were used without further purification if not specified otherwise.FCS setup
The fluorescence correlation spectroscopy (FCS) experiments were performed on a Nikon EZ-C1 inverted confocal microscope with a 60×/1.2 water immersion objective (Nikon Plan Apo). The system was equipped with PicoQuant upgrade kit consisting of Micro Photon Devices (Milan, Italy) SPAD detectors and PicoHarp 300 TCSPC module. Lab-Tek 8-well chambers were used as sample containers. All experiments were conducted at 25 °C using a 488 nm argon-ion laser (PicoQuant GmbH, Germany) for illumination. The focal volume (FV) of FCS was calibrated by the standard dye Rh110 at the every beginning of each measurement. During all measurements the laser power were set at a constant value of 100 μW using a laser power meter (PM100, Thorlabs) and the FV was at a constant distance of 10 μm from the edge of the chamber. All DNA solutions were prepared with a fixed DOX concentration of 50 nM and each measurement (duration 200 s) was repeated at least five times. The generated autocorrelation function (ACF) curves were analysed using SymPhoTime 64 software and gnuplot (version 4.5).Formation of DOX–DNA complexes
Considering that the sizes of DNA molecule we used are much larger (about two orders of magnitude) than the DOX, we describe the formation of DOX–DNA complexes using the ligands–macromolecule interaction model:31 consecutive binding of DOX ligands to the multiple active site in a dsDNA chain until saturation of the chain achieves. And because all the binding sites in the dsDNA chain are uniformly composed of GC and/or AT BPs, we assume that they are identical to DOX so that every binding step occurs independently and has the same value of equilibrium constant K (see Fig. 1a). In analogy to reversible chemical reactions, the binding process of subsequent DOX molecules to every individual sites in a dsDNA chain to form a DOX–DNA complex (CP) can be expressed as:where n is the total number of binding sites available for DOX in the single dsDNA chain. It is calculated as the quotient from the length of dsDNA chain (i.e., BP number, equal to 2686 for pUC19 and 13
![[thin space (1/6-em)]](https://www.rsc.org/images/entities/char_2009.gif) 200 on average for ctDNA32) to the size of binding site for single DOX molecule to occupy in the chain (i.e., exclusion parameter, equal to 3.1 BPs per site33,34). Then we obtain n equal to 866.5 for pUC19 and 4258 for ctDNA, in respective.
200 on average for ctDNA32) to the size of binding site for single DOX molecule to occupy in the chain (i.e., exclusion parameter, equal to 3.1 BPs per site33,34). Then we obtain n equal to 866.5 for pUC19 and 4258 for ctDNA, in respective.
3 Results and discussion
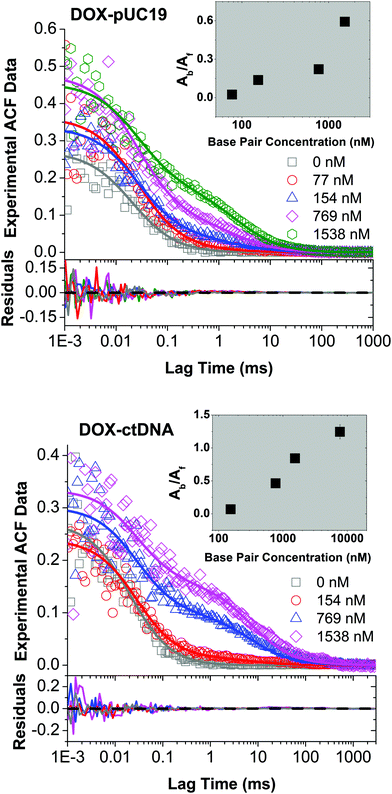
To study the formation of DOX–DNA complexes, we performed FCS measurements of DOX (50 nM) diffusing in Tris–HCl (pH 7.4, I = 10 mM), as well as Tris–HCl solutions of pUC19 and ctDNA. Diffusion of DOX in the buffer exhibited a typical single-component profile according to the recorded autocorrelation function (ACF) (see Fig. 1c). In contrast, we observed a second, slow components emerging at the long lag time region of experimental ACFs in the case of DOX diffusing in the solutions of pUC19 and ctDNA. Since the diffusion coefficient of DOX in the buffer (DDOX = 4.2 × 10⁻¹⁰ m2 s−1) was much higher than the characteristic values for DNA chains (0.06 × 10⁻¹⁰ m2 s−1 for pUC1935 and 0.02 × 10⁻¹⁰ m2 s−1 for ctDNA;36 see Sections S1 and S2 in ESI† for details), the two contributions could be clearly discriminated, demonstrating the formation of DOX–DNA complexes in a reaction–diffusion model. Moreover, the slow component in the ACF of ctDNA shifted to even longer lag time region than that of pUC19, reflecting the lower diffusion coefficient of ctDNA in comparison with pUC19.To determine the value of K, we recorded the diffusion of DOX in the two DNA solutions of various concentrations. To account for the fact that each only BP is considered in the reaction rather than full DNA chains, DNA concentrations are given in terms of BP concentrations (calculated as a product of DNA molar concentration and number of base pairs in the chains). As expected, we observed a gradually increase of the amplitudes of slow component as the BP concentration from the experimental ACFs (Fig. 2). Accordingly we fitted the curves with the standard two-component, 3D diffusion model:21,37
 | (1) |
 | ||
| Fig. 2 Experimental FCS data (open symbols) for DOX diffusing in the solutions of pUC19 (upper panel) and ctDNA (lower panel) of various concentrations, as well as the fits (solid lines) using eqn (1). DNA concentrations are reported in terms of base pairs (BP) rather than DNA chains to account for the fact that the number of binding sites for DOX depends on the BP number. DOX features very short triplet lifetime compared to its diffusion time through the FV (for data see Section S1 in ESI†), so the triplet contribution did not interfere with the autocorrelation fitting. Inset: Determined ratios of fluorescence contributions from bound DOX to free DOX, Ab/Af, as a function of BP concentration using eqn (1). | ||
DOX fluorescence is partially quenched after binding to DNA probably due to the alternative, non-radiative relaxation of the excited DOX molecule when it intercalates between the BPs of a dsDNA chain8–10,13 (for fluorescence specta see Section S3 of ESI†), while apparent total brightness of a DOX–DNA complex is proportional to the number of DOX molecules bound to the DNA chain. Also, contribution of a given population of fluorescent probes to the ACF depends quadratically on their brightness. Taking these factors into account, we derived a formula relating the equilibrium constant K to the Ab/Af ratio obtained from FCS (derivation details available in Section S4 of ESI†):
 | (2) |
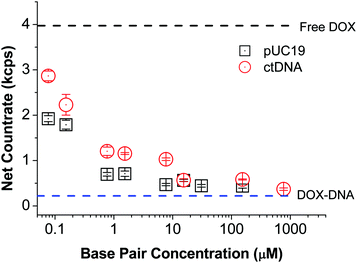
Although the equilibrium constant only depends on the temperature of system, the brightness ratios of free DOX to DNA-bound DOX (Bf/Bb) is a crucial parameter for quantitative determination of K value using FCS according to eqn (2). To establish it, we recorded the countrates (i.e. number of detected photons per time unit) of free DOX in Tris–HCl (CRf) and DNA solutions of various concentrations (CRb). As expected, the detected net countrate (with background noise deducted) dropped from ∼4 kcps (thousands of counts per second) to ∼0.4 kcps with increasing DNA concentration, indicating that more and more DOX molecules was in the bound state (Fig. 3). Once the DNA concentration was so high that nearly all the DOX molecules attached to the DNA chains, the net countrate values levelled off. Since the DOX concentration was the same across all samples, the ratio of net counrates is congruent with the ratio of molecular brightness values, i.e. Bf/Bb = CRf/CRb. For DOX in pUC19 and ctDNA solutions, we obtain Bf/Bb = 9.0 ± 0.1 and 10.7 ± 0.1, respectively. We attribute the slight difference between these two values to the differences in the BP contents of two studied DNA.
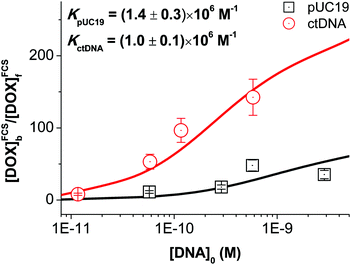
Substituting the determined values of Bf/Bb into eqn (2), we obtained the equilibrium constants for DOX–pUC19 and DOX–ctDNA interactions by fitting the calculated values of [DOX]FCSb/[DOX]FCSf as a function of [DNA]0 (see Fig. 4). The fitted values of K, (1.4 ± 0.3) × 106 M−1 for the formation of DOX–pUC19 complexes and (1.0 ± 0.1) × 106 M−1 for DOX–ctDNA ones, demonstrate the strong interaction between DOX and DNA and remarkable stability of the complexes. Taking the fitting errors into accounts, we find the two equilibrium constants are close to each other. This result agrees with our preliminary assumption that all binding sites for DOX are roughly identical. Therefore, we infer that the equilibrium constant of DOX–DNA complex-formation may be independent of the type of DNA but depends on BP type. The small differences in the two obtained values of equilibrium constants may stem from the differences in contents of GC base pairs between pUC19 (51%) and ctDNA chains (42%), since higher affinity of DOX to GC base pairs was reported.9 However, a comprehensive study using the DNA or polynucleotide with known BP composition and sequence would be needed to confirm this.
 | ||
| Fig. 4 Equilibrium constants of DOX–pUC19 and DOX–ctDNA interactions obtained from the non-linear fits using eqn (2). | ||
The equilibrium constant of DOX–ctDNA interaction determined by FCS in this work falls within the range of major published values from other methods, although other values were also reported (see Table 1 for comparisons). Differences in the published values of K in Table 1 probably originate from the different ionic strength and pH of buffers they applied, since the electrostatic interactions partially influence the formation of DOX–DNA complex.8 It is worthy to note that only nanomolar concentration of DOX is needed in our FCS-based method, which is orders of magnitude smaller than the others, reflecting the DOX–DNA interaction at single-molecule level. However, in this work we did not distinguish the binding sequence of DOX to the multiple independent sites of DNA, which is a major concerning in the studies of interaction between polynucleotides and ligands. The classical methods may provide much more detailed information on this question.38,39
| Method | Buffer solution | K (×106 M−1) |
|---|---|---|
| Isothermal titration calorimetry38 | NaCl (I = 100 mM, pH 7.0) | 0.34 ± 0.06 |
| Fluorescence titration33 | BPES (I = 185 mM, pH 7.0) | 0.61 ± 0.06 |
| Isothermal titration calorimetry9 | NaCaC (I = 2.5 mM, pH 7.0) | 0.93 ± 0.07 |
| FCS (this work) | Tris–HCl (I = 10 mM, pH 7.4) | 1.0 ± 0.1 |
| Fluorescence stopped flow39 | TNE (I = 150 mM, pH 7.0) | 1.8 |
| Fluorescence spectroscopy8 | PB (I = 1 mM, pH 7.3) | 2.0 ± 0.5 |
| Fluorescence titration34 | Tris–HCl (I = 10 mM, pH 7.5) | 3.7 |
4 Conclusions
The proposed FCS-based method for determination of equilibrium constant is relevant to any reactions involving multiple ligands or cofactors binding to a single macromolecule. In this work, we demonstrated an application of label-free FCS on a clinically important example of DOX–DNA interaction in vitro, taking advantage of the intrinsic fluorescence of DOX. Our method not only precisely reveal the K value, but also imply that it is related to the GC content rather than the total length or structure (linear, circular) of the DNA. Additional comprehensive studies using a broader range of DNA or polynucleotides with known sequences would provide more adequate evidences. The presented analytical strategy should prove particularly useful in biochemical studies (e.g. protein–DNA or drug–DNA interactions), offering a possibility to perform measurements directly in living cells with single molecule sensitivity.Conflicts of interest
There are no conflicts to declare.Acknowledgements
This work was supported by the National Science Centre, Poland within the grant Maestro UMO-2016/22/A/ST4/00017. X. Z. acknowledges experimental helps from Dr Aldona Jelińska and Pakorn Pasitsuparoad. Y. Z. acknowledges support from the European Union's Horizon 2020 research and innovation programme under the Marie Skłodowska-Curie grant agreement No. 711859 (CO-FUND Names project) and the financial resources from Ministry of Science of Poland for science in the years 2017–2021 awarded for the implementation of an international co-financed project.References
- R. B. Weiss, Seminars in Oncology, 1992, pp. 670–686 Search PubMed.
- C. Carvalho, R. X. Santos, S. Cardoso, S. Correia, P. J. Oliveira, M. S. Santos and P. I. Moreira, Curr. Med. Chem., 2009, 16, 3267–3285 CrossRef CAS PubMed.
- G. Minotti, P. Menna, E. Salvatorelli, G. Cairo and L. Gianni, Pharmacol. Rev., 2004, 56, 185–229 CrossRef CAS PubMed.
- F. Yang, S. S. Teves, C. J. Kemp and S. Henikoff, Biochim. Biophys. Acta, Rev. Cancer, 2014, 1845, 84–89 CrossRef CAS PubMed.
- L. P. Swift, A. Rephaeli, A. Nudelman, D. R. Phillips and S. M. Cutts, Cancer Res., 2006, 66, 4863–4871 CrossRef CAS PubMed.
- S. M. Cutts, A. Nudelman, A. Rephaeli and D. R. Phillips, IUBMB Life, 2005, 57, 73–81 CrossRef CAS PubMed.
- F. Arcamone, Doxorubicin: anticancer antibiotics, Elsevier, 2012 Search PubMed.
- M. Airoldi, G. Barone, G. Gennaro, A. M. Giuliani and M. Giustini, Biochemistry, 2014, 53, 2197–2207 CrossRef CAS PubMed.
- C. Pérez-Arnaiz, N. Busto, J. M. Leal and B. Garca, J. Phys. Chem. B, 2014, 118, 1288–1295 CrossRef PubMed.
- D. Agudelo, P. Bourassa, G. Bérubé and H.-A. Tajmir-Riahi, Int. J. Biol. Macromol., 2014, 66, 144–150 CrossRef CAS PubMed.
- R. Hajian, N. Shams and M. Mohagheghian, J. Braz. Chem. Soc., 2009, 20, 1399–1405 CrossRef CAS.
- C. A. Frederick, L. D. Williams, G. Ughetto, G. A. Van der Marel, J. H. Van Boom, A. Rich and A. H. Wang, Biochemistry, 1990, 29, 2538–2549 CrossRef CAS PubMed.
- L. B. Liao, H. Y. Zhou and X. M. Xiao, J. Mol. Struct., 2005, 749, 108–113 CrossRef CAS.
- H. Lei, X. Wang and C. Wu, J. Mol. Graphics Modell., 2012, 38, 279–289 CrossRef CAS PubMed.
- C. H. Stuart, D. A. Horita, M. J. Thomas, F. R. Salsbury Jr, M. O. Lively and W. H. Gmeiner, Bioconjugate Chem., 2014, 25, 406–413 CrossRef CAS PubMed.
- D. Magde, E. Elson and W. W. Webb, Phys. Rev. Lett., 1972, 29, 705 CrossRef CAS.
- E. L. Elson and D. Magde, Biopolymers, 1974, 13, 1–27 CrossRef CAS.
- D. Magde, E. L. Elson and W. W. Webb, Biopolymers, 1974, 13, 29–61 CrossRef CAS PubMed.
- M. Eigen and R. Rigler, Proc. Natl. Acad. Sci., 1994, 91, 5740–5747 CrossRef CAS.
- R. Rigler, J. Biotechnol., 1995, 41, 177–186 CrossRef CAS PubMed.
- O. Krichevsky and G. Bonnet, Rep. Prog. Phys., 2002, 65, 251 CrossRef CAS.
- X. Zhang, E. Sisamakis, K. Sozanski and R. Holyst, J. Phys., Lett., 2017, 8, 5785–5791 CAS.
- X. Zhang, A. Poniewierski, A. Jelińska, A. Zagożdżon, A. Wisniewska, S. Hou and R. Hołyst, Soft Matter, 2016, 12, 8186–8194 RSC.
- A. Michelman-Ribeiro, D. Mazza, T. Rosales, T. J. Stasevich, H. Boukari, V. Rishi, C. Vinson, J. R. Knutson and J. G. McNally, Biophys. J., 2009, 97, 337–346 CrossRef CAS PubMed.
- W. Al-Soufi, B. Reija, M. Novo, S. Felekyan, R. Kühnemuth and C. A. Seidel, J. Am. Chem. Soc., 2005, 127, 8775–8784 CrossRef CAS PubMed.
- R. Hołyst, A. Poniewierski and X. Zhang, Soft Matter, 2017, 13, 1267–1275 RSC.
- X. Zhang, A. Poniewierski, S. Hou, K. Sozański, A. Wisniewska, S. A. Wieczorek, T. Kalwarczyk, L. Sun and R. Hołyst, Soft Matter, 2015, 11, 2512–2518 RSC.
- R. Holyst, A. Bielejewska, J. Szymański, A. Wilk, A. Patkowski, J. Gapiński, A. Żywociński, T. Kalwarczyk, E. Kalwarczyk and M. Tabaka, et al. , Phys. Chem. Chem. Phys., 2009, 11, 9025–9032 RSC.
- T. Jankowski and R. Janka, ConfoCor 2 – The Second Generation of Fluorescence Correlation Microscopes, Springer, Berlin, Heidelberg, 2001, pp. 331–345 Search PubMed.
- I. De Santo, L. Sanguigno, F. Causa, T. Monetta and P. A. Netti, Analyst, 2012, 137, 5076–5081 RSC.
- H. Bisswanger, Enzyme kinetics: principles and methods, John Wiley & Sons, 2017 Search PubMed.
- B. Porsch, R. Laga, J. Horský, C. Koňák and K. Ulbrich, Biomacromolecules, 2009, 10, 3148–3150 CrossRef CAS PubMed.
- H. Yu, J. Ren, J. B. Chaires and X. Qu, J. Med. Chem., 2008, 51, 5909–5911 CrossRef CAS PubMed.
- F. Barcelo, J. Martorell, F. Gavilanes and J. M. Gonzalez-Ros, Biochem. Pharmacol., 1988, 37, 2133–2138 CrossRef CAS PubMed.
- D. Störkle, S. Duschner, N. Heimann, M. Maskos and M. Schmidt, Macromolecules, 2007, 40, 7998–8006 CrossRef.
- K. Roy, T. Antony, A. Saxena and H. Bohidar, J. Phys. Chem. B, 1999, 103, 5117–5121 CrossRef CAS.
- C. Albrecht, Anal. Bioanal. Chem., 2008, 390, 1223–1224 CrossRef CAS.
- A. R. Rubio, N. Busto, J. M. Leal and B. Garca, RSC Adv., 2016, 6, 101142–101152 RSC.
- V. Rizzo, N. Sacchi and M. Menozzi, Biochemistry, 1989, 28, 274–282 CrossRef CAS PubMed.
Footnote |
| † Electronic supplementary information (ESI) available. See DOI: 10.1039/c8cp06752j |
| This journal is © the Owner Societies 2019 |


