Effects of tensile strain and finite size on thermal conductivity in monolayer WSe2
Kunpeng
Yuan
 ,
Xiaoliang
Zhang
*,
Lin
Li
* and
Dawei
Tang
*
Key Laboratory of Ocean Energy Utilization and Energy Conservation of Ministry of Education, School of Energy and Power Engineering, Dalian University of Technology, Dalian 116024, China. E-mail: zhangxiaoliang@dlut.edu.cn; lilinnd@dlut.edu.cn; dwtang@dlut.edu.cn
First published on 11th December 2018
Abstract
In this paper, first-principles calculations along with the phonon Boltzmann transport equation are used to study the strain- and size-dependent thermal conductivity of monolayer WSe2. The thermal conductivity of monolayer WSe2 is primarily contributed by the acoustic phonons and decreases with tensile strain due to the reduction in both the group velocity and phonon lifetime. Shrinking the system size also restricts the thermal conductivity significantly by ruling out the contributions of long mean free path phonons. The rate of decrease in thermal conductivity with tensile strain is found to be size dependent, which is attributed to the competition between the phonon–phonon scattering and the phonon-boundary scattering. The decreasing trend of the thermal conductivity of monolayer WSe2 through tensile strain paves the way for high-efficiency thermoelectric materials combining the strain-tuned electronic structure.
1. Introduction
Single-layer transition metal dichalcogenides (TMDCs) have emerged as a new family of two-dimensional (2D) materials due to their fascinating physical and chemical properties.1,2 Benefiting from their sizable bandgaps, a strong interest has been aroused for applications in new field effect transistors and optoelectronic devices.3,4 Additionally, the multivalley nature of band structure in 2D TMDCs makes them excellent candidates for thermoelectrics.5,6 To achieve more widespread applications of thermoelectrics, it is essential to enhance the conversion efficiency between heat and electricity, known as the thermoelectric figure of merit ZT = S2σT/κ, where S, σ, T, and κ are the Seebeck coefficient, electrical conductivity, absolute temperature, and thermal conductivity contributed by both electrons and phonons. It is obvious that high power factor (S2σ) and low thermal conductivity are basic requirements for good thermoelectric materials. Recently, for tungsten diselenide (WSe2), the optimal power factors were reported to be 32 and 37 μW K−2 cm−1 for n- and p-type doping, which are comparable to that of the commercialized thermoelectric material bismuth telluride.7 In addition, many theoretical studies identify the superior thermoelectric performance of monolayer WSe2.8–10Although the electrical properties of WSe2 have been intensively investigated, the thermal transport properties are important and essential for the optimization of the thermoelectric properties. To date, there have been a few studies on the thermal conductivity of WSe2 but with diverse results. Experimentally, Cahill and co-workers reported that the cross-plane thermal conductivity of disordered WSe2 thin films is as low as 0.05 W m−1 K−1 at room temperature using the time-domain thermoreflectance (TDTR) approach, which is attributed to phonon localization induced by the random stacking of the two-dimensional crystalline WSe2 sheets in the cross-plane direction.11 Then the in-plane thermal conductivity of misoriented WSe2 films was measured by Shi and co-workers, the obtained in-plane thermal conductivities at room temperature are in the range of 1.2–1.6 W m−1 K−1, which is about 30 times higher than the cross-plane value.12 Employing the frequency-dependent TDTR method along with variable spot sizes, Jiang et al. systematically measured the thermal conductivity of four kinds of layered TMDCs, the in-plane thermal conductivity of WSe2 was measured to be 42 W m−1 K−1.13 Theoretically, both molecular dynamics simulations and the first-principles phonon Boltzmann transport equation (BTE) method are utilized to predict the lattice thermal conductivity. Norouzzadeh et al. predicted a value of 1.83 W m−1 K−1 at 300 K for single-layer WSe2 by non-equilibrium molecular dynamics (NEMD) simulations using a fitted Stillinger–Weber (SW) potential,14 while the in-plane thermal conductivity was observed to decrease from ∼50 to ∼30 W m−1 K−1 within the 200–500 K temperature range by equilibrium molecular dynamics (EMD) using the same SW potential developed by particle swarm optimization.15 Based on the first-principles calculations, the lattice thermal conductivity of single-layer WSe2 at a temperature of 300 K was estimated to be 53 W m−1 K−1 combined with the iterative solution of phonon BTE.16 As a comparison, the Debye–Callaway model demonstrated a value of 3.935 W m−1 K−1 under the same conditions.17 The diverse thermal conductivity results indicate that the phonon transport properties of monolayer WSe2 need to be revisited.
Previous studies have quantified the effectiveness of strain engineering on the thermal properties caused by the structural deformation.18–22 The strain effect can be easily realized by the bending, elongating or the local thermal expansion of the substrate. Moreover, the size effect should not be overlooked, because the system size dramatically restricts the phonon mean free path in the diffusive transport regime.23,24 The negative effects of strain and size on thermal conductivity have been reported in the well studied monolayer MoS2.25 However, the strain and size modulated thermal conductivity of monolayer WSe2 has not been explored.
In this study, we perform first-principles phonon BTE calculations to investigate the strain and size dependences of thermal conductivity in monolayer WSe2. The first-principles phonon BTE approach is parameter free and successfully benchmarked against a variety of systems including the effect of strain. Our simulation results reveal that there is a significant reduction of the lattice thermal conductivity in monolayer WSe2 by exerting tensile strain and restricting system length. The underlying dominant scattering events are clarified based on the analysis of mode level phonon properties.
2. Methods
All first-principles calculations are performed using density functional theory as implemented in the Vienna ab initio simulation package (VASP).26 The projector augmented wave (PAW) pseudopotentials27 are adopted to describe the interaction between electrons and ions, while the exchange and correlation interactions between electrons are modeled by the generalized gradient approximation (GGA) of the Perdew–Burke–Ernzerhof (PBE) form.28 The first Brillouin zone is sampled with a Γ-centered 12 × 12 × 1 k-mesh. The structures are allowed to be fully relaxed until both the energy convergence criteria of 10−8 eV and the force convergence threshold of 10−6 eV Å−1 are satisfied. In addition, a vacuum spacing of at least 15 Å is employed along the out-of-plane direction to eliminate the interaction between periodic images.According to the phonon kinetic theory, the lattice thermal conductivity is a summation of contribution of all the phonon modes, given by
 | (1) |
 | (2) |
The phonon lifetime is one of the key input parameters determining the lattice thermal conductivity. The finite lifetime of a phonon results from various scattering mechanisms. In our calculations, the intrinsic phonon–phonon scattering, the phonon-isotope scattering, and the phonon-boundary scattering are taken into account. The intrinsic phonon–phonon scattering rates due to anharmonic three-phonon processes are given by29
 | (3) |
 | (4) |
 , with fik and Mik being the fractional concentration and the mass of the kth isotope of the ith atom in the unit cell, and
  being the average isotopic mass.
To evaluate the effect of rough edges on the phonon scattering rate, the phonon-boundary scattering is considered. This scattering rate is inversely proportional to the system length L along the transport direction, which can be written as23
 | (5) |
When the events of phonon–phonon scattering as well as the scattering with isotopic impurities and boundary are presented, the total phonon lifetime is expressed by Matthiessen's rule as
 | (6) |
The phonon scattering rate and lattice thermal conductivity are obtained by solving the semi-classical phonon Boltzmann transport equation using the ShengBTE package,29 which requires the inputs of second-order harmonic and third-order anharmonic interatomic force constants (IFCs). The harmonic and anharmonic IFCs are constructed with a supercell-based, finite-difference method using a 5 × 5 × 1 supercell. The second-order harmonic IFCs are used to determine the phonon frequency and phonon eigenvector using the Phonopy code.32 The Born effective charges and dielectric constants are considered and obtained based on density functional perturbation theory (DFPT), which is added to the dynamical matrix as a correction for taking into account long-range electrostatic interactions. For the third-order IFCs, a script of thirdorder.py is applied to generate different supercell configurations with the consideration of both point-group symmetry and translational invariance, and the interaction cutoff up to forth-nearest-neighbor atoms is implemented.29 Finally, the lattice thermal conductivity is integrated on a well-converged 90 × 90 × 1 q-grid.
3. Results and discussion
3.1 Phonon spectrum of monolayer WSe2
Monolayer WSe2 has a hexagonal lattice configuration with a stacked Se–W–Se layer. The W atoms are sandwiched between two planes of Se atoms, and are covalently bonded to six neighboring Se atoms forming triangular prisms. Fig. 1 shows the top and side views of the atomic structure of monolayer WSe2, respectively. The optimized lattice constant a = 3.316 Å is consistent with previous theoretical calculations.8,16,33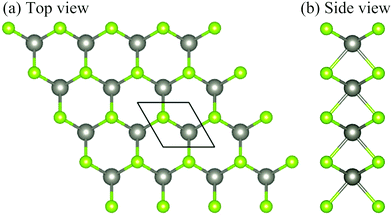 | ||
| Fig. 1 The top and side views of the crystal structure of monolayer WSe2 are shown in (a) and (b), with the W atoms in gray and the Se atoms in green. | ||
It is well known that the phonon dispersion is crucial for the calculation of phonon transport properties. Fig. 2(a) shows the phonon dispersion of monolayer WSe2 along the high symmetry path Γ–M–K–Γ. The unit cell of WSe2 has three basis atoms, resulting in three acoustic (a) phonon branches and six optical (o) phonon branches. The transverse acoustic (TA) and longitudinal acoustic (LA) branches exhibit a linear relationship with wave vector near the Γ point, whereas the out-of-plane flexural acoustic (ZA) branch is quadratic near the zone center. The average acoustic Debye temperature can be derived from34
 | (7) |
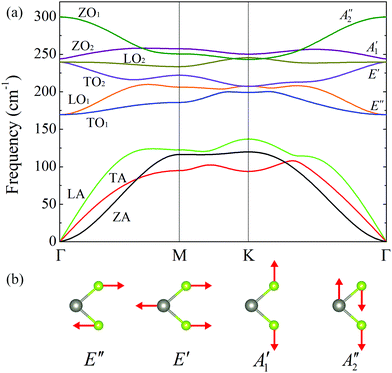 | ||
| Fig. 2 (a) Phonon dispersion curve for unstrained monolayer WSe2. (b) Schematics of atomic displacement for optical phonon modes at the Γ point. | ||
As suggested by the group-theory analysis, the monolayer WSe2 exhibits D3h point-group symmetry, so the irreducible representations of the Brillouin zone center modes can be written as Γ = 2E′′ + 2E′ + A1′ + A2′′, where A1′ and E′′ are Raman-active, A2′′ is infrared-active, and E′ is both Raman and infrared active. The corresponding vibrational patterns are plotted in Fig. 2(b). It can be seen that A1′ and A2′′ are out-of-plane vibration modes, where A1′ mode involves only the vibration of Se atoms and A2′′ mode involves the out-of-plane displacement of both W and Se atoms. Obviously, the vibrations of E′ and E′′ modes are in the basal plane, whereas the E′′ mode is a shear mode corresponding to the vibration of two rigid layers against each other. The calculated frequencies of these optical modes are 169 cm−1, 240 cm−1, 244 cm−1, and 300 cm−1, respectively. These values agree well with previous first-principles calculation results.33,38 Experimentally, the perpendicular mode A1′ and the in-plane mode E′ are almost degenerate at around 250 cm−1 in the Raman spectrum.39–41 In addition, the Fourier transform of the time domain signal reveals a frequency of 248.3 cm−1 for the A1′ optical phonon modes.42 Because of the larger lattice constant predicted by our DFT calculations, the resulting frequencies of lattice vibrations are slightly lower compared with the experimental values, but, the discrepancy is less than 3%. The consistency of phonon dispersion between theoretical calculation and experiment verifies the accuracy of harmonic IFCs.
Moreover, there is an obvious frequency gap of 32 cm−1 between the acoustic and optical phonon branches due to the large mass difference of W and Se atoms. The frequency gap could have a significant impact on the three-phonon scattering processes by changing the probability of satisfying energy and momentum conservation criteria, which affects the lattice thermal conductivity. Usually, the larger the a–o frequency gap, the higher the lattice thermal conductivity.43–47
3.2 Strain and size tuned lattice thermal conductivity
First, we present the convergence test of thermal conductivity with respect to the cutoff radius of anharmonic IFCs. As Qin et al. suggested,48 the cutoff radius can be directly determined to get satisfactory thermal conductivity results based on the analysis of harmonic IFCs. To quantify the strength of interatomic interactions described by the harmonic IFCs, we calculated the normalized trace of interatomic force constant tensors.49 According to this parameter, one can directly determine how large the cutoff radius should be to evaluate the anharmonic IFCs by effectively including the possibly strong interaction strength as revealed by the large trace value. From Fig. 3(a), it can be seen that there exist strong interactions at a distance of 0.25 nm (first-nearest neighbors), and other nearest neighbors have very weak trace values, indicating negligible force constants. As demonstrated by the convergence test of thermal conductivity in Fig. 3(b), there is a dramatic drop in the thermal conductivity after considering the first-nearest neighbors and the thermal conductivity converges quickly up to the fifth-nearest neighbors, which confirm the evaluation from the strength of the harmonic IFCs in Fig. 3(a). Previously, Kumar et al. calculated the thermal conductivity of monolayer WSe2 considering an interaction range of 0.45 nm, corresponding to the third-nearest neighbors for the anharmonic IFCs.8 Moreover, Lindroth et al. included up to the third-nearest neighbors in the in-plane direction for the thermal conductivity of bulk WSe2 based on their convergence test with respect to the cutoff distance,50 and the obtained in-plane thermal conductivity of bulk WSe2 at room temperature was consistent with the later measured in-plane thermal conductivity of bulk WSe2 using the variable-spot-size TDTR method.13 Therefore, considering both computational cost and accuracy, the interactions are truncated up to the fourth-nearest neighbors for the following anharmonic IFCs calculations.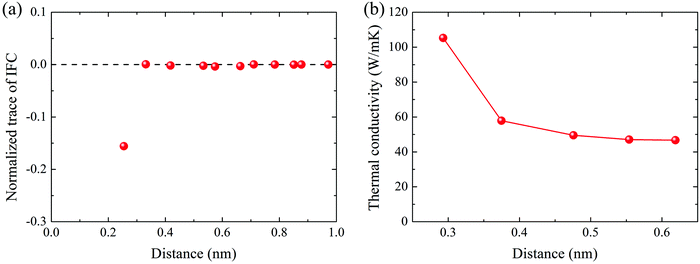 | ||
| Fig. 3 (a) Normalized trace of interatomic force constant tensors versus atomic distances. (b) Convergence test of thermal conductivity with respect to cutoff radius. | ||
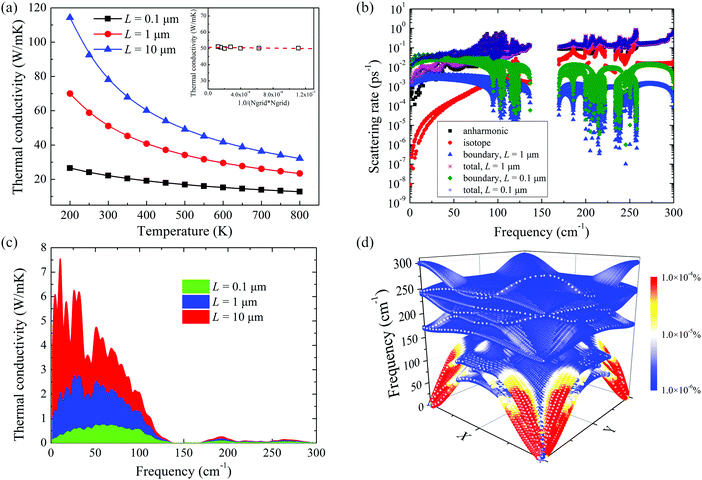
Fig. 4(a) shows the calculated lattice thermal conductivities of monolayer WSe2 with different sample sizes as a function of temperature. From the inset of Fig. 4(a), it can be seen that there is little variation in the thermal conductivity as we increase the q-grid from 30 × 30 × 1 to 90 × 90 × 1, indicating the convergence of thermal conductivity calculation. Obviously, the lattice thermal conductivity decreases with increasing temperature in the considered temperature range. As mentioned in the method section, the phonon scattering rate originating from isotope and boundary is independent of temperature. As temperature goes up beyond the Debye temperature, most phonons are excited and the phonon mean free path is mainly restricted by the Umklapp phonon–phonon scattering. In the framework of classical phonon transport theory, the Umklapp phonon–phonon scattering rate is inversely proportional to T. Therefore, the temperature-dependent thermal conductivity is governed by the Umklapp phonon–phonon scattering at high temperature. As the sample size shrinks, the phonon-boundary scattering predominates over the temperature-dependent Umklapp phonon–phonon scattering, so the lattice thermal conductivity variation with temperature is less significant compared with the cases of large sample size. From Fig. 4(a), it can be found that the lattice thermal conductivity decreases with the reduction of sample size. In order to evaluate the relative importance of different scattering mechanisms, detailed frequency distribution of phonon scattering rate is plotted in Fig. 4(b). It can be clearly seen that for a 1 μm sample size, the total scattering rate follows the trend of the anharmonic three-phonon scattering rate, except that the boundary scattering rate dominates the overall scattering rate in the extremely low frequency range originating from their high group velocity around the center of the Brillouin zone. When the sample size reduces to 0.1 μm, the boundary scattering rate increases and becomes the primary scattering mechanism in a broad frequency range as compared with the 1 μm case. Therefore, the size effect of the phonon thermal conductivity of monolayer WSe2 is significant and should be carefully considered in nano-sized WSe2.
At room temperature, the calculated lattice thermal conductivity is 51 W m−1 K−1 for monolayer WSe2 with the sample size of 1 μm, which is well consistent with other theoretical predictions based on the first-principles-driven phonon BTE method8,16 and EMD.15 This value also matches the measured in-plane thermal conductivity using a variable-spot-size TDTR approach.13 It is worth mentioning that much lower thermal conductivities are reported employing NEMD (1.83 W m−1 K−1)14 and the Debye–Callaway model (3.935 W m−1 K−1).17 Such a phenomenon that smaller thermal conductivity predicted by NEMD compared to the first-principles calculations is also observed in MoS2.16,51,52 As discussed in the previous literature, this discrepancy may arise from the inaccuracy of fitted empirical potential and the algorithm implemented to calculate the thermal conductivity. In the Debye–Callaway model, the Umklapp phonon–phonon scattering is estimated according to the Debye temperature, acoustic phonon group velocity and the Grüneisen parameter.53 It is a computationally feasible method with the exception of limited predictive power. The deviation between theoretical calculations from the Debye–Callaway model and experimental results has been found for many thermoelectric materials.54 The above discussions indicate that the capacity of molecular dynamics simulations and the Debye–Callaway model for the prediction of lattice thermal conductivity is inefficient. For comparison, single-layer MoS2, as a representative 2D TMDC, has a thermal conductivity of 103 W m−1 K−1 when the sample size is 1 μm, which is larger than that of WSe2 due to higher Debye temperature and a larger a–o frequency gap.16
In Fig. 4(c), we show the frequency dependent lattice thermal conductivity with different sample sizes at room temperature. It can be seen that most contributions to the overall lattice thermal conductivity come from three acoustic phonon branches. The lattice thermal conductivity contributed from optical modes is negligible due to their low group velocities, which is evidenced by the flat optical phonon dispersion curves shown in Fig. 2(a). From the mode contribution plotted in the three-dimensional phonon dispersion as shown in Fig. 4(d), it can also be seen that acoustic branches contribute the most to the total thermal conductivity together with a large part of the contribution coming from the LA branch. More specifically, the percentages of different phonon branches contributing to the total thermal conductivity are 27%, 28%, 42%, and 3% for ZA, TA, LA, and optical modes, respectively, which agree well with other 2D TMDCs.16,55 The out-of-plane flexural acoustic branch, which contributes as high as 75% of total thermal conductivity in graphene,56 only contributes to 27% of the total thermal conductivity of WSe2 and has an identical contribution compared to the transverse acoustic branch. For planar graphene, the reflection symmetry significantly restricts the phase space for phonon–phonon scattering of the out-of-plane flexural modes, whereas for buckling and sandwich-like two-dimensional materials,19,57 the breaking of the reflection symmetry enhances the phonon–phonon scattering phase space of the flexural modes, thus reducing their contribution to the total thermal conductivity. In contrast, the LA modes make up the dominant contribution to the overall thermal conductivity. On one hand, the relative high contribution comes from the larger group velocities of the LA modes than the other modes. On the other hand, the a–o frequency gap reduces the scattering phase space for the LA modes, resulting in a higher phonon lifetime. When heat is mainly conducted by acoustic modes, the optical-mode-induced three-phonon scattering causes thermal resistance. However, the existence of the a–o frequency gap limits the probability of the absorption processes of two acoustic phonons emerging into an optical mode.43 Therefore, the combined effects of group velocity and phonon lifetime determine the dominant role of LA modes in the total thermal conductivity.
Next, we investigate the effect of tensile strain on the lattice thermal conductivity. The strain is generated by simultaneously stretching the in-plane lattice by the same ratio ε = (a − a0)/a0, where a and a0 are the lattice constants of strained and unstrained structures.
We compare the strain-tuned lattice thermal conductivity of monolayer WSe2 along with the finite size effect in Fig. 5, and the results are normalized by the unstrained values. We first notice that, with increasing tensile strain, the lattice thermal conductivity exhibits a sustained decrease for all the sample sizes we considered. This trend is similar to other two-dimensional and bulk materials.18,25,58 At ε = 10%, the lattice thermal conductivities are reduced by 40%, 48%, and 53% for L = 0.1 μm, 1 μm, and 10 μm, respectively. A distinct feature in Fig. 5 is that the strain-modulated thermal conductivity of monolayer WSe2 shows a size-dependent reduction rate. When the WSe2 length is short (L = 0.1 μm), the speed of thermal conductivity decrease is smaller than that for the cases of L = 1 μm, and 10 μm. With further increasing the sample length, the thermal conductivity of WSe2 decreases faster with tensile strain and the rate of reduction is close to each other, thus being size-independent. This phenomenon depends on which scattering mechanism dominates the phonon lifetime. As discussed before, when the sample length is 0.1 μm, the dominant scattering mechanism is phonon-boundary scattering, the phonon lifetime is inversely proportional to the group velocity. Substituting this relation into eqn (1), it can be found that the pace of change in the lattice thermal conductivity is in line with the group velocity, i.e., κ ∼ υ. For the cases of longer systems (above 1 μm), the intrinsic anharmonic phonon–phonon scattering plays a dominant role, which is independent of group velocity. So the lattice thermal conductivity scales with the square of group velocity, κ ∼ υ2. Below it is shown that the group velocities of most phonon modes decrease with tensile strain. As a result, the relative variation of thermal conductivity is significant for a large sample size.
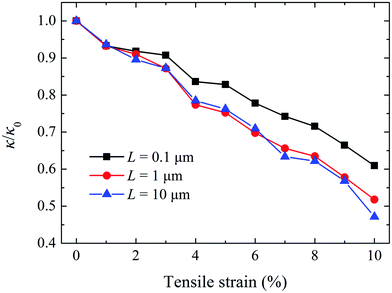 | ||
| Fig. 5 Normalized lattice thermal conductivity for different system lengths as a function of strain. | ||
3.3 Phonon scattering mechanisms
In order to reveal the underlying mechanism for the lattice thermal conductivity reduction under external strain, we conduct a detailed mode level analysis of phonon related properties. Owing to the negligible contribution of the optical phonons, we only consider the strain effect on the acoustic phonons in the discussion. From the phonon dispersion curves at different tensile strains shown in Fig. 6(a), it is obvious that all optical phonon branches experience a downward shift in frequency. In contrast, the variations of the three acoustic phonon branches are slightly different. The TA and LA branches are softened with increasing tensile strain, the same as the optical branches. As for the ZA branch, they become stiffened around the center of the Brillouin zone and softened around the boundary of the Brillouin zone, this feature is consistent with other stretched two-dimensional materials.19,20,58 As we all know, the phonon group velocity is given by the slope of the dispersion relation, υ = ∂ω/∂q. Therefore, the softening of the TA/LA branches displays depressed group velocities, while the hardening of the ZA branch undergoes enhanced group velocities in the vicinity of Γ point, as shown in Fig. 6(b). Consequently, the decreased group velocities of most phonons directly lower the thermal conductivity under strain.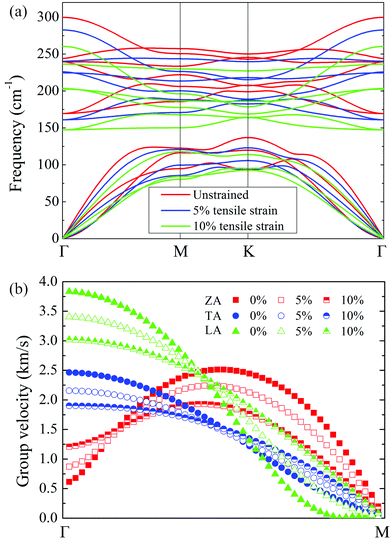 | ||
| Fig. 6 (a) Phonon dispersion curves of monolayer WSe2 at representative strains. (b) Phonon group velocity of strained monolayer WSe2 for three acoustic branches along the path Γ–M. | ||
Apart from the group velocity, another factor that governs the lattice thermal conductivity is the phonon lifetime. We present the frequency dependent phonon lifetime with different sample sizes at two typical strains in Fig. 7. The resulting phonon lifetime includes the effect of phonon–phonon scattering, phonon-isotope scattering, and phonon-boundary scattering. As we discussed above, for the case of L = 0.1 μm, the dominant scattering event is the phonon-boundary scattering, which is related to the reciprocal of the group velocity. From Fig. 7(a), it can be seen that the phonon lifetimes of ZA modes around the Γ point decrease due to the enhanced group velocities, while the phonon lifetimes of ZA modes at higher frequencies increase because of the depressed group velocities. Additionally, the phonon lifetimes of TA/LA modes also increase with increasing strain. The enhanced phonon lifetimes partially compensate the reduction of group velocity, which explains the slower decrease rate of lattice thermal conductivity under tensile strain for a short system length. With the sample size L = 1 μm, there is an interplay between the anharmonic phonon–phonon scattering and phonon-boundary scattering. The enhanced phonon–phonon scattering neutralizes the reduced phonon-boundary scattering, so there is a little difference for TA/LA modes at low frequency when stretching strain increases from ε = 0% to ε = 10%. As the system length further increases, the phonon-boundary scattering becomes weaker, the anharmonic phonon–phonon scattering overwhelms the other two scattering events and has a negative effect on the phonon lifetime with increasing tensile strain. Therefore, the phonon lifetimes of TA/LA modes are considerably reduced. Moreover, it is worth noting that the phonon lifetimes of the medium frequency ZA modes at L = 1 μm and L = 10 μm also increase with tensile strain, which is similar to the change of the corresponding modes at L = 0.1 μm. As we have pointed out, the phonon-boundary scattering is no longer in the main position of determining the phonon lifetime for system length above 1 μm, so we make a careful comparison between the total phonon lifetime and the anharmonic phonon lifetime induced only by the phonon–phonon scattering at ε = 10%. It is found that the anharmonic phonon lifetimes coming from the intrinsic phonon–phonon scattering well match with the total phonon lifetimes contributed by all three scattering terms, indicating that the increased phonon lifetimes of ZA modes in the medium frequency range originate from the restricted anharmonic phonon–phonon scattering. We show the strain effects on the intrinsic anharmonic phonon lifetime and the available scattering phase space in Fig. 8. It is clearly seen that LA modes possess the largest phonon lifetime because of larger group velocity and fewer scattering channels. Upon stretching, the anharmonic phonon lifetimes of most phonons are reduced throughout the entire frequency range except for the medium frequency ZA phonons. The changing trend of the anharmonic phonon lifetime is consistent with the finding in the total phonon lifetime in Fig. 7(b) and (c). As shown in Fig. 6(a), applying tensile strain makes the acoustic phonon dispersion curves be squeezed in a narrow region due to the phonon softening effect. The squeezed acoustic phonon dispersion curves make the three-phonon scattering process more effective and enlarge the phonon scattering probability, thus leading to reduced phonon lifetimes, especially for the TA/LA modes. However, for the ZA mode in the medium frequency range, the phase space becomes more limited after stretching, which behaves differently from the TA/LA modes. Such behavior has been found in strained silicene and is attributed to the decrease of the scattering rate for processes involving three ZA modes.19 Hence, combining the results of group velocity and phonon lifetime, it can be concluded that the decrease in both group velocity and phonon lifetime contributes to the lower lattice thermal conductivity under tensile strain.
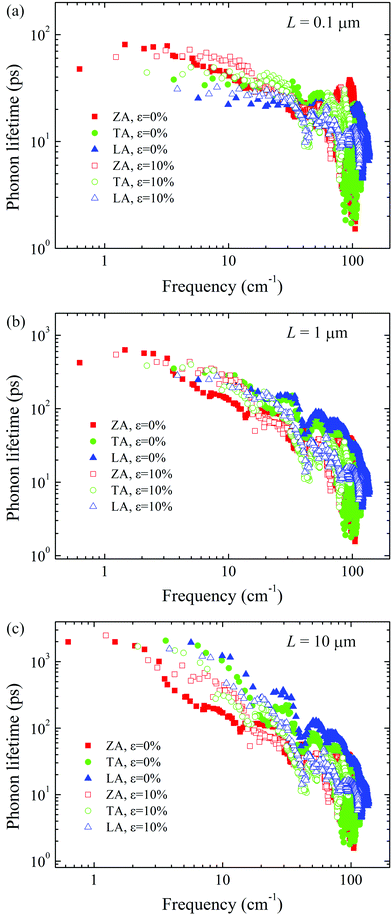 | ||
| Fig. 7 Comparison of the lifetimes of acoustic phonons between unstrained and strained systems at three system lengths: (a) L = 0.1 μm, (b) L = 1 μm and (c) L = 10 μm. | ||
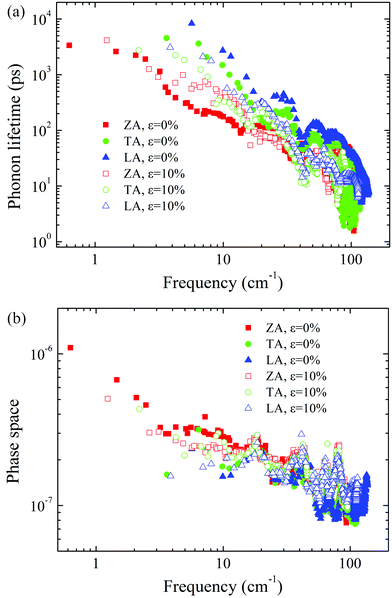 | ||
| Fig. 8 (a) The anharmonic phonon lifetimes and (b) three-phonon scattering phase spaces of acoustic modes for 0% and 10% strain. | ||
Finally, the size effect is investigated by evaluating the accumulated thermal conductivity with respect to system length with boundary scattering included, as shown in Fig. 9. It is found that the phonon mean free path (MFP) of monolayer WSe2 spans a broad size range, which is consistent with the prediction in the previous study17 and is also comparable to the MFP distribution of monolayer MoS2.16,55 Moreover, the size effect is different under tensile strain. For example, the phonons with MFPs less than 992 nm, 1479 nm, and 354 nm contribute 50% of total thermal conductivity for the 0%, 5%, and 10% strained monolayer WSe2, respectively. As a result, with nanostructures such as grain boundaries and nanoinclusions, the thermal conductivity for the 5% strained monolayer WSe2 could experience a more significant reduction. This diverse accumulative thermal conductivity with respect to system length at different strains is also obtained in strained silicene.19
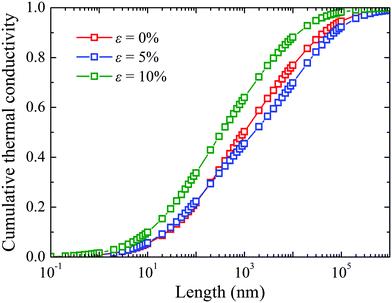 | ||
| Fig. 9 Normalized thermal conductivity accumulation function with respect to system length for 0%, 5%, and 10% strains. | ||
4. Conclusions
To summarize, first-principles calculations combined with phonon BTE are performed to systematically investigate the effects of tensile strain and finite size on the thermal conductivity of monolayer WSe2. It is found that the intrinsic thermal conductivity mainly comes from the acoustic phonons and the LA phonons contribute the most among them due to a higher group velocity and a smaller scattering rate. The thermal conductivity is found to decrease monotonically with stretching the lattice and reducing the system length. In addition, the relative variance of thermal conductivity with tensile strain is more significant for a larger system length, while a suppressed strain effect is observed for a shorter system length. The analysis of phonon related properties reveals that both decreased group velocity and phonon lifetime lead to the reduction of thermal conductivity under strain. The size-dependent reduction rate of thermal conductivity with tensile strain is attributed to the competition between the phonon–phonon scattering and the phonon-boundary scattering. The role of phonon-boundary scattering becomes less important with increasing system size. Because of the dominant role of phonon-boundary scattering at small size, the applying tensile strain will enhance the phonon lifetime due to the decrease of group velocity. The results obtained in this work provide a comprehensive understanding of the intrinsic thermal transport of monolayer WSe2 and may guide the design of WSe2-based devices.Conflicts of interest
There are no conflicts to declare.Acknowledgements
The support from the National Natural Science Foundation of China [51720105007 and 51806031] and the Fundamental Research Funds for the Central Universities [DUT16RC(3)116], and the computing resources from Supercomputer Center of Dalian University of Technology and ScGrid are greatly acknowledged.References
- Q. H. Wang, K. Kalantar-Zadeh, A. Kis, J. N. Coleman and M. S. Strano, Nat. Nanotechnol., 2012, 7, 699 CrossRef CAS.
- H. Wang, H. Yuan, S. Sae Hong, Y. Li and Y. Cui, Chem. Soc. Rev., 2015, 44, 2664–2680 RSC.
- S. Das and J. Appenzeller, Appl. Phys. Lett., 2013, 103, 103501 CrossRef.
- K. F. Mak and J. Shan, Nat. Photonics, 2016, 10, 216 CrossRef CAS.
- J. R. Schaibley, H. Yu, G. Clark, P. Rivera, J. S. Ross, K. L. Seyler, W. Yao and X. Xu, Nat. Rev. Mater., 2016, 1, 16055 CrossRef CAS.
- G. Zhang and Y.-W. Zhang, J. Mater. Chem. C, 2017, 5, 7684–7698 RSC.
- M. Yoshida, T. Iizuka, Y. Saito, M. Onga, R. Suzuki, Y. Zhang, Y. Iwasa and S. Shimizu, Nano Lett., 2016, 16, 2061–2065 CrossRef CAS.
- S. Kumar and U. Schwingenschlögl, Chem. Mater., 2015, 27, 1278–1284 CrossRef CAS.
- W. Huang, X. Luo, C. K. Gan, S. Y. Quek and G. Liang, Phys. Chem. Chem. Phys., 2014, 16, 10866–10874 RSC.
- K. Ghosh and U. Singisetti, J. Appl. Phys., 2015, 118, 135711 CrossRef.
- C. Chiritescu, D. G. Cahill, N. Nguyen, D. Johnson, A. Bodapati, P. Keblinski and P. Zschack, Science, 2007, 315, 351–353 CrossRef CAS PubMed.
- A. Mavrokefalos, N. T. Nguyen, M. T. Pettes, D. C. Johnson and L. Shi, Appl. Phys. Lett., 2007, 91, 171912 CrossRef.
- P. Jiang, X. Qian, X. Gu and R. Yang, Adv. Mater., 2017, 29, 1701068 CrossRef PubMed.
- N. Payam and J. S. David, Nanotechnology, 2017, 28, 075708 CrossRef PubMed.
- A. Mobaraki, A. Kandemir, H. Yapicioglu, O. Gülseren and C. Sevik, Comput. Mater. Sci., 2018, 144, 92–98 CrossRef CAS.
- X. Gu and R. Yang, Appl. Phys. Lett., 2014, 105, 131903 CrossRef.
- W.-X. Zhou and K.-Q. Chen, Sci. Rep., 2015, 5, 15070 CrossRef CAS.
- X. Li, K. Maute, M. L. Dunn and R. Yang, Phys. Rev. B: Condens. Matter Mater. Phys., 2010, 81, 245318 CrossRef.
- H. Xie, T. Ouyang, É. Germaneau, G. Qin, M. Hu and H. Bao, Phys. Rev. B: Condens. Matter Mater. Phys., 2016, 93, 075404 CrossRef.
- H. Liu, G. Qin, Y. Lin and M. Hu, Nano Lett., 2016, 16, 3831–3842 CrossRef CAS PubMed.
- M. Hu, X. Zhang and D. Poulikakos, Phys. Rev. B: Condens. Matter Mater. Phys., 2013, 87, 195417 CrossRef.
- G. Qin, Z. Qin, H. Wang and M. Hu, Nano Energy, 2018, 50, 425–430 CrossRef CAS.
- D. L. Nika, E. P. Pokatilov, A. S. Askerov and A. A. Balandin, Phys. Rev. B: Condens. Matter Mater. Phys., 2009, 79, 155413 CrossRef.
- L. Lindsay and D. A. Broido, Phys. Rev. B: Condens. Matter Mater. Phys., 2011, 84, 155421 CrossRef.
- Z. Liyan, Z. Tingting, S. Ziming, L. Jianhua, C. Guibin and A. Y. Shengyuan, Nanotechnology, 2015, 26, 465707 CrossRef PubMed.
- G. Kresse and J. Furthmuller, Phys. Rev. B: Condens. Matter Mater. Phys., 1996, 54, 11169–11186 CrossRef CAS.
- G. Kresse and D. Joubert, Phys. Rev. B: Condens. Matter Mater. Phys., 1999, 59, 1758–1775 CrossRef CAS.
- J. P. Perdew, K. Burke and M. Ernzerhof, Phys. Rev. Lett., 1996, 77, 3865–3868 CrossRef CAS PubMed.
- W. Li, J. Carrete, N. A. Katcho and N. Mingo, Comput. Phys. Commun., 2014, 185, 1747–1758 CrossRef CAS.
- S.-i. Tamura, Phys. Rev. B: Condens. Matter Mater. Phys., 1983, 27, 858–866 CrossRef CAS.
- L. Lindsay, D. A. Broido and T. L. Reinecke, Phys. Rev. B: Condens. Matter Mater. Phys., 2013, 88, 144306 CrossRef.
- A. Togo and I. Tanaka, Scr. Mater., 2015, 108, 1–5 CrossRef CAS.
- B. Amin, T. P. Kaloni and U. Schwingenschlogl, RSC Adv., 2014, 4, 34561–34565 RSC.
- D. T. Morelli and J. P. Heremans, Appl. Phys. Lett., 2002, 81, 5126–5128 CrossRef CAS.
- Y. Liu, Y. Wang, M. Bo, X. Liu, X. Yang, Y. Huang and C. Q. Sun, J. Phys. Chem. C, 2015, 119, 25071–25076 CrossRef CAS.
- A. Arora, M. Koperski, K. Nogajewski, J. Marcus, C. Faugeras and M. Potemski, Nanoscale, 2015, 7, 10421–10429 RSC.
- B. Peng, H. Zhang, H. Shao, Y. Xu, X. Zhang and H. Zhu, RSC Adv., 2016, 6, 5767–5773 RSC.
- H. Sahin, S. Tongay, S. Horzum, W. Fan, J. Zhou, J. Li, J. Wu and F. M. Peeters, Phys. Rev. B: Condens. Matter Mater. Phys., 2013, 87, 165409 CrossRef.
- X. Luo, Y. Zhao, J. Zhang, M. Toh, C. Kloc, Q. Xiong and S. Y. Quek, Phys. Rev. B: Condens. Matter Mater. Phys., 2013, 88, 195313 CrossRef.
- W. Zhao, Z. Ghorannevis, K. K. Amara, J. R. Pang, M. Toh, X. Zhang, C. Kloc, P. H. Tan and G. Eda, Nanoscale, 2013, 5, 9677–9683 RSC.
- P. Tonndorf, R. Schmidt, P. Böttger, X. Zhang, J. Börner, A. Liebig, M. Albrecht, C. Kloc, O. Gordan, D. R. T. Zahn, S. Michaelis de Vasconcellos and R. Bratschitsch, Opt. Express, 2013, 21, 4908–4916 CrossRef CAS PubMed.
- T. Y. Jeong, B. M. Jin, S. H. Rhim, L. Debbichi, J. Park, Y. D. Jang, H. R. Lee, D.-H. Chae, D. Lee, Y.-H. Kim, S. Jung and K. J. Yee, ACS Nano, 2016, 10, 5560–5566 CrossRef CAS PubMed.
- L. Lindsay, D. A. Broido, J. Carrete, N. Mingo and T. L. Reinecke, Phys. Rev. B: Condens. Matter Mater. Phys., 2015, 91, 121202 CrossRef.
- L. Lindsay, D. A. Broido and T. L. Reinecke, Phys. Rev. Lett., 2013, 111, 025901 CrossRef CAS PubMed.
- J. S. Kang, M. Li, H. Wu, H. Nguyen and Y. Hu, Science, 2018, 361, 575–578 CrossRef CAS PubMed.
- S. Li, Q. Zheng, Y. Lv, X. Liu, X. Wang, P. Y. Huang, D. G. Cahill and B. Lv, Science, 2018, 361, 579–581 CrossRef CAS PubMed.
- F. Tian, B. Song, X. Chen, N. K. Ravichandran, Y. Lv, K. Chen, S. Sullivan, J. Kim, Y. Zhou, T.-H. Liu, M. Goni, Z. Ding, J. Sun, G. A. G. Udalamatta Gamage, H. Sun, H. Ziyaee, S. Huyan, L. Deng, J. Zhou, A. J. Schmidt, S. Chen, C.-W. Chu, P. Y. Huang, D. Broido, L. Shi, G. Chen and Z. Ren, Science, 2018, 361, 582–585 CrossRef CAS PubMed.
- G. Qin and M. Hu, npj Comput. Mater., 2018, 4, 3 CrossRef.
- S. Lee, K. Esfarjani, T. F. Luo, J. W. Zhou, Z. T. Tian and G. Chen, Nat. Commun., 2014, 5, 3525 CrossRef PubMed.
- D. O. Lindroth and P. Erhart, Phys. Rev. B: Condens. Matter Mater. Phys., 2016, 94, 115205 CrossRef.
- X. Liu, G. Zhang, Q.-X. Pei and Y.-W. Zhang, Appl. Phys. Lett., 2013, 103, 133113 CrossRef.
- J.-W. Jiang, H. S. Park and T. Rabczuk, J. Appl. Phys., 2013, 114, 064307 CrossRef.
- J. Callaway, Phys. Rev., 1959, 113, 1046–1051 CrossRef CAS.
- Y. Zhang, J. Materiomics, 2016, 2, 237–247 CrossRef.
- B. Peng, H. Zhang, H. Shao, Y. Xu, X. Zhang and H. Zhu, Ann. Phys., 2016, 528, 504–511 CrossRef CAS.
- L. Lindsay, D. A. Broido and N. Mingo, Phys. Rev. B: Condens. Matter Mater. Phys., 2010, 82, 115427 CrossRef.
- B. Peng, D. Zhang, H. Zhang, H. Shao, G. Ni, Y. Zhu and H. Zhu, Nanoscale, 2017, 9, 7397–7407 RSC.
- Y. Han, G. Qin, C. Jungemann and M. Hu, Nanotechnology, 2016, 27, 265706 CrossRef PubMed.
| This journal is © the Owner Societies 2019 |

