The dynamical interplay between a megadalton peptide nanocage and solutes probed by microsecond atomistic MD; implications for design†
Deborah K.
Shoemark
 ab,
Amaurys
Avila Ibarra
a,
James F.
Ross
 c,
Joseph L.
Beesley
c,
Harriet E.V.
Bray
c,
Majid
Mosayebi
bd,
Noah
Linden
d,
Tanniemola B.
Liverpool
bd,
Simon N.
McIntosh-Smith
e,
Derek N.
Woolfson
c,
Joseph L.
Beesley
c,
Harriet E.V.
Bray
c,
Majid
Mosayebi
bd,
Noah
Linden
d,
Tanniemola B.
Liverpool
bd,
Simon N.
McIntosh-Smith
e,
Derek N.
Woolfson
 *abc and
Richard B.
Sessions
 *ab
*ab
aSchool of Biochemistry, Biomedical Sciences Building, University Walk, Bristol, BS8 1TD, UK. E-mail: D.N.Woolfson@bristol.ac.uk; R.Sessions@bristol.ac.uk
bBrisSynBio, Life Sciences Building, Tyndall Avenue, Bristol, BS8 1TQ, UK
cSchool of Chemistry, Cantock's Close, Bristol, BS8 1TS, UK
dSchool of Mathematics, University Walk, Bristol, BS8 1TW, UK
eComputer Sciences, Merchant Venturers’ Building, Woodland Road, Bristol, BS8 1UB, UK
First published on 28th November 2018
Abstract
Understanding the assembly and dynamics of protein-based supramolecular capsids and cages is of fundamental importance and could lead to applications in synthetic biology and biotechnology. Here we present long and large atomistic molecular dynamics simulations of de novo designed self-assembling protein nanocages (SAGEs) in aqueous media. Microsecond simulations, comprised of ≈42 million atoms for three pre-formed SAGEs of different charges, in the presence of solutes and solvent have been completed. Here, the dynamics, stability and porosity of the peptide networks are explored along with their interactions with ions, small molecules and macromolecular solutes. All assemblies are stable over the μs timescale, and the solutes show a mixture of transport behaviour across or adherence to the fabric of the SAGE particles. Solute proteins largely retained native-like conformation on contact with SAGE. Certain residues of the SAGE peptides are identified as “repeat offenders” for contacting many different solutes, which suggest modifications to reduce non-specific binding. These studies highlight how molecular dynamics can aid the design process of SAGE and similar assemblies for potential applications as diverse as platforms for drug and vaccine delivery and nanoreactors to encapsulate enzyme pathways.
Introduction
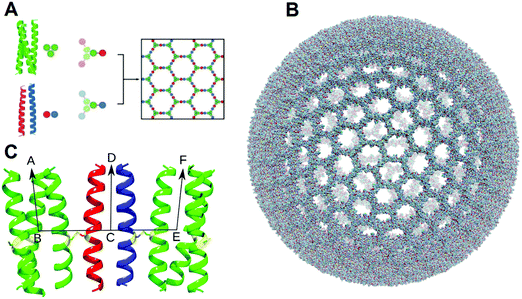
The repurposing of natural protein-based capsids and cages,1–4 involving protein engineering and directed evolution of natural protein assemblies is an extensive field.5–8 Several groups now focus on more de novo designs for protein-based higher-order cage-like assemblies and their work is perhaps more pertinent to this study. The majority of these, still employ protein engineering of natural proteins to guide the assembly of variants. This includes the pioneering work of Padilla and Yeates,9 and the equally important, more recent work from Baker, King and Yeates.10–14 These assemblies are impressive in terms of scope and accuracy of the designs achieved and reveal new areas for applications.15 In addition, Marsh and co-workers have employed hybrid/fusion approaches that use de novo peptides to assemble natural proteins.16,17 Taking this further still, Jerala and colleagues have created cage-like objects through a ‘protein-origami’ approach, which employs largely de novo coiled-coil peptides that are concatenated into single polypeptide chains.18,19With the aim of designing entirely de novo peptide-based cage-like assemblies, we have introduced the Self-Assembled peptide caGEs (SAGEs).20 In these, fully characterized de novo peptides21 are used as modules to assemble a honey-comb peptide network (Fig. 1A), which folds upon itself and closes to form spherical objects. Specifically, the design rationale is to create two self-complementary hubs, one acidic (Hub-A) and the other basic (Hub-B), that interact and co-assemble to form the network only when mixed. Each hub comprises a central trimeric module (CC-Tri),21 and each peptide of the trimer has a pendant acidic (CC-Di-A) or basic (CC-Di-B) peptide, which are the two halves of an obligate de novo designed heterodimer.22 Experimentally, the hub peptides are discrete, water-soluble and partly folded trimers as designed, and when mixed they form ≈100 nm spherical objects as visualized by electron microscopy (EM) and atomic force microscopy (AFM). Detailed AFM studies also show that these objects flatten consistent with lamellar structures, and they reveal hexagonal surfaces features. On this basis, we estimate that SAGE particles each comprise ≈10![[thin space (1/6-em)]](https://www.rsc.org/images/entities/char_2009.gif) 000 component peptides. These features have been confirmed through silicification and further AFM imaging,23 and rationalized by coarse-grained modelling.24 Moreover, and to move towards applications of the SAGEs, we have shown the component peptides can be fused to a variety of natural proteins via the expression of synthetic genes, and that the resulting fusion proteins can be incorporated into SAGE particles. We estimate that the particles can tolerate up to ∼20% incorporation of functional proteins through this process of active decoration.25 Here we describe the construction of a model of SAGE particles in silico, and subsequent long and large molecular dynamics simulations in aqueous media containing a variety of solutes. In this way, we probe the dynamics and stability of the peptide network, and how this fabric allows the transport of or interaction with the solutes. More specifically, we have compared three simulations for three SAGEs that differ in charge.
000 component peptides. These features have been confirmed through silicification and further AFM imaging,23 and rationalized by coarse-grained modelling.24 Moreover, and to move towards applications of the SAGEs, we have shown the component peptides can be fused to a variety of natural proteins via the expression of synthetic genes, and that the resulting fusion proteins can be incorporated into SAGE particles. We estimate that the particles can tolerate up to ∼20% incorporation of functional proteins through this process of active decoration.25 Here we describe the construction of a model of SAGE particles in silico, and subsequent long and large molecular dynamics simulations in aqueous media containing a variety of solutes. In this way, we probe the dynamics and stability of the peptide network, and how this fabric allows the transport of or interaction with the solutes. More specifically, we have compared three simulations for three SAGEs that differ in charge.
Encapsulation in biology – natural capsids and cages
Throughout nature the ability to separate, contain and preserve cargo within defined structures affords countless benefits to organisms from the smallest virus, through bacteria to the largest eukaryotes. The viral capsid packages genomic RNA or DNA, providing protection for transport into and around host.26 The bacterial microcompartment provides a selective advantage to those capable of utilizing substrates that yield toxic intermediates.27,28 Enclosing enzyme pathways and containing their reactive species has the added advantage of reducing the diffusion path for the products of one enzyme to become substrate for the next.25In nature, organisms accomplish encapsulation using a surprisingly limited repertoire of protein building blocks that assemble to form beautiful and often symmetric structures. Exploring the interplay of component subunits and factors affecting stability, perfusion and deformability have long been the subject of investigation. In order to determine at a molecular level, the attributes responsible for “phenotypic” behaviour, static images are invaluable. However, studying dynamical properties of large and/or complex systems, provides insights for aspects we would find hard to explore experimentally.29–31
Advances in modelling and molecular dynamics (MD) studies of natural systems
In 2006, molecular dynamics (MD) simulations of the satellite tobacco mosaic virus capsid and RNA represented the largest systems tractable for simulation, comprising ∼1 million atoms and simulated for a total of 50 ns.32 Since then, advances in high performance computing and software has significantly increased this capability. Recently, the HIV empty viral capsid comprised of 64 million atoms was simulated for 1 microsecond.33 Extending the study of the dynamical properties of systems to ever greater size, complexity and time-scales will no doubt enhance our understanding of the drivers for complex molecular machinery. Exploring the drivers for the assembly of these systems are, as yet, beyond the timescales we can usefully sample with atomistic methods and for this, methods such as coarse grain modeling is required.24,34Synthetic biology aims to build self-assembling structures from simpler components for bespoke applications
The benefits of developing a “suite” of simple building block components, with a range of properties, capable of self-assembly to form a nanostructure, provides the opportunity to mix and match components to tailor the properties of the assembled nanocage for a specific function. Individual components may be easier to produce in bulk and have known, reproducible physical properties. Engineered self-assembling systems are now emerging.11,15,35 The reduced complexity of these synthetic structures compared with e.g. viral capsids, affords the opportunity to understand in greater detail, at the molecular level, factors that influence their physical properties. Expanding our understanding informs the design process and the modularity of a synthetic systems affords greater control. Desired characteristics could be more readily “dialed-in”. This approach may in the future provide solutions for applications in which timely responses to rapidly changing need is vital, such as fast-track vaccine design and production.We describe the relative motion of peptide components within each SAGE assembly and follow their interaction with, and effect on, a variety of globular proteins and small molecules added to the solvent box. Solute permeation through the hexagonal pores and adhesion to SAGE surface was monitored and analyzed throughout these simulations. We envisage that exploring the drivers that mediate interactions with various solutes will inform the design of SAGE vehicles tailored for different purposes. For example, a SAGE drug delivery system must retain its contents until it reaches its target cell type and once taken up, release the cargo appropriately. Likewise, a SAGE nanoreactor incorporating an enzyme pathway for a synthetic task must allow starting materials to diffuse inward and end-products out.
Simulations (0.6–1.0 μs) were carried out for three SAGE constructs; the original SAGE (parent) and those with four-residue extensions at the N-termini of half of the trimeric hubs, either lysines (K4) or glutamates (E4). These constructs represent a range of charged assemblies; SAGEs with net positive charge (parent), pronounced net and surface positive charge (K4) and the net neutral, but negatively surface charged, (E4). This SAGE set represents the basis for the constructs being explored experimentally towards applications including targeted drug delivery, vaccine development and nanoreactors. All structures were simulated in a box of explicit water containing 0.15 M sodium chloride ions. Typical simulation boxes contained ∼42 million atoms and a total of 2.6 microseconds of trajectory data were acquired. It is worth noting here that the size and repeating modularity of the SAGE assemblies allows 3720 individual SAGE peptide chains to be followed dynamically. Here we describe their behaviour in the context of experimentally and biologically reasonable concentrations of a variety of proteins (40 μM each) and small molecules (1 mM each) shown in Tables 1 and 2 in ESI-2.† The length of the simulations coupled with the sheer number of repeating units within the SAGE assemblies provides extensive sampling. We anticipate our observations will prove useful for application-driven design.
Results and discussion
SAGE construction and simulations
SAGE simulations (overview)
A cubic periodic boundary box, larger than the SAGE by 5 nm in each direction was defined and filled with water, giving approximately equivalent volumes inside and outside the SAGE particle. Proteins and small molecules were added at random positions and orientations using BUDE36 while maintaining the same concentration of solute inside the SAGE as outside. Simulations were performed under the amber99SB-ildn37 forcefield using GROMACS 4.6.738 under conditions of constant pressure (1 bar) and temperature (300 K) with the PME method used for long range electrostatics. Virtual sites for chemical groups exhibiting fast motions (specifically, v-site hydrogens) allowed a 5 fs timestep to be used for the longer simulations without compromising their thermodynamic and structural behaviour.39 For further details of the setup, including sequence information, of the SAGE simulations please see ESI-2.† Structures were saved every 100 ps for further analysis. The simulations acquired during this work are listed in ESI-2† Tables 1 and 2 that also detail the proteins and small molecules added to three long simulations for parent, K4 and E4 SAGEs. The proteins and small molecule solutes were chosen to represent a wide variety of sizes, physical properties and potential utility. Details of the parallelization performance and data analysis can be found in ESI-3-4.† In this study, a single layer of peptides was built to form a hexagonal mesh representing the simplest model of SAGE assembly. This structure comprises 3720 peptides and a total of 93![[thin space (1/6-em)]](https://www.rsc.org/images/entities/char_2009.gif) 000–115
000–115![[thin space (1/6-em)]](https://www.rsc.org/images/entities/char_2009.gif) 320 amino acid residues (depending on the SAGE construct) giving a hollow object about 70 nm in diameter. We built the SAGEs based on a spherical array of 312 points as described in methods and ESI-1.† The parent-SAGE model is shown in Fig. 1B. This model maximizes contacts between adjacent trimers and dimers in the honeycomb lattice leading to all N-termini being located on one face of the lattice. MD simulation of a flat section of this lattice leads to spherical cap formation with all N-termini on the convex face, as previously described.20 Each dimer is connected to the flanking trimers via disulfide bonds, enabling alternative orientations of the dimer, while the trimers are locked in an “N-terminus-out” orientation in the SAGE model courtesy of their 3 linkages to dimers. It is also appropriate to observe that the simulations described here are too short to observe switching of peptides between partners (as doubtless happens over longer timescales) rather we are exploring the conformational flexibility around local minima corresponding to instances of already self-assembled and idealized SAGE structures. Assembly characteristics must be studied by other theoretical approaches.24
320 amino acid residues (depending on the SAGE construct) giving a hollow object about 70 nm in diameter. We built the SAGEs based on a spherical array of 312 points as described in methods and ESI-1.† The parent-SAGE model is shown in Fig. 1B. This model maximizes contacts between adjacent trimers and dimers in the honeycomb lattice leading to all N-termini being located on one face of the lattice. MD simulation of a flat section of this lattice leads to spherical cap formation with all N-termini on the convex face, as previously described.20 Each dimer is connected to the flanking trimers via disulfide bonds, enabling alternative orientations of the dimer, while the trimers are locked in an “N-terminus-out” orientation in the SAGE model courtesy of their 3 linkages to dimers. It is also appropriate to observe that the simulations described here are too short to observe switching of peptides between partners (as doubtless happens over longer timescales) rather we are exploring the conformational flexibility around local minima corresponding to instances of already self-assembled and idealized SAGE structures. Assembly characteristics must be studied by other theoretical approaches.24
Five simulations were performed over a two-year period with a largely continuous scripted queue/run cycle using 128 nodes (3072 cores) of the UK national machine Archer generating 2.4 μs of simulation time and some 6 TB of unformatted trajectory data. In all simulations but one, the N-termini of all the peptides in the initial structures are located on the outer surface of the SAGE. These constructs are named parent-SAGE-dim-o, parent-SAGE-mols, K4-SAGE-mols and E4-SAGE-mols, with the suffix mols corresponding to cases with added solutes. The exception has the N-termini of all the dimers located inside the SAGE and is named parent-SAGE-dim-i. Every peptide in the parent SAGE carries one excess positive charge giving an overall charge of +3720. The K4-SAGE has a 4-lysine extension on the N-terminus of all trimer peptides in the basic hub giving this construct an overall charge +7440. The E4-SAGE has these lysine extensions replaced by glutamates giving a neutral species overall, albeit with a negative surface charge. Further details of the simulations are given in ESI-2 Table 1.†
Global structure and dynamics
Firstly, we examined the typical time-dependent structural parameters that provide information regarding the structural stability of the assembly during the simulations via the root mean squared deviation (RMSD) to the initial structure and the radius of gyration (Rg).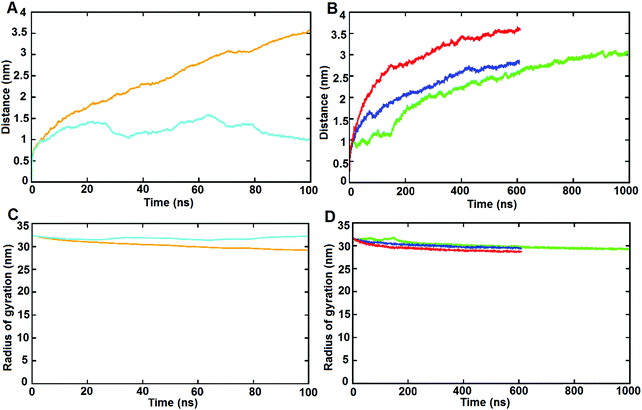 | ||
| Fig. 2 RMSD of the Cα atoms of the SAGE particles with time in the five simulations for: (A) parent-SAGE-dim-o (cyan); parent-SAGE-dim-i (brown) and (B) parent-SAGE-mols (green); K4-SAGE-mols (blue); E4-SAGE-mols (red). Radius of gyration of the SAGE particle in the five simulations for: (C) parent-SAGE-dim-o (cyan); parent- SAGE-dim-i (brown). (D) Parent-SAGE-mols (green); K4-SAGE-mols (blue); E4-SAGE-mols (red) (an expanded view can be found in ESI-5.2†). | ||
The distances between neighbouring hub trimers (Fig. 1C: vector BE) showed no significant difference between all five simulations. These range between 3 and 4.5 nm with the histograms peaking just below 4 nm. (Fig. 3, panels 1–5A). There is however some broadening observed in the three longer simulations (Fig. 3 panels 3–5A) compared with the two shorter ones (1A and 2A), consistent with increased conformational sampling in the former. This behaviour is also evident in the distribution of angles between each trimeric coiled coil (e.g.Fig. 1C: vectors BA and EF) and the corresponding radial vector (e.g.Fig. 1C: where R = SAGE-centre, vectors RB and RE). The angle histograms are shown in Fig. 3 (panels 1–5B).
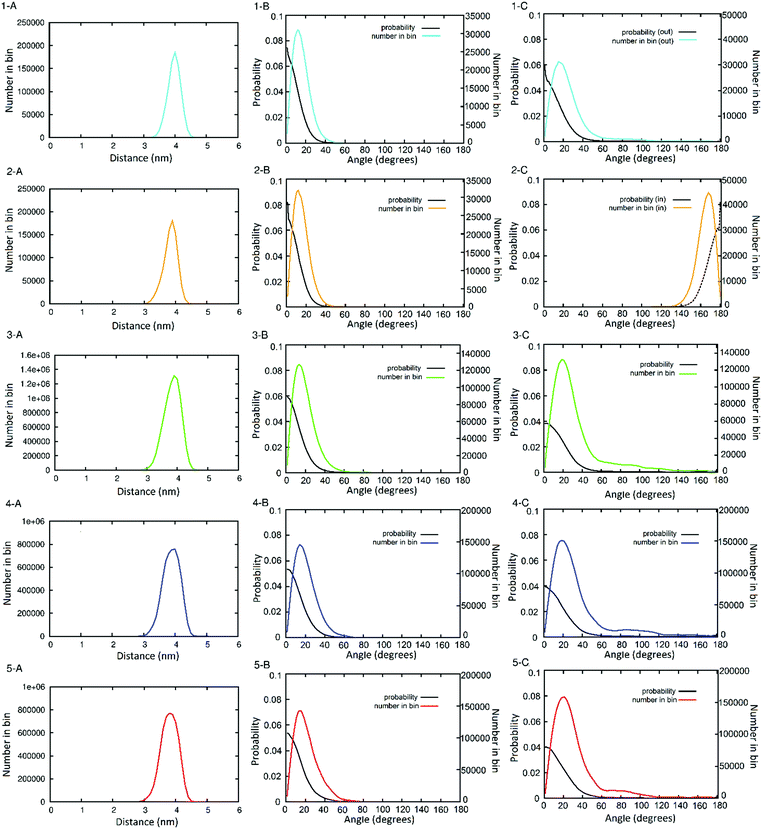 | ||
| Fig. 3 Histograms showing the distribution of peptide helix orientation throughout the simulations, by distance ((panels A) illustrated in Fig. 1C as B → E) and by angle (thus how perpendicular) to the centre of the SAGE the three-fold axis of the trimers (panels B) and two-fold axis of the dimers (panels C) remain. Panel numbers (and colour-code) correspond to the simulations of: (1) parent SAGE dimer N-out (cyan); (2) parent SAGE dimer N-in (gold); (3) 1 microsecond of the parent SAGE with solutes (green); (4) 650 ns of the K4 SAGE with solutes (blue); (5) 650 ns of the E4 SAGE with solutes (red). The probability (black lines) in these plots are derived from the number of counts in a bin divided by the surface area of the spherical sector of the bin. | ||
The orientation of the dimers can be represented by the distribution of dihedral angles (Fig. 1C: defined by ABCD and -FECD). Histograms for these data are shown in Fig. 3 (panels 1–5C). Analysis of the two shorter simulations show no interconversion between the dimer-N-out, panels (1C) orientation, and the dimer-N-in case (2C), but a wider range of angles are sampled in the former. During the longer simulations there are some dimers that reorient from dimer-N-out to dimer-N-in. However, longer simulations (by more than an order of magnitude) are required to determine whether conformational equilibration has occurred. In terms of informing design, such dimer flexibility suggests that appending “functional decoration” to the dimer pair, with peptides or proteins, would be a riskier strategy for maintaining current SAGE properties than modifying the trimers. This is consistent with experimental findings that appending peptides to the dimers compromises SAGE formation (unpublished data).
![[thin space (1/6-em)]](https://www.rsc.org/images/entities/char_2009.gif) 244 possible conformations using rigid body geometry found 344 accessible conformations for the dimer in the context of the hexagonal lattice. By measuring these 10 dihedral angles for all dimers in the 2.4 μs of all the trajectories and assigning these to the nearest minima showed that most of these 344 torsion angle permutations (87%) were sampled during the simulations. These results allow us to conclude that over this time frame the simulations have accessed most of the possible dimer conformations despite being a long way from equilibrium. Consequently, it appears that the only barrier to achieving an equilibrated simulation is sampling time.
244 possible conformations using rigid body geometry found 344 accessible conformations for the dimer in the context of the hexagonal lattice. By measuring these 10 dihedral angles for all dimers in the 2.4 μs of all the trajectories and assigning these to the nearest minima showed that most of these 344 torsion angle permutations (87%) were sampled during the simulations. These results allow us to conclude that over this time frame the simulations have accessed most of the possible dimer conformations despite being a long way from equilibrium. Consequently, it appears that the only barrier to achieving an equilibrated simulation is sampling time.
SAGEs and solutes
In the preceding section we addressed the dynamic behaviour of the different SAGE constructs in terms of their geometry and stability. Next, we turn our attention to the interactions of the SAGE peptide network with solutes present in the simulations from salt through small molecules to proteins. The small molecules and proteins were chosen to represent a range of sizes and charge. These were added to the simulation box, with the same number of molecules inside and outside the cage structures. The solutes are listed in ESI-1† Table 2 with their respective charges and molecular weights. Ten copies of each protein and 250 copies of each small molecule were distributed in random positions and orientations in the simulation boxes, corresponding to concentrations of 40 μM and 1 mM respectively. The parent-SAGE was simulated for 1 μs (parent-SAGE-mols) and the K4-SAGE (K4-SAGE-mols) and E4-SAGE (E4-SAGE-mols) for 0.6 μs each (see ESI:† parent-SAGE-mols_movie, K4-SAGE-mols_movie, E4-SAGE-mols_movie). We performed analyses to measure solute adherence to, or passage through, the SAGE peptide network.The passage of molecules through the SAGE pores was monitored by dividing the simulation box into 3 regions defined as I = inside, closest to the geometric centre of the SAGE coordinates (C), S = surface-associated, within the radial zone occupied by the SAGE and O = outside, in the region furthest from the SAGE centre. The radial zone is defined as the volume lying between two concentric spheres, the inner touching the SAGE atom closest to the centre C and the outer touching the SAGE atom furthest from C. The radial zone was recalculated at each timepoint. Each molecule was labelled at each 100 ps timepoint of the simulation as either I (inside), S (in the SAGE zone) or O (outside) based on the distance between their centre of coordinates from that of the centre of the SAGE. This allowed transitions to be identified where molecules had moved through a pore in either an outward, I → S → O or inward, O → S → I direction. A molecule was deemed to be in contact with the SAGE if at least one atom from each are within 6 Å of each other.
![[thin space (1/6-em)]](https://www.rsc.org/images/entities/char_2009.gif) 514, 36
514, 36![[thin space (1/6-em)]](https://www.rsc.org/images/entities/char_2009.gif) 618 and 40
618 and 40![[thin space (1/6-em)]](https://www.rsc.org/images/entities/char_2009.gif) 338 sodium ions for the parent, K4 and E4 SAGE-mols simulations, respectively and 42
338 sodium ions for the parent, K4 and E4 SAGE-mols simulations, respectively and 42![[thin space (1/6-em)]](https://www.rsc.org/images/entities/char_2009.gif) 774, 44
774, 44![[thin space (1/6-em)]](https://www.rsc.org/images/entities/char_2009.gif) 598, and 40
598, and 40![[thin space (1/6-em)]](https://www.rsc.org/images/entities/char_2009.gif) 878 chloride ions for the parent, K4 and E4 SAGE-mols simulations respectively. We tracked individual sodium and chloride ions within each system to gauge how often they traversed the SAGE boundary by diffusion. Plots showing the number of times ions passed from outside to inside the SAGE assemblies are shown in Fig. 4. Trajectory coordinates were saved every 0.1 ns. We have calculated the distance travelled for all single Na+Cl− ions between these timepoints, to estimate the probability it has traversed more than once. Sodium and chloride ions have diffusion constants in water at 25 °C close to 1 × 10⁻⁵ and 2 × 10⁻⁵ cm2 s−1 respectively,40 corresponding to a sub-nanometer average linear displacement per 0.1 ns. The width of the SAGE S layer is 10.8 ± 1.0 nm, hence the great majority of events measured will correspond to single passages of an ion across the SAGE network. The simulation data correspond reasonably well with these experimental values, having average displacements of 1.2 ± 0.5 nm (Na+) and 1.3 ± 0.6 nm (Cl−) over 0.1 ns (ESI-6.1.2†).
878 chloride ions for the parent, K4 and E4 SAGE-mols simulations respectively. We tracked individual sodium and chloride ions within each system to gauge how often they traversed the SAGE boundary by diffusion. Plots showing the number of times ions passed from outside to inside the SAGE assemblies are shown in Fig. 4. Trajectory coordinates were saved every 0.1 ns. We have calculated the distance travelled for all single Na+Cl− ions between these timepoints, to estimate the probability it has traversed more than once. Sodium and chloride ions have diffusion constants in water at 25 °C close to 1 × 10⁻⁵ and 2 × 10⁻⁵ cm2 s−1 respectively,40 corresponding to a sub-nanometer average linear displacement per 0.1 ns. The width of the SAGE S layer is 10.8 ± 1.0 nm, hence the great majority of events measured will correspond to single passages of an ion across the SAGE network. The simulation data correspond reasonably well with these experimental values, having average displacements of 1.2 ± 0.5 nm (Na+) and 1.3 ± 0.6 nm (Cl−) over 0.1 ns (ESI-6.1.2†).
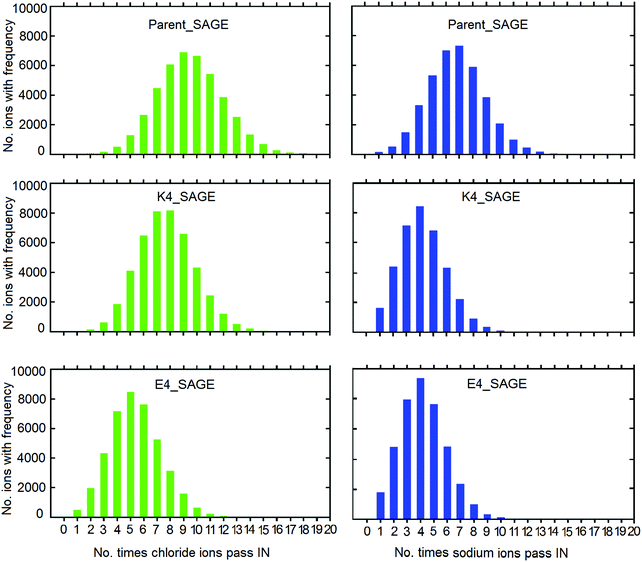 | ||
| Fig. 4 The frequency distribution of the passage of sodium ions (blue) and chloride ions (green) crossing the SAGE boundaries inwards during the time-period 0–600 ns for the E4-SAGE (panel A), parent-SAGE (panel B) and K4-SAGE (panel C). Corresponding graphs showing ion passage in the outwards direction are shown in Fig. ESI-6.1.1.† | ||
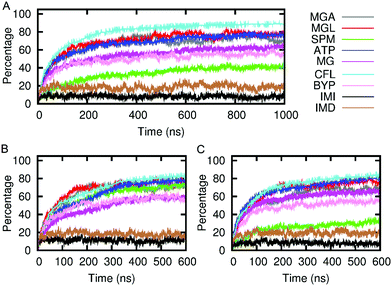
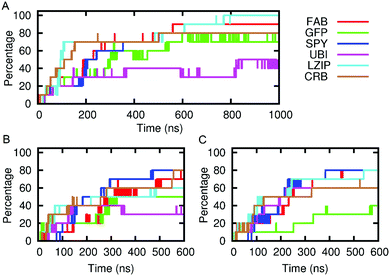
We envisage future applications where solute passage needs to be either permissive or prevented. The results, shown in Fig. 5, indicate that the SAGEs are remarkably sticky. Most of the molecules spend most of their time adhering to the SAGE surface, the exceptions being small and very hydrophilic solutes, particularly imidazole and its protonated ion. The mixed behaviour of the small molecules (some adhering and some passing freely through the SAGE peptide network) was illustrated by plotting the distance from the centre of the SAGE of each molecule with time. By representing the molecules as points on the graph and colouring these differently depending on their initial location inside versus outside the SAGE, it is possible to visually follow adherence and permeation with time. See ESI-6.2† for these plots.
FAB, although heavily positively charged seems to bind with almost equivalent avidity to all assemblies regardless of overall or surface charge, this may be related to the lack of glycosylation in the FAB model.
We have evidence for this adherent behaviour in vitro as adding GFP to parent-SAGE is enough to stain in correlated light EM and sharpen the SAGE DLS signal.25 In addition, we have experimentally quantified the amount of soluble GFP binding to the parent, K4 and E4 SAGEs according to the methods and figure shown in ESI-7.1.† These data reflect a similar tendency for solutes to adhere to the SAGE surface in vitro as in silico. The experiments performed here indicate that around 200 GFP proteins bind to one SAGE particle and there is little dependence on the charge of the SAGEs.
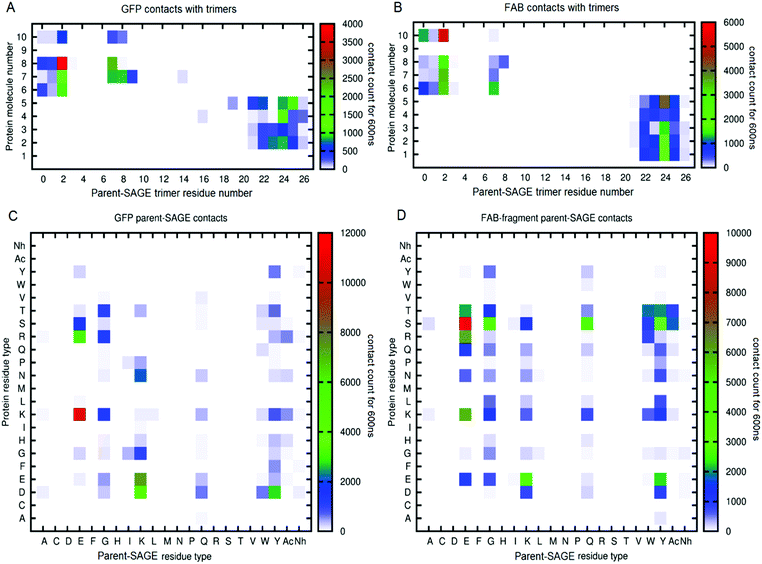
![[thin space (1/6-em)]](https://www.rsc.org/images/entities/char_2009.gif) 000 would mean a molecule was in contact with the parent-SAGE throughout a 1000 ns trajectory. In these maps, protein solutes are numbered 1–5 if they began the simulation inside the SAGE and 6–10 for those outside. Further inspection of panels A and B reveal that the second residue in the parent-SAGE trimer interacts most persistently with both GFP and FAB molecules (denoted by a red block). This information correlates well with the information in panels C and D showing that the parent-SAGE residue type that most frequently interacts with both GFP and FAB were glutamates and the second residue of the parent SAGE is indeed a glutamate. The E2 residue in the trimer also is a frequent interaction site with other proteins for the parent, K4 and E4-SAGE interactions, indicating it is a residue to avoid if non-specific binding is an issue. The most frequently interacting residues are the ones that started out nearest the external surface of the SAGE, suggesting that penetration of the peptide network by these protein solutes is limited, at least on this time-scale. By heat-mapping residue contacts in this way, we identified SAGE residues that are most likely to contribute to non-specific binding events, thus informing the design process for the next generation of in vitro SAGE assemblies. Representations for all the protein solutes in the context of parent, K4 and E4 SAGEs can be found in ESI-6.3.†
000 would mean a molecule was in contact with the parent-SAGE throughout a 1000 ns trajectory. In these maps, protein solutes are numbered 1–5 if they began the simulation inside the SAGE and 6–10 for those outside. Further inspection of panels A and B reveal that the second residue in the parent-SAGE trimer interacts most persistently with both GFP and FAB molecules (denoted by a red block). This information correlates well with the information in panels C and D showing that the parent-SAGE residue type that most frequently interacts with both GFP and FAB were glutamates and the second residue of the parent SAGE is indeed a glutamate. The E2 residue in the trimer also is a frequent interaction site with other proteins for the parent, K4 and E4-SAGE interactions, indicating it is a residue to avoid if non-specific binding is an issue. The most frequently interacting residues are the ones that started out nearest the external surface of the SAGE, suggesting that penetration of the peptide network by these protein solutes is limited, at least on this time-scale. By heat-mapping residue contacts in this way, we identified SAGE residues that are most likely to contribute to non-specific binding events, thus informing the design process for the next generation of in vitro SAGE assemblies. Representations for all the protein solutes in the context of parent, K4 and E4 SAGEs can be found in ESI-6.3.†
Conclusions
In anticipation of the SAGEs’ potential in synthetic biology, we have performed long and large dynamic simulations and monitored the interplay between SAGE assemblies and protein and small molecule solutes. SAGEs as nanoreactors25 will require permeability to enable the flow of substrates in and products out. Our studies have shown that though sodium and chloride ions diffuse freely through the peptide network, small molecule permeation is largely influenced by charge, an effect that is more pronounced for the protein solutes. This behaviour will need to be factored in to nanoreactor design. Medical applications using SAGEs as drug or vaccine delivery platforms will require many specific attributes around targeting, rigidity, stability (shelf-life) and in vivo susceptibility to degradation. SAGE assemblies are stable under simulation conditions, even with an artefactually induced rent in the side. Component peptide orientation has revealed that cell-targeting or epitope presenting peptides and proteins are best attached to the less motile trimer peptides. Lastly, the negligible influence on solute protein conformation by SAGE contact, bodes well for presenting native-like larger peptide structures as conformational epitopes in a SAGE-based vaccine delivery system.The ∼42 million atom simulations reported here have pushed the boundaries of size, complexity and duration possible with current hardware. We have shown that with high performance computing such as Archer and software such as GROMACS, atomistic molecular dynamics simulations of this size are possible and yield informative results. Considering the inexorable advances in computer architecture, these types of simulation will become run-of-the-mill in the near-future.
Our analyses have helped us gain a better understanding of how to manipulate this inherently versatile system towards synthetic biological applications as diverse as nanoreactors for complex, eco-friendly chemistry and delivery systems for drugs and vaccines.
Abbreviations
| RMSD | Root mean square deviation |
| MD | Molecular dynamics |
| PME | Particle mesh Ewald |
| SAGE | Self-assembling protein nanocage |
| E4-SAGE | Self-assembling nanocage with 4 glutamate residues at the N-terminus of half of the trimer peptides |
| K4-SAGE | Self-assembling nanocage with 4 lysine residues at the N-terminus of half of the trimer peptides |
| BUDE | Bristol University Docking Engine |
| AFM | Atomic force microscopy |
| GROMACS | GROningen MAchine for Chemical Simulations |
| EM | Electron microscopy |
| DLS | Dynamic light scattering. |
Conflicts of interest
The authors declare no conflicts of interest.Acknowledgements
Extensive computer time on the UK HPC machine Archer was secured via an EPSRC LeaderShip Award. We also thank the UK HECBiosim Consortium and the University of Bristol Advanced Computing Research Centre for further provision of computer time and storage. DKS, MM, RBS, DNW and TBL are supported by BrisSynBio, a BBSRC/EPSRC Synthetic Biology Research Centre (BB/L01386X/1). RBS and DNW are funded by a BBSRC LoLa grant (BB/M002969/1). DNW is a Royal Society Wolfson Research Merit Award holder (WM140008).References
- Y. Zhang, M. S. Ardejani and B. P. Orner, Chem. – Asian J., 2016, 11, 2814–2828 CrossRef CAS PubMed.
- J. G. Heddle, S. Chakraborti and K. Iwasaki, Curr. Opin. Struct. Biol., 2017, 43, 148–155, DOI:10.1016/j.sbi.2017.03.007.
- W. M. Aumiller, M. Uchida and T. Douglas, Chem. Soc. Rev., 2018, 47, 3433–3469, 10.1039/C7CS00818J.
- F. Lapenta, J. Aupic, Z. Strmsek and R. Jerala, Chem. Soc. Rev., 2018, 47, 3530–3542, 10.1039/C7CS00822H.
- M. S. Ardejani, X. L. Chok, C. J. Foo and B. P. Orner, Chem. Commun., 2013, 49, 3528–3530, 10.1039/C3CC40886H.
- T. A. Cornell, J. Fu, S. H. Newland and B. P. Orner, J. Am. Chem. Soc., 2013, 135, 16618–16624, DOI:10.1021/ja4085034.
- J. G. Heddle, I. Fujiwara, H. Yamadaki, S. Yoshii, K. Nishio, C. Addy, I. Yamashita and J. R. Tame, Small, 2007, 3, 1950–1956 CrossRef CAS PubMed.
- T. A. Cornell, M. S. Ardejani, J. Fu, S. H. Newland, Y. Zhang and B. P. Orner, J. Am. Chem. Soc., 2018, 57, 604–613, DOI:10.1021/acs.biochem.7b01000.
- J. E. Padilla, C. Colovos and T. O. Yeates, Proc. Natl. Acad. Sci. U. S. A., 2001, 98, 2217–2221 CrossRef CAS PubMed.
- Y. T. Lai, D. Cascio and T. O. Yeates, Science, 2012, 336, 1129, DOI:10.1126/science.1219351.
- N. P. King, W. Sheffler, M. R. Sawaya, B. S. Vollmar, J. P. Sumida, I. André, T. Gonen, T. O. Yeates and D. Baker, Science, 2012, 336, 1171–1174, DOI:10.1126/science.1219364.
- N. P. King, J. B. Bale, W. Sheffler, D. E. McNamara, S. Gonen, T. Gonen, T. O. Yeates and D. Baker, Nature, 2014, 510, 103, DOI:10.1038/nature13404.
- Y.-T. Lai, E. Reading, G. L. Hura, K.-L. Tsai, A. Laganowsky, F. J. Asturias, J. A. Tainer, C. V. Robinson and T. O. Yeates, Nat. Chem., 2014, 6, 1065, DOI:10.1038/nchem.2107.
- J. B. Bale, S. Gonen, Y. Liu, W. Sheffler, D. Ellis, C. Thomas, D. Cascio, T. O. Yeates, T. Gonen, N. P. King and D. Baker, Science, 2016, 353, 389–394 CrossRef CAS PubMed.
- G. L. Butterfield, M. J. Lajoie, H. H. Gustafson, D. L. Sellers, U. Nattermann, D. Ellis, J. B. Bale, S. Ke, G. H. Lenz, A. Yehdego, R. Ravichandran, S. H. Pun, N. P. King and D. Baker, Nature, 2017, 552, 415, DOI:10.1038/nature25157.
- A. Sciore, M. Su, P. Koldewey, J. D. Eschweiler, K. A. Diffley, B. M. Linhares, B. T. Ruotolo, J. C. A. Bardwell, G. Skiniotis and E. N. G. Marsh, Proc. Natl. Acad. Sci. U. S. A., 2016, 113, 8681–8686 CrossRef CAS PubMed.
- S. Badieyan, A. Sciore, J. D. Eschweiler, P. Koldewey, A. S. Cristie-David, B. T. Ruotolo, J. C. A. Bardwell, M. Su and E. N. G. Marsh, ChemBioChem, 2017, 18, 1871, DOI:10.1002/cbic.201700481.
- H. Gradizar, S. Bozic, T. Doles, D. Vengust, I. Hafner-Bratkovic, A. Mertelj, B. Webb, A. Sali, S. Klavzar and R. Jerala, Nat. Chem. Biol., 2013, 9, 362–366 CrossRef PubMed.
- A. Ljubetič, F. Lapenta, H. Gradišar, I. Drobnak, J. Aupič, Z. Strmšek, D. Lainšček, I. Hafner-Bratkovič, A. Majerle, N. Krivec, M. Benčina, T. Pisanski, T. C. Veličković, A. Round, J. M. Carazo, R. Melero and R. Jerala, Nat. Biotechnol., 2017, 35, 1094–1101, DOI:10.1038/nbt.3994.
- J. M. Fletcher, R. L. Harniman, F. R. Barnes, A. L. Boyle, A. Collins, J. Mantell, T. H. Sharp, M. Antognozzi, P. J. Booth, N. Linden, M. J. Miles, R. B. Sessions, P. Verkade and D. N. Woolfson, Science, 2013, 340(6132), 595–599, DOI:10.1021/ja2082476.
- J. M. Fletcher, A. L. Boyle, M. Bruning, G. J. Bartlett, T. L. Vincent, N. R. Zaccai, C. T. Armstrong, E. H. C. Bromley, P. J. Booth, R. L. Brady, A. R. Thomson and D. N. Woolfson, ACS Synth. Biol., 2012, 1, 240–250, DOI:10.1021/sb300028q.
- F. Thomas, A. I. Boyle, A. J. Burton and D. N. Woolfson, J. Am. Chem. Soc., 2013, 135, 5161–5166, DOI:10.1021/ja312310g.
- J. M. Galloway, L. Senior, J. M. Fletcher, J. L. Beesley, L. R. Hodgson, R. L. Harniman, J. M. Mantell, J. Coombs, G. G. Rhys, W.-F. Xue, M. Mosayebi, N. Linden, T. B. Liverpool, P. Curnow, P. Verkade and D. N. Woolfson, ACS Nano, 2017, 12(2), 1420–1432 CrossRef PubMed.
- M. Mosayebi, D. K. Shoemark, J. M. Fletcher, R. B. Sessions, N. Linden, D. N. Woolfson and T. B. Liverpool, Proc. Natl. Acad. Sci. U. S. A., 2017, 114, 9014–9019, DOI:10.1073/pnas.1706825114.
- J. F. Ross, A. Bridges, J. M. Fletcher, D. K. Shoemark, D. Alibhai, H. E. V. Bray, J. L. Beesley, W. M. Dawson, L. R. Hodgson, J. M. Mantell, P. Verkade, C. M. Edge, R. B. Sessions, D. Tew and D. N. Woolfson, ACS Nano, 2017, 11, 7901–7914 CrossRef CAS PubMed.
- N. Nandhagopal, A. A. Simpson, J. R. Gurnon, X. Yan, T. S. Baker, M. V. Graves, J. L. Van Etten and M. G. Rossmann, Proc. Natl. Acad. Sci. U. S. A., 2002, 99, 14758–14763 CrossRef CAS PubMed.
- C. A. Kerfeld, C. Aussignargues, J. Zarzycki, F. Cai and M. Sutter, Nat. Rev. Microbiol., 2018, 16(5), 277–290, DOI:10.1038/nrmicro.201.
- M. J. Lee, J. M. Mantell, L. Hodgson, D. Alibhai, J. M. Fletcher, I. R. Brown, S. Frank, W.-F. Xue, P. Verkade, D. N. Woolfson and M. Warren, Nat. Chem. Biol., 2017, 14, 142–147, DOI:10.1038/nchembio.2535.
- J. R. Perilla, B. C. Goh, C. K. Cassidy, B. Liu, R. C. Bernardi, T. Rudack, H. Yu, Z. Wu and K. Schulten, Curr. Opin. Struct. Biol., 2015, 31, 64–74 CrossRef CAS PubMed.
- E. Tarasova, V. Farafonov, R. Khayat, N. Okimoto, T. S. Komatsu, M. Taiji and D. Nerukh, J. Phys. Chem. Lett., 2017, 8, 779–784 CrossRef CAS PubMed.
- J. R. Perilla, J. A. Hadden, B. C. Goh, C. G. Mayne and K. Schulten, J. Phys. Chem. Lett., 2016, 7, 1836–1844 CrossRef CAS PubMed.
- P. L. Freddolino, A. S. Arkhipov, S. B. Larson, A. McPherson and K. Schulten, Structure, 2006, 14, 437–449 CrossRef CAS PubMed.
- J. R. Perilla and K. Schulten, Nat. Commun., 2017, 8, 15959, DOI:10.1038/ncomms15959.
- D. C. Rapaport, J. Biol. Phys., 2018, 44(2), 147–162 CrossRef CAS PubMed.
- S. Kwon, H. S. Shin, J. Gong, J.-H. Eom, A. Jeon, S. H. Yoo, I. S. Chung, S. J. Cho and H. S. Lee, J. Am. Chem. Soc., 2011, 133(44), 17618–17621 CrossRef CAS PubMed.
- S. N. McIntosh-Smith, J. R. Price, R. B. Sessions and A. A. Ibarra, Int. J. High Perform. Comput. Appl., 2015, 29(2), 119–134, DOI:10.1177/1094342014528252.
- K. Lindorff-Larsen, S. Piana, K. Palmo, P. Maragakis, J. L. Klepeis, R. O. Dror and D. E. Shaw, Proteins, 2010, 78, 1950–1958 CAS.
- B. Hess, C. Kutzner, D. van der Spoel and E. Lindahl, J. Chem. Theory Comput., 2008, 4(3), 435–447 CrossRef CAS PubMed.
- H. J. C. Berendsen and W. F. van Gunsteren, Molecular dynamics simulations: Techniques and approaches, in Molecular Liquids-Dynamics and Interactions, ed. Barnes, A. J., Orville-Thomas, W. J. and Yarwood, J., Reidel Dordrecht, The Netherlands, 1984, pp. 475–500 Search PubMed.
- E. Hawlicka, Z. Naturforsch., A: Phys. Sci., 1987, 42, 1014–1016 CAS.
Footnote |
| † Electronic supplementary information (ESI) available. See DOI: 10.1039/c8cp06282j |
| This journal is © the Owner Societies 2019 |

