Deformation mechanisms of polytetrafluoroethylene at the nano- and microscales
Matthew
Brownell
a and
Arun K.
Nair
 *ab
*ab
aMultiscale Materials Modeling Lab, Department of Mechanical Engineering, University of Arkansas, Fayetteville, AR, USA. E-mail: nair@uark.edu; Fax: +479-575-6982; Tel: +479-575-2573
bInstitute for Nanoscience and Engineering, University of Arkansas, 731 W. Dickson Street, Fayetteville, AR-72701, USA
First published on 26th November 2018
Abstract
Polytetrafluoroethylene (PTFE) has not only a low coefficient of friction but also a high wear rate. Numerous studies investigating the possibility of reducing wear and the mechanisms of deformation have been conducted using experimental and computational studies. In this paper the deformation and mechanical failure of single chains and bulk PTFE are investigated using molecular dynamics (MD). Due to the length scale limitations of the model that MD simulations can investigate, a coarse-grained model is developed and PTFE particles of varying densities are generated to investigate their mechanical properties at the microscale. The coarse-grained potential parameters and coarse-grained model of PTFE are derived from first principles based ReaxFF simulations and are then used to investigate the microscale mechanical properties of PTFE. The MD study indicates that temperature has a pronounced effect on the maximum strength of a single chain, the elastic modulus is dependent on chain length, and chains shorter than 100 Å have an increase in maximum strength. During indentation and scratch the frictional coefficient of bulk PTFE is dependent on the direction of the scratch on the PTFE substrate. The coarse-grained PTFE simulations show that indentation force is dependent on the density of PTFE, and the smoother the surface of the particle the lower the coefficient of friction. The coarse-grained model that connects the atomic and macroscales of PTFE will lead to a direct comparison with experimental PTFE thin films.
1 Introduction
Polytetrafluoroethylene (PTFE) is used in various fields as a sealant material,1 in biological implants,2 and as protective surface films and coatings.3,4 PTFE exhibits excellent thermal and chemical properties and exhibits hydrophobic behavior.5 However, since its discovery in 1938,6 PTFE has been of great interest due to its particularly low coefficient of friction.7–9 Atomic force microscopy reveals that PTFE, once heated, coalesces into a fiber-like cohesive coating.10 The pulling of the macroscale PTFE orients the fibers in the pulling direction. When tested, the coefficient of friction depends on the direction of the oriented PTFE fibers.11Despite its unique and useful properties, PTFE has the disadvantages of low wear resistance and loading capacity.9,12,13 The longevity of PTFE can be improved by increasing crystallinity, or adding filler particles into the polymer matrix.14 To improve the wear rate, micrometer sized filler particles were introduced into the polymer, which increased the wear rate by one to two orders of magnitude.12,13,15–18 The fillers were also able to increase the crystallinity and ultimate strength of the PTFE sample.19 Nanometer sized particles were also investigated and proven to be effective at reducing the wear rate.20,21 Copper nanoparticle fillers with a polydopamine coating were found to decrease the wear rate even further without increasing the coefficient of friction.10,22,23 PTFE particles on the microscale have approximately a spherical shape, but when heated to 372 °C, they form a needle shape.10 Why the shape changes during heating is unknown, and investigating the properties of the shapes of PTFE particles will illuminate failure mechanisms within thin film PTFE.
Investigations involving thin film PTFE and imbedded alumina nanoparticles led to the discovery of the formation of an ultralow wear thin film deposited on a counterface.24 This deposition occurs within the first cycle of sliding on a substrate and creates a robust tribofilm on both sliding surfaces,3,25,26 which protects and increases the wear rate to hundreds of thousands of rubbing cycles.4 While some believe that the counter-surface effect is purely mechanical,27 others have proposed that the effects are more structural,28,29 or even chemical.4 Ultralow wear PTFE composites show exceptional promise for materials of the future.20,26,30
Molecular dynamics simulations have been performed in multiple studies to investigate the effects of filler particles, surface topologies, and durability and wear on PTFE at the nanoscale. The wetting behavior and the effects of the temperature and sliding direction on the friction and wear of PTFE are a few relevant studies conducted using molecular dynamics.31–33 Herbold et al. investigated the effects of metallic particles in a PTFE–W–Al composite; they suggested that the filler particles create force chains which help distribute and support any load on the PTFE matrix, increasing its wear resistance and load capacity.34
Multiscale models can be used to increase the length scale under investigation from nanometers to micrometers. Multiscale methods involving PTFE have been studied before to investigate various properties of perfluorosulfonic acid (PFSA) membranes, which consist of the PTFE backbone and a perfluorinated ether side chain, but never has a coarse-grained model of pure PTFE been investigated for its mechanical properties.35–37 The concept of creating a coarse-grained model has been used to investigate the self-folding mechanics of carbon nanotubes,38 the mechanics of twisting carbon nanotube yarns,39 and the aforementioned study investigating PFSA membranes.36
Recent experimental studies have shown continuing promise for PTFE as a thin film, particularly with the use of a polydopamine substrate or alumina particles.10,22,23,25 Molecular dynamics simulations have been used to investigate the rubbing of PTFE on a metallic substrate as well as PTFE–PTFE interactions.4,33 Further improving our understanding of deformation mechanisms on the nanoscale and how these mechanisms affect the microscale particles will allow the design of more durable thin films. In this work, molecular dynamics simulations are used to study solvated and unsolvated individual PTFE chain response to tensile stress at different temperatures. Indentation and scratch tests are performed on bulk PTFE using MD, and a coarse-grained model of PTFE is developed, which increases the length scale of feasible models from nanometers to micrometers. Indentation and scratch tests are then performed on the coarse-grained models that mimic PTFE particles at the macroscale to compare deformation mechanisms between the coarse-grained microscale PTFE and atomic scale models.
2 Methods
We develop atomistic scale models of individual PTFE chains to study the effect of length and temperature on the chain strength. To study the frictional properties of PTFE particles of various shapes, we develop a coarse-grained model from the atomistic model.2.1 Atomistic modeling
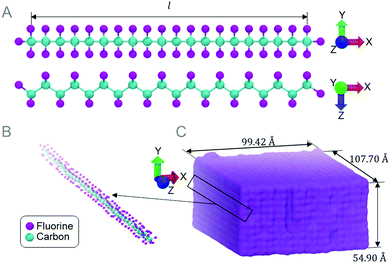
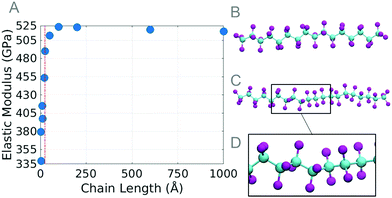
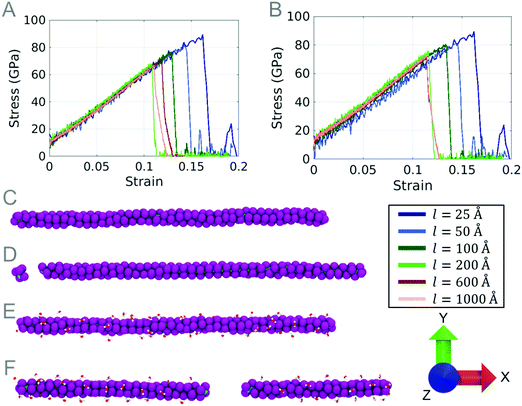
The molecular dynamics method is used to simulate tensile tests on single chain PTFE (Fig. 1A). The chain lengths investigated range from approximately 3 Å to 1000 Å, and only chains longer than 25 Å are studied further due to their stabilized elastic moduli during preliminary testing. 100 Å long chains (Fig. 1B) are stacked parallel in a square lattice to create a bulk PTFE (Fig. 1C). Nanoindentation and scratch tests are performed on the bulk PTFE model to study the effect that the chain orientation has on the resistance to scratch. All MD simulations are performed using the ReaxFF40 due to the near quantum mechanical level accuracy41 and it is especially suited to model fluorinated graphene. The ReaxFF is also capable of performing chemical reactions between PTFE and water molecules. All simulations are performed using the Large-scale Atomic/Molecular Massively Parallel Simulator (LAMMPS)42 and visualized in Visual Molecular Dynamics (VMD).43Understanding atomic scale single chain PTFE and its reaction to stress and strain, temperature, and water will provide insight into nanoscale deformation mechanisms. Measuring the tensile strength of PTFE chains will provide an explanation for failure mechanisms at the nanoscale. Tensile tests are performed on single PTFE chains of various lengths, temperatures, and water contents. Chain lengths (Fig. 1A) vary from l = 25, 50, 100, 200, and 600 to 1000 Å, where each chain contains 20, 40, 80, 160, 450, and 755 carbon atoms respectively. Chains are tested at 300 K in 57.5 wt% water and in a vacuum. A chain length of 100 Å is chosen to test the effects of temperature and chemical environments. The temperature variation ranges from 300 K to 600 K incremented by 50 K.
In each tensile test simulation, PTFE chains are minimized for 2 ps. To prevent the chain from curling, the carbon atoms at either end of the chain are prevented from moving in the Y and Z directions, restricting their movement parallel to the chain orientation. After equilibration, one end carbon atom is held fixed, while the other is stretched until 20% strain is achieved. This process is carried out for all chain lengths and will determine the tensile strength of individual chain lengths.
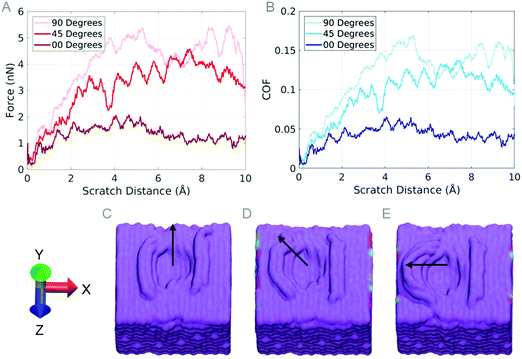
To create the bulk PTFE model, chains are oriented in a square lattice, parallel to the Z axis (Fig. 1B). The PTFE block dimensions are 99 × 55 × 108 Å3 (Fig. 1C) after equilibration. The X and Z dimensions are periodic, and the bottom two layers of PTFE chains (10 Å) are held fixed after equilibration is complete, the remaining atoms are free to move in any dimension while the indentation and scratch tests are performed. To investigate how the chain orientation affects the coefficient of friction, a spherical indenter with a radius of 25 Å is indented 10 Å into the surface of the PTFE sample, then scratched at angles of 0, 45, and 90 degrees measured from the Z axis, for a scratch length of 10 Å.
2.2 Coarse-grained modeling
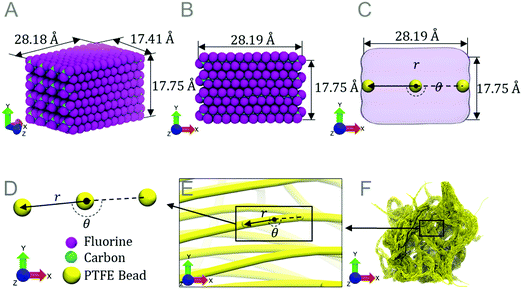
Experimental observations have shown that PTFE forms different sized and shaped particles during the annealing process.10 By developing a coarse-grained force field and model, larger length scales can be achieved than would be possible simply using molecular dynamics. Spanning larger simulation length scales allows for the investigation of micrometer-sized particles as seen in experimental work and how different shapes of these particles change the coefficient of friction.To develop the coarse-grained force field, multiple PTFE chains are configured to generate a bundle with dimensions 28.18 × 17.75 × 17.41 Å3 (Fig. 2A and B). Bundle dimensions are chosen to include the twist in PTFE chains (that is inherent to PTFE chains longer than 25 Å) and also considering the ReaxFF, which is computationally expensive using molecular dynamics. In this study, PTFE chains are placed in an ideal crystalline alignment. Each bundle is equilibrated at 300 K to allow the bundle to reach a minimum energy and orientation. The relaxed coarse-grained fibers are visually similar to experimentally observed microscale fibers.44–46 An amorphous phase can lead to change in our coarse-grained parameters especially the bending test parameters listed in Table 1.
| Simulation | Parameter description | Value | Units |
|---|---|---|---|
| Tensile test | Energy parameter (KT) | 481.07 | kcal mol−1 Å−2 |
| Equilibrium bond distance (r0) | 13.60 | Å | |
| Three point bend test | Energy parameter (KB) | 1330.82 | kcal mol−1 rad−2 |
| Equilibrium angle (θ0) | 177.31 | Degrees | |
| Equilibrium distance test | Energy well depth (ε) | 30.60 | kcal mol−1 |
| Zero-crossing distance (σ) | 23 | Å | |
| Energy cutoff (rcut) | 50 | Å |
Molecular dynamics is used to perform mechanical tests in order to calculate coarse-grained parameters from fitted energy curves. Three tests are run using the PTFE bundle model: a tensile test, a three-point bending test and an equilibrium distance test. Each simulation is performed using the ReaxFF. The purpose of the tests is to approximate the 1088 atoms in the bundle as three coarse-grained beads (Fig. 2C and D), to increase length scale capabilities by allowing multiple beads to create a fiber (Fig. 2E). A coarse-grained potential is developed to describe the bond and angle interactions between the three beads, and the interactions of multiple fibers via van der Waals forces. Multiple PTFE beads are used to create a PTFE fiber (Fig. 2E). Multiple fibers coalesce to form a micrometer sized particle (Fig. 2F) after equilibration at 300 K.
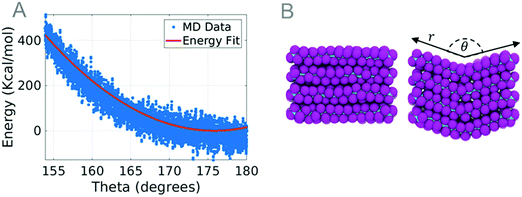
The coarse-grained parameters that describe bonding are derived from the energies of the MD simulation of a bundle under tensile stress. During the simulation, the end carbon atoms are held fixed in the Y and Z dimensions to restrict the movement of the chain. The fixed carbon atoms are then pulled at a strain rate of 0.05 ps−1 until 13% strain. The length and energy of the bundle are recorded for parameter extraction. The strain and energy of the simulation are plotted and an energy curve is fit to eqn (1).
| E = KT(r − r0)2 | (1) |
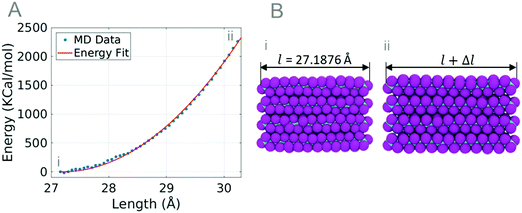 | ||
| Fig. 3 (A) Plot of MD bundle data (blue dots) and the energy fit (red line) used to create coarse-grained model parameters. The energy fit curve is fit to eqn (1) and the parameters r0 and KT are calculated. (B) Images of PTFE bundles at equilibrium length l = 27.1876 Å (i) and at 11% strain l + Δl = 30.40 Å (ii). | ||
A three-point bend test is used to describe the dihedral angles between coarse-grained beads. The end carbon atoms are held fixed in all dimensions, and the center carbon atoms are also fixed and displaced in the Y dimension at a strain rate of 0.05 ps−1. The angle of the bundle and the energy are measured and plotted, and an energy curve is fit to eqn (2).
| E = KB(θ − θ0)2 | (2) |
The van der Waals interactions in the coarse-grained model are determined by the attractive or repulsive forces from the MD simulations. The equilibrium test uses two separate completely fixed bundles parallel to one another, which are brought closer together as the simulation progresses. The distance and energy of the system are measured and plotted, and an energy curve is fit to the potential energy of the two bundles using the Lennard-Jones 12![[thin space (1/6-em)]](https://www.rsc.org/images/entities/char_2009.gif) :
:![[thin space (1/6-em)]](https://www.rsc.org/images/entities/char_2009.gif) 6 curve (eqn (3)).
6 curve (eqn (3)).
 | (3) |
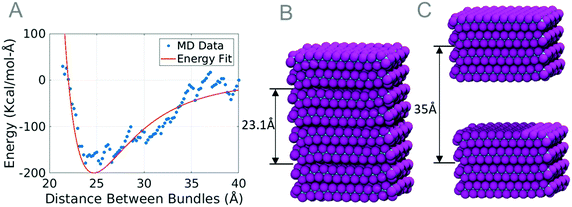 | ||
| Fig. 5 (A) Plot comparing two molecular dynamics equilibrium distance data points to the Lennard-Jones curve. Images show the bundles at distances of 23.1 Å (B) and 35 Å (C). | ||
The parameters gathered from the equilibrium distance test are those that create the best Lennard-Jones fit to the data. The energy cutoff distance rcut was chosen to be 45.65 Å, when the energy of two interacting bundles was zero. The values for the energy well depth and the zero-crossing distance were chosen to ensure that the equilibrium distance and the equilibrium energy matched the bundle simulation. Due to the thermal fluctuations in the data used to fit the Lennard-Jones curve, the coarse-grained force field may cause variation in the forces predicted. By conducting parametric studies, we have quantified the variation in forces to be up to 5 nN. The necessary parameters to model PTFE are summarized in Table 1.
A three-bead model is generated to test the coarse-grained parameters against the bundle simulations. Tensile, three point bend, and equilibrium distance tests are performed using the new coarse-grained model and potential. The results from the coarse-grained simulations recreate the MD simulation energies in terms of the coarse-grained potential.
Using the coarse-grained equilibrium distances, PTFE beads are placed into 10![[thin space (1/6-em)]](https://www.rsc.org/images/entities/char_2009.gif) 000 PTFE fibers. To create the model, 500 Å long fibers are positioned and oriented randomly. The model is set to equilibrate at 300 K for 15.6 ns. The PTFE fibers coalesce into a porous interwoven mesh, which gradually condense to a particle.
000 PTFE fibers. To create the model, 500 Å long fibers are positioned and oriented randomly. The model is set to equilibrate at 300 K for 15.6 ns. The PTFE fibers coalesce into a porous interwoven mesh, which gradually condense to a particle.
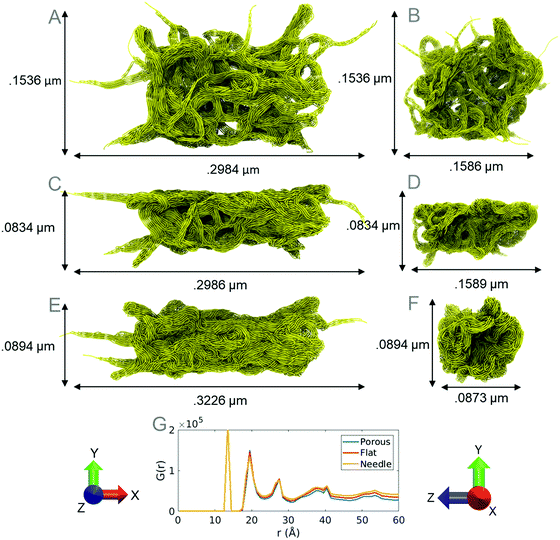
The resultant nanoparticle with an approximately spherical shape is referred to here as a porous nanoparticle (porous) (Fig. 6A & B). A flattened particle (Fig. 6C & D) with lower porosity (flat) was also generated using the LAMMPS, which is half the original height of the porous nanoparticle. Finally, a high density needle shaped (needle) particle (Fig. 6E & F) was also generated with a similar length to width ratio (3.26) as fibers found in experimental works (2.6–3.77).10 The radial distribution of atoms in each model is measured and indicates that the models are indeed different sizes and shapes of the same material with different densities (Fig. 6F). Various shapes of PTFE particles are observed in experimental literature; our particles are modeled based on the shape and size of such particles.10,47 In our studies the porous model replicates the particles observed in experiments at room temperature before annealing. We compress the porous model to different densities to generate the flat and needle particle models. The densities of the porous, flat, and needle models are 0.7376, 0.8420 and 1.0120 g cm−3, respectively, which are similar to the density of PTFE powder ranging from 0.5 to 2.0 g cm−3.47
Fibers of the equilibrated coarse-grained models were measured to be ∼10 nm in diameter. AFM images from experimental studies show PTFE fibers ranging from 400 nm to 10 nm in diameter and forming an entangled web-like structure, which is also observed in the equilibrated coarse-grained particles.46,48 Although bundle simulations use an ideal structure of PTFE to approximate the coarse-grained parameters, the coarse-grained particles contain a similar density and shape to particles observed experimentally.10,47
Indentation is performed at the same location for all particles. A purely repulsive spherical LAMMPS indenter with a diameter of 50 nm is used to indent each nanoparticle. The indentation speed was held constant at 5 m s−1 for each indenter, and an indentation depth of 10 nm was studied.
3 Results and discussion
3.1 Single chain PTFE simulations
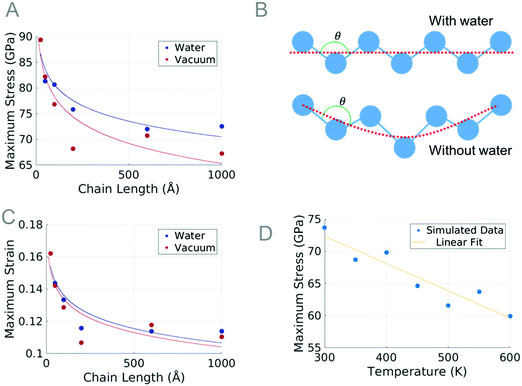
Molecular dynamics simulations on single PTFE chains study how the initial chain length affects the maximum tensile stress before the chain fails. The chains are studied in a vacuum and in a water environment, at 300 K. The results obtained from the length studies show that the chains shorter than 100 Å withstand a slightly higher stress than the others; for this reason, the 100 Å long chain was selected for the temperature study. The pulling velocity is investigated and found to have a negligible effect on the mechanical properties of atomistic PTFE chains.PTFE is known to have a torsion angle of approximately 162.5 degrees.52,53 At equilibrium, the carbon backbone of PTFE gradually rotates under the torsion angle; however, we observe at a length of 21.3 Å (with 20 carbon atoms) a twist occurring in the chain. Chains with more than 20 carbon atoms all are observed to have at least one twist at equilibrium. During the tensile test, the dihedral angles slowly unravel, the bond angles increase, and the bond lengths stretch. Failure ultimately occurs when the bond between carbon atoms stretches too far. Chains with a twist are observed to have an extra phase where the twist is unraveled before the bond lengths or bond angles increase. Once the twist has straightened, the dihedrals, bond angles, and bond lengths increase simultaneously just as observed in the chains without the twist. This explains the variation of modulus values.
The maximum stress for longer chains decreases as the length of the chain increases, but appears to plateau at a length of 100 Å. A similar phenomenon was observed in polyyne carbyne where smaller length chains were also reported to have a higher strength.54,55 The dependency the maximum strength of the chain has on length can be explained by the high axial strain energy for shorter chains, as well as the increase in the probability that longer chains will break due to the increased number of bonds.
Water has been observed to increase the maximum strength of polyyne, but through a very different mechanism.55 In PTFE, water is able to prevent the chain from excessive movement in the Y or Z direction. The chain with water, being hindered in two dimensions, is able to withstand a greater stress because the shape of the chain is more unified in the direction of the tensile load. An illustration of a chain under tensile load with water can be seen in Fig. 9B; the stabilizing effects are apparent when compared to the chain without water. While in both illustrations in Fig. 9B, the length of the PTFE chain is the same, the actual length between individual carbon bonds is greater in the chain without water. This increase in bond distance causes a greater stress on each atom in the chain, which is what ultimately causes the chain to fail. This increase in bond distance is what ultimately causes the chain to fail.
3.2 Nanoscale indentation and scratch simulations
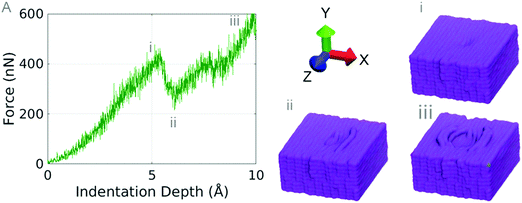
In order to predict the frictional properties, a bulk PTFE model is indented 10 Å using an indenter with a radius of 25 Å. After indentation, scratch tests are performed at three different scratch angles: 0 degree, 45 degrees, and 90 degrees parallel to the chain orientation (Z axis).No chains are observed to break during indentation and the chain displacement phenomena occurred on both the first and second layers of PTFE. The maximum tensile stress a single chain of PTFE can withstand is approximately 80 GPa (Fig. 8A); we see that the maximum force sustained by the bulk PTFE model is 400 nN before chains protrude from the surface of the PTFE. Dividing the maximum force before deformation by the approximate contact area of the indenter (πr2), the contact pressure on the bulk PTFE is 20.37 GPa. The chains slip around the indenter at the same pressure as they would break under tensile stress. Because PTFE chains have an intrinsically low adhesion to each other, it is easy to separate the chains during indentation without significant damage to the PTFE surface.8 This allows for the chains to separate without breaking and to deform away from the indenter.
The elastic modulus of the bulk PTFE was found by computing stress by dividing the normal force by the contact area of the indenter, and a strain by computing the compressive strain on the center of the PTFE sample. The elastic modulus during indentation is 80.23 GPa for the first 5% strain. Experimental studies on thin film PTFE have been conducted by investigating the thickness effect of PTFE on the elastic modulus, showing that decreasing the film size greatly increases the elastic modulus of the film. While no direct comparison is available, the smallest PTFE film tested by Wang et al. had a thickness of 48.1 nm and an elastic modulus of 12 GPa, whereas our film thickness is 5.5 nm and our film has an elastic modulus of 80.23 GPa.57
A scratch angle of 90 degrees (perpendicular to the chain orientation) shows a major deformation of the chains. Pile-up occurs (Fig. 10(iii)) as the indenter moves through the surface of the PTFE, and the chains behind the indenter remain relatively motionless. During the scratch test, the sections of chains in the path of the indenter cause pile-up. While the chains are forced out of their initial positions, the ends of the chains cannot remain connected to the neighboring chains. The ends of the chains slip past the neighboring fluorine atoms, causing a drop in the force–displacement graph (Fig. 11A), and the coefficient of friction graph (Fig. 11B). The large drop occurring around 6 Å occurs when a chain is displaced from the surface of the PTFE, seen as the top chain in Fig. 11E.
The results for a scratch angle of 45 degrees show a mixture between the 0 and 90 degree scratch angles. Chains in front of the indenter path have a low resistance to indentation and will deform to allow the indenter to pass over them, but are eventually displaced similar to the 90 degree scratch. Pile-up was not observed for the length of the scratch at 45 degrees. Similar to the 90 degree scratch, sudden decreases in the force–displacement graphs are caused by the slipping of chains past neighboring chains. Unlike the 90 degree scratch angle, the chains are never displaced far enough to cause a chain to completely detach from the surface.
From the observations of these results, we can conclude that the polymer orientation during scratch is much less resistant when the chains are oriented in the same direction as the indenter direction. This result is supported by Barry et al. who investigated the sliding directions of PTFE sheets.33 The PTFE sheets were observed to break and some chains reoriented based on the sliding direction. Frictional forces reported by Barry et al. range from 2.1 to 10.7 nN, well within the values found in this work.33
The coefficient of friction values for the 90 degree scratch average to 0.15. The 45 degree scratch shows values of 0.1, while the 0 degree scratch averages to 0.05. Previously reported values of the coefficient of friction for PTFE fall between 0.1 and 0.16 during the initial sliding of PTFE.9,20 The coefficient of friction values reported in this work support the values found in the experimental work of bulk PTFE during the initial sliding of a scratch test. During scratch, experimental studies observe a decrease in the coefficient of friction, after the initial scratch has begun, which may be a result of chains reorienting to the scratch direction.10
3.3 Coarse-grained model indentation and scratch
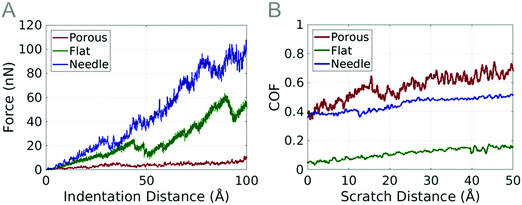
We perform indentation and scratch studies on coarse-grained particles (flat, needle and porous) to predict their frictional properties. They are the common geometries of PTFE found at the microscale and can affect the frictional properties of PTFE coating.The flat particle shows a much greater resistance to the indenter than the porous particle. As the indenter begins to penetrate the surface of the flat particle, the compression of the fibers begins immediately. Due to the high density, the fibers cannot compress much further and the force begins to increase. Sudden drops in the force–displacement graph occur when support columns or groups of fibers slip past other support columns or fibers. The flattened particle undergoes a shearing similar to the porous model; unlike the porous particle, most of the flat particle support columns are oriented horizontally due to the compression used to create the flat surface. The lower half of the particle is more porous than the top half, and is mainly responsible for the shear visible in the particle during the scratch.
The force measured during the indentation of the needle particle was larger in magnitude than the force measured on any of the other particles. The indenter contacts the particle surface on top of a raised segment of the particle. Drops in the force–displacement plot again correspond to the slipping of support columns past other columns in the model (Fig. 2F). Because the density of the needle particle is slightly higher than that of the flat particle, the drops in force are not high, as the support columns have less space to slip into.
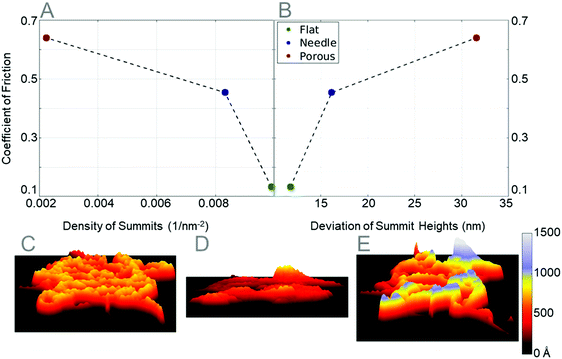
The coefficient of friction of the flat particle steadily increases from 0.03 to 0.20 (Fig. 12B). Small fluctuations in the coefficient of friction are seen at 40 Å scratch distance, which are caused by shear deformation in the particle. Three more scratch tests were performed at 10 Å intervals where the coefficient of friction values range from 0.05 to 0.2. The additional scratch tests provide evidence that the coefficient of friction varies depending on the surface topography. The density of summits for the flat particle is 9.903 × 10⁻³ nm−2 and the deviation of summit heights is 11.17 nm. The flat particle has the highest density of summits and the lowest deviation of summit heights. These localized peaks help reduce friction, as less material is able to come into contact with the indenter during the scratch test.
The needle particle has a high coefficient of friction similar to the porous particle. Three additional scratch tests were performed at 10 Å intervals. The coefficient of friction values range from 0.35 to 0.5 during the additional scratch tests. The density of summits for the needle particle is 8.325 × 10⁻⁵ nm−2 and the deviation of summit height is 16.16 nm.
The coefficient of friction plotted in Fig. 12B is calculated by running one scratch down the center of the particles. To estimate an error of these values, three more tests were performed on the flat and needle particles, scratching horizontal to the first scratch at intervals of 10 Å. The average coefficients of friction for the flat, needle, and porous particles are 0.1324, 0.4351, and 0.6392, respectively. The reported coefficient of friction values for the PTFE film during micrometer length scratch tests range from 0.15 to 0.20, which are slightly higher than the coefficient of friction values for the flattened particle.59 The attributes of the particles that govern the coefficient of friction values are the density of summits and the deviation of summit heights. As can be seen in Fig. 13A, the higher the density of summits, the lower the coefficient of friction. The summit deviation also plays a big role in lowering the coefficient of friction (Fig. 13B); as the deviation of summit height decreases, the coefficient of friction also decreases.
The porous particle had the lowest summit density and the highest deviation of summit height. The porous particle is modeled after the spherical particles are seen before annealing a PTFE film. The porous particle takes a rather spherical shape, which allows the PTFE fibers to stay as straight as possible and bend the least number of times. The needle particle has a much higher density than the porous particle, causing the PTFE fibers to bend to fit more particles in a smaller area. The bending and buckling of fibers cause an increase in summit density, and a decrease in the deviation of summit height. The compression of the porous particle increases the density of summits by forcing the relatively straight PTFE fibers to form a dense straight edge on the surface of the flat particle. This dense edge of the flat particle is compressed to the same height, therefore decreasing the deviation of summit heights.
4 Conclusions
We investigated single PTFE chain strength and found that the length of the chain does not affect the strength of the PTFE chain except for very short chains. Adding water strengthens the PTFE chain, while the pulling rate does not affect the maximum stress of the chain. Increasing the temperature of the chain decreases the tensile strength of the PTFE chain.We also studied nanoindentation of compact PTFE on the nanoscale using molecular dynamics. We observed that PTFE chains slip around the indenter after 5 Å indentation depth, which is equal to the depth of one layer of PTFE chains, or 400 nN force. PTFE chains resisted scratch much greater when the scratch direction was perpendicular to the chain orientation, resulting in the deformation of the PTFE surface.
We generated a bundle of PTFE chains to derive the coarse-grained potential for microscale PTFE. Three different particle shapes were investigated, the porous, flattened, and needle, modeled after experimental observations of PTFE particles. We observed that PTFE tends to form relatively straight fibers, which gather to create a porous interwoven mesh. The maximum strength of PTFE particles tested using the coarse-grained force field was 60 nN before severe deformation occurred, approximately 6 times weaker than the results of PTFE on the nanoscale using the ReaxFF.
Indentation on the porous nanoparticle using the coarse-grained model showed the least resistance to indentation, while the flattened particle showed a greater resistance, and the needle particle showed the greatest resistance to indentation. Each model had slightly greater density than the last, suggesting that the greater the density of the particle the more resistant to indentation the particle will be. The deformation of each of these particles was similar, showing that the deformation of an individual particle is based on the internal structure of the particle, not just the surface topography or the shape.
Scratch tests performed on the three micrometer sized particles show how the surface topography, shape, and density of a particle will affect the coefficient of friction. The value of the coefficient of friction is affected mainly by the density and height deviation of peaks in the particle. The coefficient of friction is the highest when the particle has a low density of summits, and a high deviation of summit height. The coefficient of friction values for the coarse-grained models range from 0.13 to 0.64, while the reported experimental coefficient of friction values range from 0.1 to 0.37,8,21 and accepted numerical simulations at the nanoscale range from 0.1 to 0.6.4,33
The generation of the coarse-grained model and potential allows for the modeling of PTFE on a microscale, reaching length scales that have not previously been possible. The results obtained from indentation and scratch tests performed on the coarse-grained PTFE model show that high density and even surface roughness create PTFE particles with the lowest coefficient of friction. Further investigations of micrometer sized PTFE particles can illuminate phenomena seen in PTFE thin films, such as adhesion mechanisms, interaction with filler particles, and the effects of fiber length, thus paving the way for modeling of more realistic PTFE surfaces. The studies outlined here will enhance the possibilities of PTFE for multi-disciplinary applications.
Conflicts of interest
There are no conflicts to declare.Acknowledgements
We sincerely thank the Center for Advanced Surface Engineering under the National Science Foundation Grant No. OIA-1457888 and the Arkansas EPSCoR Program, ASSET III, Funding for this research. The authors would like to acknowledge the support in part from the National Science Foundation under grants ARI#0963249, MRI#0959124 and EPS#0918970, and a grant from the Arkansas Science and Technology Authority, managed by the Arkansas High Performance Computing Center.References
- H. Sui, H. Pohl, U. Schomburg, G. Upper and S. Heine, Wear and friction of PTFE seals, Wear, 1999, 224, 175–182 CrossRef CAS.
- P. Klinkert, P. Post, P. Breslau and J. Van Bockel, Saphenous vein versus PTFE for above-knee femoropopliteal bypass. A review of the literature, Eur. J. Vasc. Endovasc. Surg., 2004, 27, 357–362 CrossRef CAS PubMed.
- D. L. Burris and W. G. Sawyer, Tribological sensitivity of PTFE/alumina nanocomposites to a range of traditional surface finishes, Tribol. Trans., 2005, 48, 147–153 CrossRef CAS.
- K. L. Harris, A. A. Pitenis, W. G. Sawyer, B. A. Krick, G. S. Blackman, D. J. Kasprzak and C. P. Junk, PTFE tribology and the role of mechanochemistry in the development of protective surface films, Macromolecules, 2015, 48, 3739–3745 CrossRef CAS.
- L. M. T. Debies and G. Takacs, Adhesion of copper to poly(tetrafluoroethylene) surfaces modified with vacuum UV radiation downstream from He and Ar microwave plasmas, Polym. Surf. Modif.: Relevance Adhes., 2004, 3, 139 Search PubMed.
- R. J. Plunkett, The history of polytetrafluoroethylene: discovery and development, Springer, 1986 Search PubMed.
- D. Flom and N. Porile, Friction of Teflon Sliding on Teflon, J. Appl. Phys., 1955, 26, 1088–1092 CrossRef CAS.
- R. King and D. Tabor, The effect of temperature on the mechanical properties and the friction of plastics, Proc. Phys. Soc., London, Sect. B, 1953, 66, 728 CrossRef.
- K. R. Makinson and D. Tabor, The friction and transfer of polytetrafluoroethylene, The Royal Society, 1964 Search PubMed.
- S. Beckford, L. Mathurin, J. Chen, R. A. Fleming and M. Zou, The effects of polydopamine coated Cu nanoparticles on the tribological properties of polydopamine/PTFE coatings, Tribol. Int., 2016, 103, 87–94 CrossRef CAS.
- X.-X. Liu, T.-S. Li, X.-J. Liu, R.-G. Lv and P.-H. Cong, An investigation on the friction of oriented polytetrafluoroethylene (PTFE), Wear, 2007, 262, 1414–1418 CrossRef CAS.
- T. Blanchet and F. Kennedy, Sliding wear mechanism of polytetrafluoroethylene (PTFE) and PTFE composites, Wear, 1992, 153, 229–243 CrossRef CAS.
- G. Deli, X. Qunji and W. Hongli, Study of the wear of filled polytetrafluoroethylene, Wear, 1989, 134, 283–295 CrossRef.
- M. Conte, B. Pinedo and A. Igartua, Role of crystallinity on wear behavior of PTFE composites, Wear, 2013, 307, 81–86 CrossRef CAS.
- S.-Q. Lai, L. Yue, T.-S. Li and Z.-M. Hu, The friction and wear properties of polytetrafluoroethylene filled with ultrafine diamond, Wear, 2006, 260, 462–468 CrossRef CAS.
- T. Blanchet, F. Kennedy and D. Jayne, XPS analysis of the effect of fillers on PTFE transfer film development in sliding contacts, Tribol. Trans., 1993, 36, 535–544 CrossRef CAS.
- G. De-Li, Z. Bing, X. Qun-Ji and W. Hong-Li, Effect of tribochemical reaction of polytetrafluoroethylene transferred film with substrates on its wear behaviour, Wear, 1990, 137, 267–273 CrossRef.
- K. Tanaka, Y. Uchiyama and S. Toyooka, The mechanism of wear of polytetrafluoroethylene, Wear, 1973, 23, 153–172 CrossRef CAS.
- D. L. Burris, Effects of nanoparticles on the wear resistance of polytetrafluoroethylene, University of Florida, 2007 Search PubMed.
- D. L. Burris and W. G. Sawyer, Improved wear resistance in alumina-PTFE nanocomposites with irregular shaped nanoparticles, Wear, 2006, 260, 915–918 CrossRef CAS.
- Y. Shi, X. Feng, H. Wang, C. Liu and X. Lu, Effects of filler crystal structure and shape on the tribological properties of PTFE composites, Tribol. Int., 2007, 40, 1195–1203 CrossRef CAS.
- S. Beckford, L. Mathurin, J. Chen and M. Zou, The influence of Cu nanoparticles on the tribological properties of polydopamine/PTFE+ Cu films, Tribol. Lett., 2015, 59, 11 CrossRef.
- S. Beckford and M. Zou, Wear resistant PTFE thin film enabled by a polydopamine adhesive layer, Appl. Surf. Sci., 2014, 292, 350–356 CrossRef CAS.
- W. G. Sawyer, K. D. Freudenberg, P. Bhimaraj and L. S. Schadler, A study on the friction and wear behavior of PTFE filled with alumina nanoparticles, Wear, 2003, 254, 573–580 CrossRef CAS.
- A. A. Pitenis, K. L. Harris, C. P. Junk, G. S. Blackman, W. G. Sawyer and B. A. Krick, Ultralow wear PTFE and alumina composites: it is all about tribochemistry, Tribol. Lett., 2015, 57, 4 CrossRef.
- J. Ye, H. Khare and D. Burris, Quantitative characterization of solid lubricant transfer film quality, Wear, 2014, 316, 133–143 CrossRef CAS.
- T. A. Blanchet, S. S. Kandanur and L. S. Schadler, Coupled effect of filler content and countersurface roughness on PTFE nanocomposite wear resistance, Tribol. Lett., 2010, 40, 11–21 CrossRef CAS.
- V. Aderikha, A. Krasnov, V. Shapovalov and A. Golub, Peculiarities of tribological behavior of low-filled composites based on polytetrafluoroethylene (PTFE) and molybdenum disulfide, Wear, 2014, 320, 135–142 CrossRef CAS.
- G. Jintang and D. Hongxin, Molecule structure variations in friction of stainless steel/PTFE and its composite, J. Appl. Polym. Sci., 1988, 36, 73–85 CrossRef.
- B. A. Krick, J. J. Ewin, G. S. Blackman, C. P. Junk and W. G. Sawyer, Environmental dependence of ultra-low wear behavior of polytetrafluoroethylene (PTFE) and alumina composites suggests tribochemical mechanisms, Tribol. Int., 2012, 51, 42–46 CrossRef CAS.
- S. Chen, J. Wang, T. Ma and D. Chen, Molecular dynamics simulations of wetting behavior of water droplets on polytetrafluorethylene surfaces, J. Chem. Phys., 2014, 140, 114704 CrossRef PubMed.
- S. J. Heo, I. Jang, P. R. Barry, S. R. Phillpot, S. S. Perry, W. G. Sawyer and S. B. Sinnott, Effect of the sliding orientation on the tribological properties of polyethylene in molecular dynamics simulations, J. Appl. Phys., 2008, 103, 083502 CrossRef.
- P. R. Barry, P. Y. Chiu, S. S. Perry, W. G. Sawyer, S. B. Sinnott and S. R. Phillpot, Effect of temperature on the friction and wear of PTFE by atomic-level simulation, Tribol. Lett., 2015, 58, 50 CrossRef.
- E. Herbold, J. Cai, D. Benson and V. Nesterenko, Particle size effect on strength, failure, and shock behavior in polytetrafluoroethylene-Al-W granular composite materials, AIP, 2007 Search PubMed.
- J. A. Elliott, D. Wu, S. J. Paddison and R. B. Moore, A unified morphological description of Nafion membranes from SAXS and mesoscale simulations, Soft Matter, 2011, 7, 6820–6827 RSC.
- J. T. Wescott, Y. Qi, L. Subramanian and T. Weston Capehart, Mesoscale simulation of morphology in hydrated perfluorosulfonic acid membranes, J. Chem. Phys., 2006, 124, 134702 CrossRef PubMed.
- D. Wu, S. J. Paddison, J. A. Elliott and S. J. Hamrock, Mesoscale modeling of hydrated morphologies of 3M perfluorosulfonic acid-based fuel cell electrolytes, Langmuir, 2010, 26, 14308–14315 CrossRef CAS PubMed.
- M. J. Buehler, Mesoscale modeling of mechanics of carbon nanotubes: self-assembly, self-folding, and fracture, J. Mater. Res., 2006, 21, 2855–2869 CrossRef CAS.
- R. Mirzaeifar, Z. Qin and M. J. Buehler, Mesoscale mechanics of twisting carbon nanotube yarns, Nanoscale, 2015, 7, 5435–5445 RSC.
- A. C. Van Duin, S. Dasgupta, F. Lorant and W. A. Goddard, ReaxFF: a reactive force field for hydrocarbons, J. Phys. Chem. A, 2001, 105, 9396–9409 CrossRef CAS.
- S. K. Singh, S. G. Srinivasan, M. Neek-Amal, S. Costamagna, A. C. van Duin and F. Peeters, Thermal properties of fluorinated graphene, Phys. Rev. B: Condens. Matter Mater. Phys., 2013, 87, 104114 CrossRef.
- S. Plimpton, Fast parallel algorithms for short-range molecular dynamics, J. Comput. Phys., 1995, 117, 1–19 CrossRef CAS.
- W. Humphrey, A. Dalke and K. Schulten, VMD: visual molecular dynamics, J. Mol. Graphics, 1996, 14, 33–38 CrossRef CAS.
- F. S. Gill, S. Chandra, V. Panwar, D. Uniyal, G. Kalra, V. Kumar and P. Garg, Conduction pathways in CNF/PTFE composite: air oxidized CNFs coated with the incomplete layer of PTFE, Diamond Relat. Mater., 2018, 89, 227–238 CrossRef CAS.
- M. Inayoshi, M. Hori, T. Goto, M. Hiramatsu, M. Nawata and S. Hattori, Formation of polytetrafluoroethylene thin films by using CO2 laser evaporation and XeCl laser ablation, J. Vac. Sci. Technol., A, 1996, 14, 1981–1985 CrossRef CAS.
- S. Xiong, L. Kong, Z. Zhong and Y. Wang, Dye adsorption on zinc oxide nanoparticulates atomic-layer-deposited on polytetrafluoroethylene membranes, AIChE J., 2016, 62, 3982–3991 CrossRef CAS.
- V. R. Weidner and J. J. Hsia, Reflection properties of pressed polytetrafluoroethylene powder, J. Opt. Soc. Am., 1981, 71, 856–861 CrossRef CAS.
- D. L. Burris and W. G. Sawyer, A low friction and ultra low wear rate PEEK/PTFE composite, Wear, 2006, 261, 410–418 CrossRef CAS.
- T. Shimanouchi, M. Asahina and S. Enomoto, Elastic moduli of oriented polymers. I. The simple helix, polyethylene, polytetrafluoroethylene, and a general formula, J. Polym. Sci., 1962, 59, 93–100 CrossRef CAS.
- F. Bartha, F. Bogar, A. Peeters, C. Van Alsenoy and V. Van Doren, Density-functional calculations of the elastic properties of some polymer chains, Phys. Rev. B: Condens. Matter Mater. Phys., 2000, 62, 10142 CrossRef CAS.
- M.-L. Zhang, M. Miao, A. Peeters, C. Van Alsenoy, J. Ladik and V. Van Doren, LDA calculations of the Young's moduli of polyethylene and six polyfluoroethylenes, Solid State Commun., 2000, 116, 339–343 CrossRef CAS.
- M. D'Amore, G. Talarico and V. Barone, Periodic and high-temperature disordered conformations of polytetrafluoroethylene chains: an ab initio modeling, J. Am. Chem. Soc., 2006, 128, 1099–1108 CrossRef PubMed.
- D. Holt and B. Farmer, Modeling of helix reversal defects in polytetrafluoroethylene: I. Force field development and molecular mechanics calculations, Polymer, 1999, 40, 4667–4672 CrossRef CAS.
- A. Nair, S. Cranford and M. Buehler, The minimal nanowire: mechanical properties of carbyne, EPL, 2011, 95, 16002 CrossRef.
- R. Mirzaeifar, Z. Qin and M. J. Buehler, Tensile strength of carbyne chains in varied chemical environments and structural lengths, Nanotechnology, 2014, 25, 371001 CrossRef PubMed.
- P. Rae and E. Brown, The properties of poly(tetrafluoroethylene) (PTFE) in tension, Polymer, 2005, 46, 8128–8140 CrossRef CAS.
- J. Wang, F. Shi, T. Nieh, B. Zhao, M. Brongo, S. Qu and T. Rosenmayer, Thickness dependence of elastic modulus and hardness of on-wafer low-k ultrathin polytetrafluoroethylene films, Scr. Mater., 2000, 42 Search PubMed.
- B. Bhushan, Introduction to tribology, John Wiley & Sons, 2013 Search PubMed.
- H. Unal, A. Mimaroglu, U. Kadıoglu and H. Ekiz, Sliding friction and wear behaviour of polytetrafluoroethylene and its composites under dry conditions, Mater. Des., 2004, 25, 239–245 CrossRef CAS.
| This journal is © the Owner Societies 2019 |

