 Open Access Article
Self-assembly of fluoride-encapsulated polyhedral oligomeric silsesquioxane (POSS) nanocrystals†
Ellen
Heeley
 *a,
Youssef
El Aziz
a,
Christopher
Ellingford
 b,
Albina
Jetybayeva
a,
Chaoying
Wan
 b,
Eleanor
Crabb
 a,
Peter G.
Taylor
 *a and
Alan
Bassindale
a
aFaculty of Science, Technology, Engineering and Mathematics, Open University, Walton Hall, Milton Keynes, MK7 6AA, UK. E-mail: Ellen.Heeley@open.ac.uk; Peter.Taylor@open.ac.uk
bInternational Institute of Nanocomposites Manufacturing (IINM), WMG, University of Warwick, CV4 7AL, UK
First published on 1st December 2018
Abstract
The self-assembly and crystal packing of a unique series of nanocrystalline fluoride ion-encapsulated polyhedral oligomeric silsesquioxane (F-POSS) compounds, with substituted electron-withdrawing group (EWG) perfluorinated alkyl chain arms of varying lengths, were investigated. The fluorine-encapsulated T8[(CH2)n-EWG]8F−-18-crown-6-ether-M+ and T8[(CH2)n-EWG]8F−-tetrabutyl ammonium TBA+ compounds with fluorinated alkyl chain arms were synthesized and subsequently analyzed using differential scanning calorimetry (DSC), thermogravimetric analysis (TGA) and simultaneous small- and wide-angle X-ray scattering (SAXS/WAXS) techniques. DSC and TGA of the compounds showed that the melting temperatures occurred below 100 °C and the compounds were thermally stable above their melting temperatures. SAXS/WAXS data probed the crystalline structure and self-assembly of the nanocrystalline compounds. At ambient temperatures, the crystalline structures of the compounds were seen to be complex with triclinic unit cells. On cooling from the melt, the self-assembly of the compounds with shorter fluorinated alkyl chain arms is dominated by the ionic attraction between the cages such that the arms form a disordered state that only reorder on standing. In contrast, the self-assembly of the compounds with longer fluorinated alkyl chain arms is dominated by the alignment of the arms into rod-like morphologies such that a fully ordered solid is formed from the melt. Electrical characterization has revealed that the POSS cages exhibited an insulating behavior. The POSS cages with or without fluoride ion encapsulation had similar AC conductivities but cages without fluoride ion encapsulation have the highest relative permittivity. The results show that due to the inorganic–organic-ionic nature of the F-POSS ion encapsulated compounds and nanocrystalline self-assembly, they have great potential as interfacial compatibilizers enhancing the miscibility of polymer composites and aiding interactions between polar and non-polar solvents as ionic liquids.
1. Introduction
Polyhedral oligomeric silsesquioxanes (POSS) are cage-like nanosized building blocks with the general formula (RSiO3/2)n, usually abbreviated as RnTn, where the organic substituents attached to the silicon–oxygen cage-like core can have a wide variety of functionality and high thermal stabilities.1–3 The most common POSS cages are the cubic silsesquioxanes, that is, the T8 cages, which have the formula (RSiO3/2)8.4,5 Recently, we have synthesised and characterised a series of POSS compounds where a fluoride ion becomes entrapped inside the cage.6–8 Along with Haddad and coworkers,9 we found that the presence of strongly electron-withdrawing groups on the alkoxysilanes, EWG-(CH2)n-Si(OEt)3 (where n = 1–3 and the electron-withdrawing group EWG contains an Si–Csp3 bond), facilitates the formation and encapsulation of the fluoride anion in a silsesquioxane cage, where the counter ion is tetrabutylammonium (TBA+) or crown ether-M+ (Fig. 1).10,11 In the unit cell, each cage-encapsulated fluoride ion is associated with the counter ion where the packing depends upon the most efficient space filling arrangement of the cation and anion depending upon the nature of the arms attached to the cage.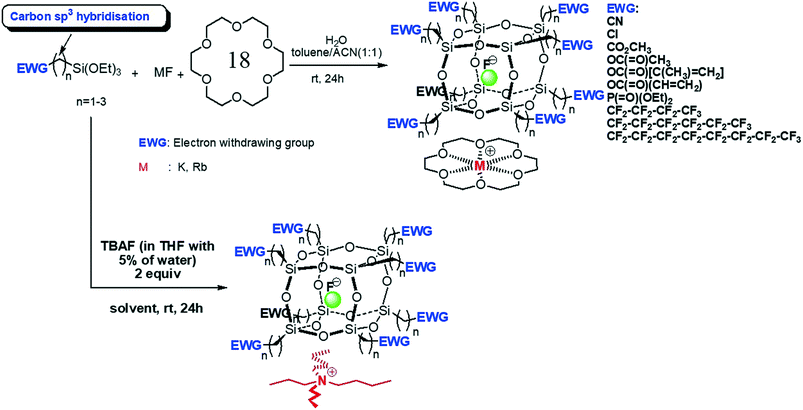 | ||
| Fig. 1 Synthetic route to T8[EWG-(CH2)n]8F−-crown ether-M+ or T8[EWG-(CH2)n]8F TBA+.10,11 | ||
The tetrabutylammonium species shows only ionic interactions between the charged species. However, in the metal/crown ether species the single crystal X-ray diffraction-determined structures have demonstrated the presence of a 1D and a 2D polymeric assembly of T8[(CH2)n-EWG]8F−-18-crown-6-M+ (where M+ is K+ or Rb+) with linkages via the electronegative group of the EWG and the cation via the free face of the crown ether complex.
The electrostatic interactions between charged groups and van der Waals forces of the organic chains attached to the POSS cage can influence the structure and bulk properties of the materials. The attractive forces between the cation and the anion fall off with distance as the cages prevent any intimate contact; however, we are interested in how the ionic nature of these compounds influences their nanocrystalline self-assembly. We have carried out similar studies in the past examining how the length of the alkyl arm attached to the cage affects the nature of the crystalline packing in the solid state.12–14 With long arms (>C6) the molecules form rod-like nanocrystalline structures. The molecules pack together efficiently, stacking in a lamellar or bilayer fashion with no interdigitation of one molecule with another. Further studies on the miscibility and dispersion of long n-alkyl chained substituted POSS compounds when blended with polyethylene (PE), showed that the miscibility and dispersion of the POSS moieties in the PE matrix increased as the n-alkyl-chain arm length increased. The POSS moieties also acted as nucleating agents for the crystallization of the polymer matrix.15,16
Here, we report on the thermal and small- and wide-angle X-ray scattering (SAXS/WAXS) studies of the heating and cooling of these unique F-POSS encapsulated compounds to investigate how the order and nanocrystalline packing morphology change with temperature. In addition, we have also investigated the electrical properties and thus the relative importance of coulombic interactions in these compounds. In this instance we have synthesized a series of POSS cages with perfluorosubstituted arms having varying chain lengths as the electron-withdrawing group, the anion F− being encapsulated inside the POSS cage and complexing cations of 18-crown ether-M+ or TBA+. The SAXS/WAXS data have given insight into the self-assembly and nanocrystalline packing of the POSS compounds and TGA/DSC has shown how the Tm is reduced significantly compared with that of the non-fluorine-encapsulated POSS compounds. The electrical characterization has also shown that the synthesized POSS cages with and without fluoride ion encapsulation have similar AC conductivities but that the cages without fluoride ion encapsulation have the highest relative permittivity of up to 40 at 106 Hz.
Hence, the results presented here show how these F-encapsulated POSS systems have the potential for further applications in aiding interactions between polar and non-polar solvents and as inert ions in electrochemical methods. Also, due to their molecular ionic organic–inorganic interfacial nature they are attractive nanofillers for polymer materials, improving stability and electrical conduction, as well as enhancing the compatibilization and miscibility of nanocomposite materials.
2. Experimental
2.1 Materials
Encapsulated fluoride ion (F−)/POSS compounds were prepared using tetrabutylammonium fluoride with the appropriate perfluoroalkyltrialkoxysilane.10 The corresponding metal/crown ether compounds were prepared in a similar fashion using the metal fluoride salt, the crown ether and the appropriate perfluoroalkyltrialkoxysilane.11 The perfluoroalkyl POSS compounds without fluoride entrapment were synthesized according to Mabry et al.17 All compounds obtained from the synthesis were white crystalline solids at room temperature.The perfluoroalkyl arms T8[CH2CH2(CF2)nCF3] used were chosen with n = 3, 6, 8 and 10, and are denoted as TBAFC3, TBAFC6. TBAFC8 and TBAFC10; similarly, compounds prepared with 18-crown-6-K+ and the same fluorinated alkyl arms are denoted as CrownC3, CrownC6, CrownC8 and CrownC10; POSS cages T8 without any F− ion encapsulation, but with the same fluorinated alkyl arms, are denoted as C3, C6 and C8 herein.
2.2 Thermal analysis
Differential scanning calorimetry (DSC) was performed on the samples using a Mettler Toledo DSC1 Stare system. The samples underwent heating–cooling cycles from room temperature to beyond their melting points at a rate of 10 °C min−1. The melting temperatures (Tm) and crystallization temperatures (Tc), were obtained from the DSC thermograms. Isothermal crystallizations were performed on the Crown C6 and C8 samples at 50, 55 and 60 °C, where the samples were heated to above the Tm and then quenched at 50 °C min−1 to the isothermal crystallization temperature and held for 60 minutes.Thermogravimetric analysis (TGA) was carried out using a Mettler Toledo TGA1 Stare system under a flow of nitrogen (100 cm3 min−1). Samples were prepared by adding a mass of between 5 and 10 mg into 70 μl alumina pans. The samples were then heated from 25 °C to 450 °C at 10 °C min−1.
2.3 Electrical characterization
Impedance measurements were carried out using a Princeton Applied Research Parstat MC with a PMC-2000 card and a two-point probe between 103 and 106 Hz on the powdered sample at 20 °C.2.4 Synchrotron X-ray measurements
Small- and wide-angle X-ray scattering (SAXS/WAXS) measurements were performed on the XMaS (BM28) beamline at the European Synchrotron Radiation Facility (ESRF),18 France, and SAXS measurements on beamline I22 of the Diamond Light Source Synchrotron, UK.19 Both had an X-ray beam energy of 12.0 keV. At XMaS (BM28, ESRF), SAXS and WAXS data were collected on a 2D MAR-CCD detector calibrated with silver behenate. For SAXS, a chamber flushed with helium was positioned between the sample position and the detector reducing air scattering and absorption with a length of 1500 mm. The sample-to-detector distance was 340 mm for WAXS. Samples were sealed in aluminium DSC pans fitted with mica windows (25 μm thickness, 7 mm Ø) and housed in a Linkam DSC600 heating stage which was positioned vertically in the incident X-ray beam before the SAXS chamber. Static 2D SAXS and WAXS data were collected for 10 s at a temperature of 30 °C. Time-resolved SAXS/WAXS data were obtained for the heating and cooling of samples. Samples were heated to temperatures above their melting points at a rate of 10 °C min−1 and held at this temperature for 60 s, then cooled at 10 °C min to 30 °C. The SAXS/WAXS data collection was obtained throughout the heat–cool process at a rate of 10 s per frame.At I22 (Diamond Light Source), SAXS data was recorded using a Pilatus P3-2M detector located at a distance of 3300 mm from the sample position. An evacuated chamber reducing air scattering was positioned between the sample and detector. The detector was calibrated using dry collagen. Samples were housed in a Linkam DSC and similar heat–cool experimental protocols and SAXS detection frame rates were used as described above.
2.5 SAXS/WAXS data analysis
SAXS and WAXS data were normalized for sample thickness, transmission and background scattering. X-ray data reduction and analysis was performed using CCP13 FibreFix20 and DAWN21,22 software packages. Both 2D SAXS/WAXS data were reduced to 1D scattering profiles of intensity (I) versus scattering vector (q), where q = (4π/λ) sin (θ), 2θ is the scattering angle and λ is the X-ray wavelength, by sector averaging around the beam stop by a fixed angle and radius, q. The SAXS data peak positions (Dmax) were determined by the relationship Dmax = 2π/q.3. Results and discussion
3.1 Thermal analysis of the POSS compounds
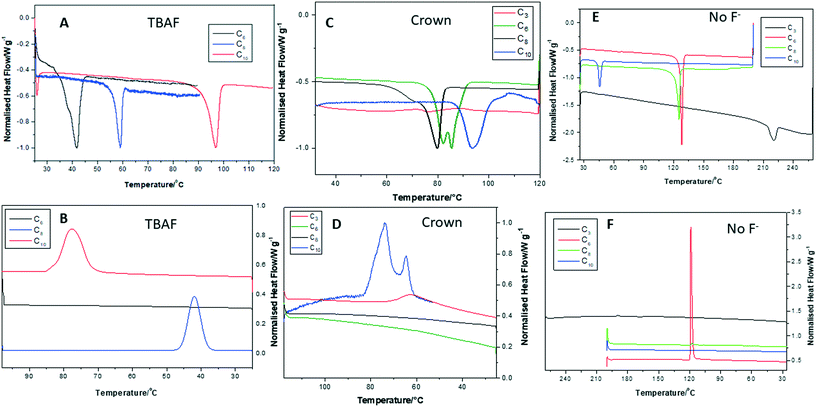
The DSC thermograms for all compounds were recorded during the heat–cool cycles at 10 °C min−1 and are shown in Fig. 2. The data presented here are from the first heat–cool cycle. This was done to investigate the initial reordering and recrystallization processes occurring in the samples and how on further heating–cooling cycles over a period of time samples recrystallize (discussed later in this section). Table 1 collates the melting temperature Tm and crystallization temperatures Tc from the DSC thermograms. In Fig. 2A and B, the heat–cool thermograms for the TBAF compounds are shown. The high melting point of TBAFC3 compared to the other POSS–TBAF compounds has been attributed to complex Si–F symmetrical contacts on packing.8 However, as the fluorinated alkyl chain arm length increases from C6 to C10 the Tm is seen to increase again. This trend has also been seen in T8 POSS compounds with long linear alkyl arms and is attributed to increasing molecular weight of the alkyl chains, greater intermolecular forces and crystalline ordering of the arms.12,14,23 For TBAFC6 a shoulder is seen on the broad melting peak that can be ascribed to melting or reordering of different crystalline fractions. As the fluorinated alkyl arm length increases the melting peak becomes less broad and no shoulder is observed, indicating the melting of one type of well-ordered crystal fraction. Similarly, on cooling (Fig. 2B), the Tc values decrease with decreasing arm length and TBAFC6 shows no obvious recrystallization or reordering of a crystalline phase. For the crown compounds (Fig. 2C), again the Tm mainly increases with increasing fluorinated alkyl arm length, but the melting peak is broader as the arm length increases, indicating a less well-ordered crystalline structure. CrownC6 shows a double melting peak similarly to TBAFC6.| Compound | T m/°C | T c/°C |
|---|---|---|
| TBAFC3 | 143 | — |
| TBAFC6 | 40.3 | — |
| TBAFC8 | 58.9 | 42.1 |
| TBAFC10 | 96.3 | 77.6 |
| CrownC3 | 78.9 | 63.0 |
| CrownC6 | 82.2 (85.2) | — |
| CrownC8 | 81.2 | — |
| CrownC10 | 94.1 | 73.9 (64.7) |
| C3 | 221.0 | — |
| C6 | 128.1 | 118.9 |
| C8 | 125.3 | 117.8 |
| C10 | 46.0 | — |
On cooling, CrownC10 shows a double crystallization peak which can be attributed to either two different crystalline fractions recrystallizing and reordering in the compound or reordering of the POSS molecules and then the ionic component at different temperatures. CrownC8 and CrownC6 do not show any crystalline structure reoccurring on cooling, whereas CrownC3 gives a broad recrystallization peak. Fig. 2E and F show a comparison of melting and crystallization behavior in the POSS cages with fluorinated alkyl arms, but without any F− ion encapsulation. Here, an opposite effect is seen, where as the fluorinated alkyl arm length increases the Tm decreases. Similar results have been reported for fluoroalkyl functionalized POSS compounds, which are attributed to the minimization of van der Waals interactions between the POSS–POSS cores.24,25
In Table 1, the value of Tm reported for the C3 fluorinated POSS compound shows a very high but broad melting point of 221 °C. Similarly, Mabry et al.17 reported a high Tm for this compound between 234 and 237 °C. Hence, where short fluorinated alkyl arms are attached to the POSS core the Tm is dominated by POSS–POSS interactions and so is raised significantly.
The data in Table 1 and Fig. 2 confirm that the F−-encapsulated POSS–crown and POSS–TBAF compounds have low melting points (mainly below 100 °C analogous to ILs26–33), in comparison to the POSS compounds without F− ion encapsulation, whereas the Tm values increase with increasing fluorinated alkyl chain arm length. This suggests improved packing density as the arm length increases and the reduction (greater isolation) of ionic interaction between the F− ion and the cation. On cooling from the melt, recrystallization occurs in the POSS–TBAF compounds when the fluorinated alkyl chain arm length is ≥C8, indicating that the increasing alkyl chain arm length drives the reassembly of crystalline arrangement of the molecules. However, the shorter POSS arm lengths (C6) show a less ordered packing density and on cooling go to a disordered state, which may reorder over time.
The POSS–crown compounds with alkyl chain arm lengths of C10 show a reordering on cooling of two distinct, crystalline fractions; this could suggest the self-assembly of the ionic network and then the POSS alkyl chain arms. However, CrownC8 and CrownC6 show no initial recrystallization on cooling and so are assumed to be in a disordered state. The crystalline packing in the POSS compounds without any F− ion encapsulation returns on cooling;this self-assembly is driven by the fluorinated alkyl chain arms. As the arm length increases a rod-like assembly has been observed for both fluoroalkyl functionalized POSS and n-alkyl-substituted nanocrystalline POSS cages.12,13
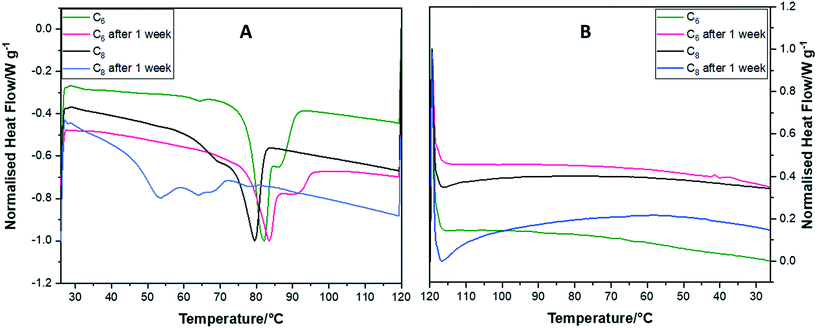
To investigate the crystalline reordering of the CrownC6 and CrownC8 samples, we heated and cooled the same samples a week apart in the DSC. Fig. 3A shows the heating thermograms of the samples where both CrownC6 and CrownC8 show that melting occurs on the first run and then again a week later. The melting peaks are broader after a week, indicating that full reordering into the initial crystalline state does not completely occur. For CrownC6, the main Tm peak occurs at a similar temperature: first run 82 °C, second run (one week later) at 83 °C. For CrownC8, the first run Tm is 79 °C, and on the second run this is reduced to 53 °C, again showing that reordering of the crystalline state occurs over time but is less ordered compared with the first run.
Fig. 3B shows the re-cooling process; for both crown samples, again we observe that in the first run no reordering of a crystalline state occurs. However, the crystalline state does reorder over time (as observed in the heating cycle after a week). The re-cooling of the crown samples after a week shows once again that the crystalline state does not return immediately. Hence, heating and cooling the same crown samples a week apart does verify that the reordering into a crystalline state occurs but is a slow kinetic process. To confirm this, we performed isothermal DSC runs on the samples (see thermograms in Fig. S1 in the ESI†), where they were initially melted and quenched to crystallization temperatures of 50, 55 and 60 °C, and then kept at this temperature for 60 minutes to establish if any recrystallization occurs at constant temperature below Tm. However, all the isothermal crystallization thermograms were flat, indicating that no obvious reordering or recrystallization occurred.
To investigate the thermal stability of the POSS F-encapsulated compounds in comparison to those without F− ion encapsulation, TGA was performed on the samples when heating to 450 °C. Example TGA curves are shown in Fig. 4.
 | ||
| Fig. 4 TGA curves of (A) POSS compounds without F− ion encapsulation, (B) TBAF compounds and (C) crown compounds. | ||
In Fig. 4A, the onset of sublimation temperature (Ts) for POSS compounds without F− ion encapsulation ranges from 240 to 350 °C and is a one-step process.12 The highest value of Ts is observed for the C3 compound and as the fluorinated alkyl chain arm length increases the Ts is seen to decrease. This can be attributed to the increased POSS–POSS cubic core interactions being enhanced due to the short-fluorinated alkyl chain arms, thus limiting the thermal motion of the arms compared to longer chain arm lengths. Fig. 4B and C show the TGA curves for TBAF and crown compounds, respectively, which have multiple decomposition processes. The initial decomposition temperatures (Td) for TBAFC6 and CrownC3 have values of 160 and 170 °C, respectively. The decomposition process in these compounds has been attributed to the weight loss of the TBAF or 18-crown cation. This is then followed by a second decomposition process of the weight loss of the fluorinated alkyl chain arms.11 For the TBAF compounds, increasing the fluorinated alkyl chain arm length gives increased values of Td. Hence, here the increased arm length, and assumed packing, gives greater stability of the compounds. This is also mirrored in the Tm values which increase with increasing fluorinated alkyl chain arm length. Hence, the POSS F− ion encapsulated compounds show good thermal stability beyond their low meting points.
3.2 Self-assembled packing structure of POSS samples characterized by X-ray scattering techniques
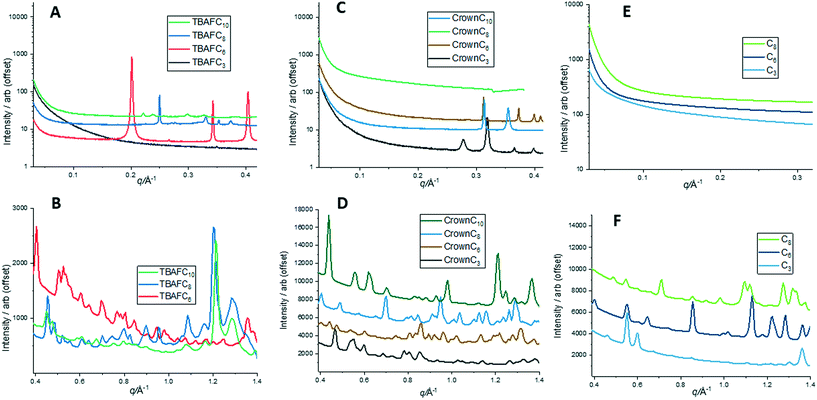
To investigate the crystalline structure and molecular packing of the compounds further, static 2D SAXS/WAXS patterns were taken at 30 °C. Fig. S2 in the ESI† shows the individual 2D SAXS/WAXS data from all samples tested. However, in order to obtain a better view of the scattering data and linked dimensions, 1D profiles were taken for the SAXS and WAXS data. The 1D SAXS/WAXS profiles obtained from the 2D data (Fig. S2†) are given in Fig. 5.In Fig. 5, the 1D SAXS and WAXS profiles are quite complex certainly for the TBAF and crown compounds, showing many peaks in all cases. The high number of peaks in the WAXS profiles usually indicates a complex unit cell and for these compounds, it is reasonable to assume that they all have triclinic unit cells, as reported in our previous single crystal X-ray work8,10,11 for TBAF and crown compounds where single crystals could be obtained. For POSS without F− ion encapsulation compounds, triclinic crystalline unit cells have also been reported17 from single crystal analysis for these compounds.
Table S1 in the ESI† collates the major SAXS/WAXS peak distances from the 1D profiles in Fig. 5. For TBAFC3, single crystal X-ray data were previously reported,8 where the triclinic unit cell had the following dimensions: a = 14.5 Å, b = 15.9 Å, c = 16.7 Å, α = 93.2° β = 108.9°, γ = 114.6°. Similarly, single crystal X-ray analysis of CrownC3 gave a triclinic unit cell11 with dimensions a = 9.5 Å, b = 12.4 Å, c = 14.2 Å, α = 67.5°, β = 89.0°, and γ = 85.4°. Comparing the two crystal unit cells, CrownC3 is generally smaller than TBAFC3; this can be attributed to contraction of the Si8O12 cage framework10,11 and the greater ionic nature of CrownC3, having more of a point charge structure compared with TBAFC3.
The general self-assembled molecular packing of TBAFC3 and CrownC3 is shown in Fig. 6, with dimensions relating to single crystal X-ray analysis (see Fig. S3 in the ESI† for unit cell projection on molecular packing diagrams).8,11
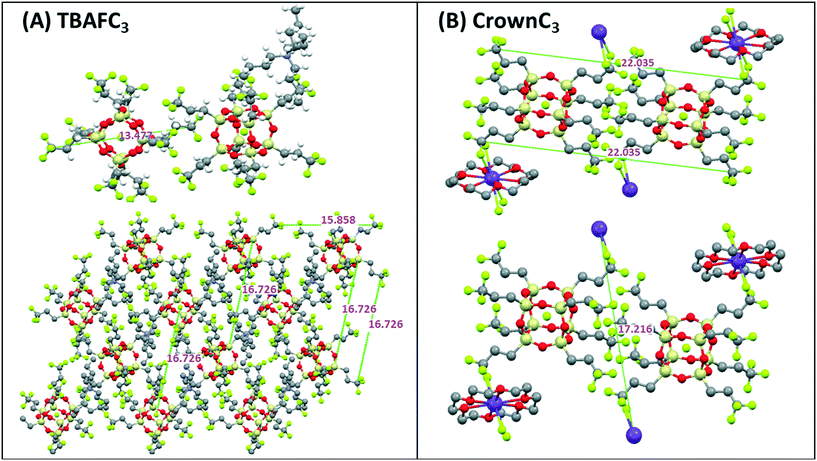 | ||
| Fig. 6 Self-assembled molecular packing diagrams of (A) TBAFC3 and (B) CrownC3 compounds including dimensions (in Å) obtained from signal crystal X-ray analysis.8,11 | ||
For TBAFC3, major SAXS peaks are seen at ∼13.5 Å, correlating to the molecular length scale of the molecule, and at 15.8 Å and 16.7 Å, which correlates with the unit cell dimensions and molecular packing of the molecule in Fig. 6A. As previously reported, the crystal packing of the TBAFC3 compound shows complex Si–F interactions with neighbouring POSS molecules and the fluorinated alkyl chains tend to spread out around the POSS cage giving a star or disk-like packing morphology.8,12 Similarly, for CrownC3, the major SAXS peaks at ∼22.6 Å and ∼17.2 Å (Table S1 in the ESI,†), are correlated to the molecular length scales and packing depicted in Fig. 6B. Here, the molecular packing is more ordered, and expanded nanoscale network structures are seen as the crown ether cation acts as a linkage between the POSS cages.
Fig. 7 shows the molecular self-assembled packing and associated dimensions for both TBAFC6 and CrownC6 systems. Again, some of the packing distances in TBAFC6 such as 32.5 Å, 18.8 Å and 12.5 Å can be correlated to the SAXS and WAXS data in Table S1 in the ESI,† as well as single crystal unit cell dimensions. For CrownC6, single crystal data of the triclinic unit cell had dimensions of a = 13.6 Å, b = 14.6 Å, c = 14.9.7 Å, α = 69.6° β = 83.1°, γ = 61.9° (see Fig. S4 in the ESI† for unit cell projection on molecular packing diagrams).8,11
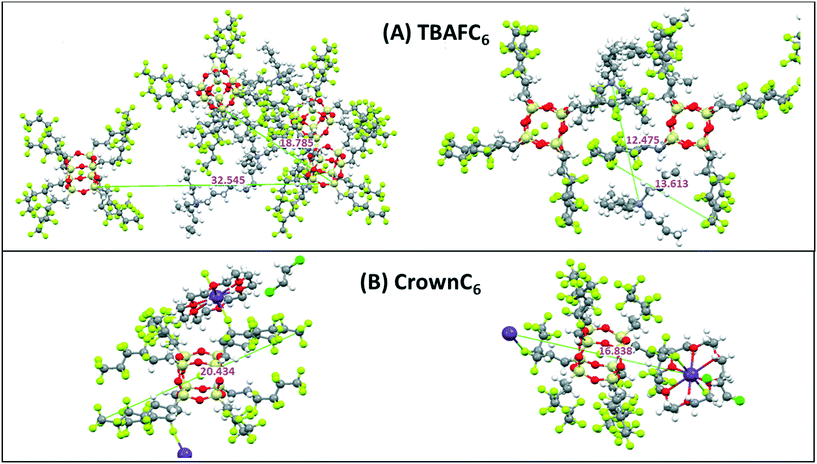 | ||
| Fig. 7 Molecular packing diagrams of (A) TBAFC6 and (B) CrownC6 compounds including dimensions (in Å) obtained from signal crystal X-ray analysis.8,11 | ||
The POSS core–core distance is seen as 32.5 Å and the TBA+ cation-to-cation distance is 12.5 Å. For CrownC6, molecular packing distances at 20.4 Å and 16.8 Å again correspond to similar distances from SAXS/WAXS data in Table S1.† The molecular length scale is 20.4 Å and the diagonal crown K+⋯K+ is 16.8 Å (as previously reported from single crystal X-ray analysis8). As before, the crown ether compounds tend to form regular 1D and 2D polymeric nanocrystalline packing networks, via the cation linkages, which is not as evident in the TBAF compounds. An example of the 2D polymeric network packing (from single crystal X-ray analysis11) in CrownC3 and CrownC6 compounds is shown in Fig. 8. The packing diagrams with unit cell projections are also shown in the ESI,† Fig. S3 and S4. Generally, from the data in Table S1,† the length scales of the molecular packing are smaller in the POSS–crown than the POSS–TBAF compounds, which again is due to the point change nature of the molecular ionic structure allowing closer ionic associations, whereas the POSS–TBAF compounds have a more distributed ionic charge, and ionic associations are not so strong.
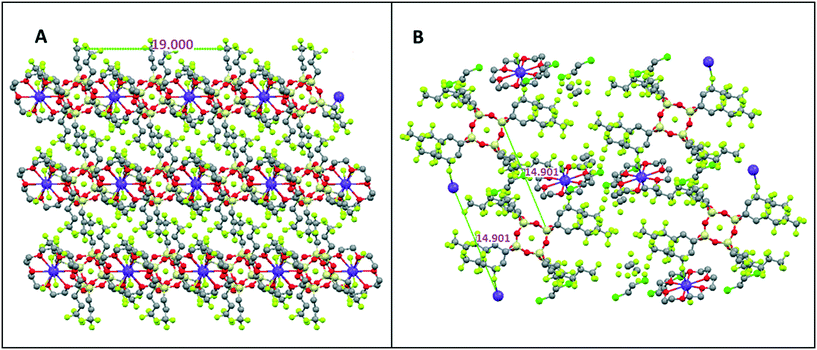 | ||
| Fig. 8 2D polymeric network packing in (A) CrownC3 and (B) CrownC6 compounds from single crystal X-ray packing analysis.11 | ||
Fig. 9 shows a comparison of molecular packing and associated dimensions in the POSS compounds with fluorinated alkyl chain arms but no F− encapsulation. In Fig. 9A1 and A2, the molecular structure and packing of the C3 are shown, respectively. The fluorinated alkyl chain arms radiate out from the POSS cage core to give a symmetrical star- or disk-shaped molecule; the packing shows long-range Si⋯F interactions, close POSS–POSS cage interaction and interdigitation of the arms. This packing affords the high melting temperature of this compound. As the fluorinated alkyl chain arms increase in length from C6 to C8 (Fig. 9B and C), the molecular structure changes and the arms point away from the POSS cage around a face in a rod-like geometry. The molecules then pack in layers or a lamellar type of morphology where the POSS–POSS cage interaction decreases with increasing arm length. The packing is now dominated by the self-assembly of the fluorinated alkyl chain arms and held together by van der Waals interactions, and thus the melting temperature is significantly reduced. Similar packing is seen in POSS substituted long n-alkyl chain compounds.12,14
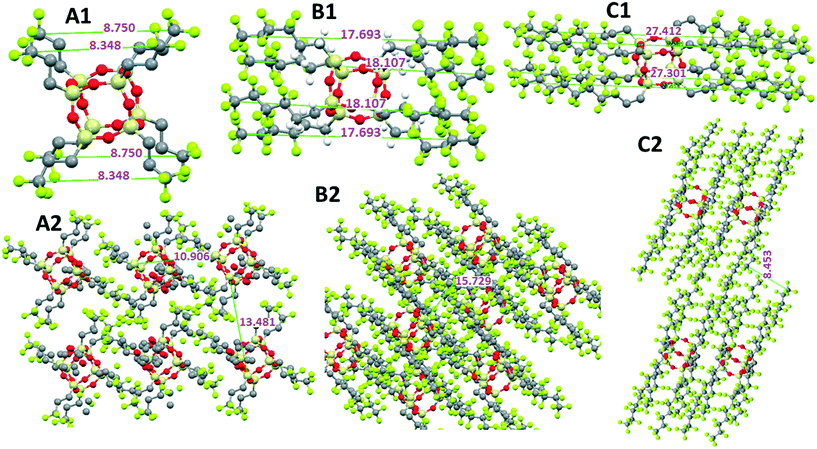 | ||
| Fig. 9 Estimated molecular dimensions and packing scenarios of POSS with fluorinated alkyl chain arms: (A1 and A2) C3 arm length, (B1 and B2) C6 arm length and (C1 and C2) C8 arm length. | ||
From the DSC data (Table 1 and Fig. 2 and 3), we saw that on re-cooling from the melt, the crystalline structure in some of the POSS–TBAF and POSS–crown compounds did not immediately return, and these were likely to be in a disordered state. To investigate the return of the self-assembled nanocrystalline structure in the compounds SAXS data were obtained during the DSC heating–cooling process.
Fig. 10 shows a selection of the heat–cool 1D SAXS profiles for TBAFC8, TBAFC10 and CrownC10. In Fig. 10A, the major SAXS peaks for TBAFC8 gradually disappear on heating and are gone at 61 °C. Hence, the crystalline packing structure has disordered and melted for the compound (at Tm ∼59 °C). On cooling (Fig. 10B), a small peak at q ∼ 0.3 Å−1 (length scale of 21 Å) in the SAXS profiles returns at a temperature of <42 °C, which indicates that some reordering of the crystalline structure occurs; however, the structure is less ordered than before the melt and the length scale is likely to be the repeat distance of the TBAFC8 molecule with a rod-like geometry. Similarly, Fig. 10C and D show the heat–cool SAXS profiles for TBAFC10. Again, the SAXS peaks disappear on heating at 96 °C (Tm of TBAFC10 is ∼96 °C) and reappear on cooling by ∼60 °C. The three major peaks in the SAXS all reappear on cooling where the peak at q ∼ 0.22 Å−1 (length scale of 28 Å) will correlate again to the TBAFC10 molecular length scale where ordering occurs in a rod-like geometry. Fig. 10E and F show the heat–cool SAXS profiles of CrownC10. Disorder and melting occur at 94 °C (Tm of CrownC10 is 94 °C) and on cooling major peaks return, where the peak at q ∼ 0.31 Å−1 (length scale of 20 Å) is likely to represent the molecular reordering packing length scale. For CrownC3, similar disorder–reordering of crystalline structure is observed from the SAXS peaks during heating and cooling (see Fig. S5 in the ESI†).
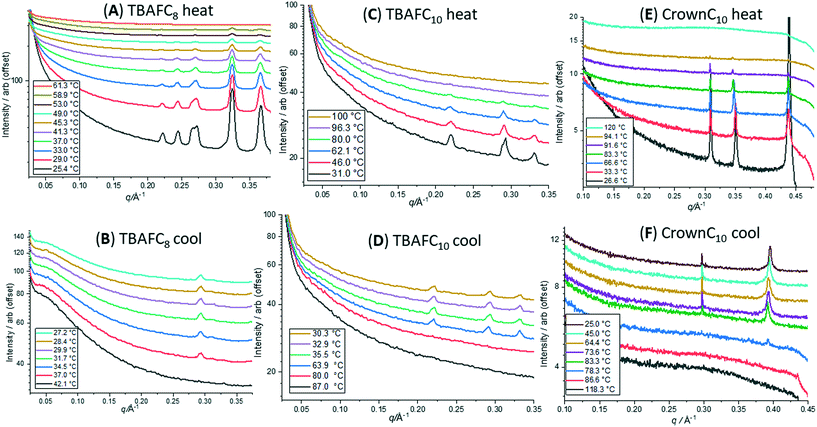 | ||
| Fig. 10 Heat–cool 1D SAXS profiles. (A and B) TBAFC8; (C and D): TBAFC10; (E and F) CrownC10. Profiles are offset on the vertical axis for clarity. | ||
The SAXS profiles for the three compounds TBAFC8, TBAFC10 and CrownC10 (Fig. 10) show that the crystalline structure reorders and returns on cooling, although they may not be as well ordered before heating due to the lack of SAXS peaks. In contrast, as seen in the DSC data (Fig. 2 and 3, Table 1), the crystalline structure does not return on cooling for some of the compounds, such as TBAFC6, CrownC6 and CrownC8; this is also confirmed in the SAXS/WAXS profiles during the heating–cooling of these compound as the crystalline peaks all disappear on heating above their melting points but do not return (see SAXS/WAXS heat–cool data in Fig. S6–S9 in the ESI†). It should also be noted that the crystalline structure returns on cooling for the POSS compounds without F− ion encapsulation (see Fig. S10 and S11 in the ESI†); this indicates that the molecular ordering and packing as shown in Fig. 9 is restored. From the DSC (Fig. 3) and SAXS/WAXS data, the lack of crystalline structure returning on cooling (from above the melting points) in TBAFC6, CrownC6 and CrownC8 confirms the disordered nature of these compounds (reordering several days later), whereas the crystalline structure returns on cooling for the TBAFC8, TBAFC10 and CrownC10.
3.3 Electrical properties of POSS compounds.
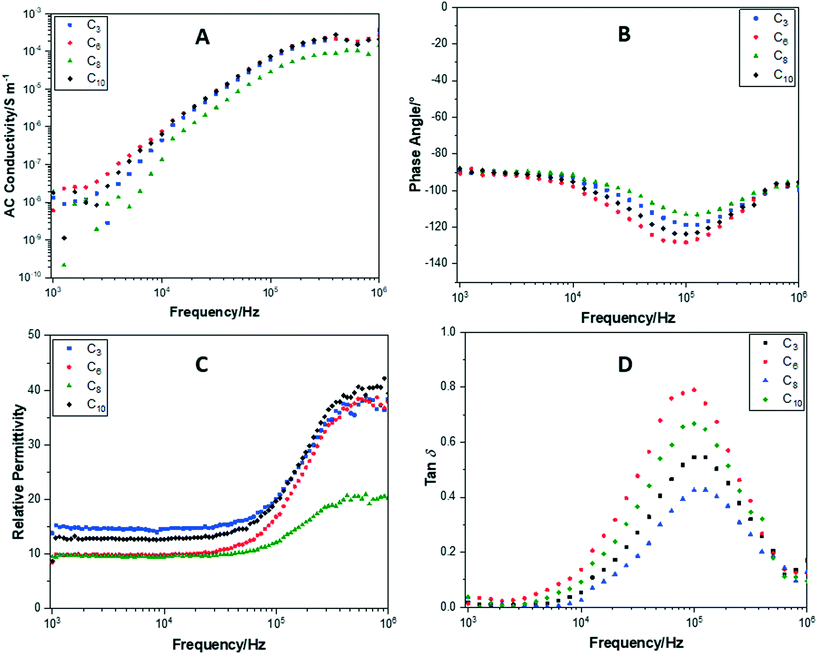
Impedance measurements for POSS cages without F− ion encapsulation, with F−ion encapsulation and TBAF or crown cation, revealed significant differences in their behaviours. Fig. 13 shows plots of conductance, phase angle, relative permittivity and tan![[thin space (1/6-em)]](https://www.rsc.org/images/entities/char_2009.gif) δ, performed over a frequency sweep range of 103–106 Hz, for POSS with fluorinated alkyl chain arms (without F− ion encapsulation). In Fig. 11A, all samples exhibited very similar relative AC conductivities at 103 Hz and 106 Hz of 1 × 10⁻⁸ S m−1 and 1 × 10⁻⁴ S m−1, respectively. Increasing the polar side-chain arm length to C6, C8 or C10 did not result in a significantly higher conductivity compared to C3. All of the cages maintain a phase angle of approximately −90° (Fig. 11B), demonstrating that these compounds remain insulating throughout the frequency sweep.
δ, performed over a frequency sweep range of 103–106 Hz, for POSS with fluorinated alkyl chain arms (without F− ion encapsulation). In Fig. 11A, all samples exhibited very similar relative AC conductivities at 103 Hz and 106 Hz of 1 × 10⁻⁸ S m−1 and 1 × 10⁻⁴ S m−1, respectively. Increasing the polar side-chain arm length to C6, C8 or C10 did not result in a significantly higher conductivity compared to C3. All of the cages maintain a phase angle of approximately −90° (Fig. 11B), demonstrating that these compounds remain insulating throughout the frequency sweep.
The relative permittivity (Fig. 11C) was also elucidated from the impedance measurements and showed a greater diversity between the compounds. The C3 POSS cage showed the highest relative permittivity of 13.8 at 103 Hz, attributed to a higher packing density of the cages increasing the capacitance. The C6, C8 and C10 cages all showed a very similar relative permittivity of 8.5, 9.5 and 8.7, respectively. As the frequency is increased, the relative permittivity of the cages increased dramatically. At 106 Hz, this was between 37 and 40 for C3, C6 and C10. A smaller increase in relative permittivity to 20 was observed for C8. Overall, this increase demonstrates that the capacitance of the compounds increased at higher frequencies probably due to the alignment of the fluoride alkyl chain arms under the increased frequency of the electric field and the inability of the POSS cages to respond to the alternating frequency.
All of the compounds show a large tan![[thin space (1/6-em)]](https://www.rsc.org/images/entities/char_2009.gif) δ loss at 105 Hz (Fig. 11D), the same region at which the relative permittivity begins to increase. This supports the suggestion that the increase in capacitance is due to an alignment of the fluoride arms and the inability to respond to the electric field frequency.
δ loss at 105 Hz (Fig. 11D), the same region at which the relative permittivity begins to increase. This supports the suggestion that the increase in capacitance is due to an alignment of the fluoride arms and the inability to respond to the electric field frequency.
In comparison, Fig. 12 shows plots of conductance, phase angle, relative permittivity and tan![[thin space (1/6-em)]](https://www.rsc.org/images/entities/char_2009.gif) δ, performed over a frequency sweep range of 103–106 Hz, for TBAFC10. This compound has a remarkably similar AC conductivity to that of the C10 POSS cage without F− ion encapsulation (Fig. 11A). The only obvious difference is that there is a sharp decrease in the AC conductivity at 7 kHz by several orders of magnitude, followed by its recovery. This drop is attributed to the fluoride ion entrapment and restriction of movement of the TBAF cation by the side chain arms on the POSS cages. The phase angle (Fig. 12B) shows that TBAFC10 remains insulating across the entire frequency range.
δ, performed over a frequency sweep range of 103–106 Hz, for TBAFC10. This compound has a remarkably similar AC conductivity to that of the C10 POSS cage without F− ion encapsulation (Fig. 11A). The only obvious difference is that there is a sharp decrease in the AC conductivity at 7 kHz by several orders of magnitude, followed by its recovery. This drop is attributed to the fluoride ion entrapment and restriction of movement of the TBAF cation by the side chain arms on the POSS cages. The phase angle (Fig. 12B) shows that TBAFC10 remains insulating across the entire frequency range.
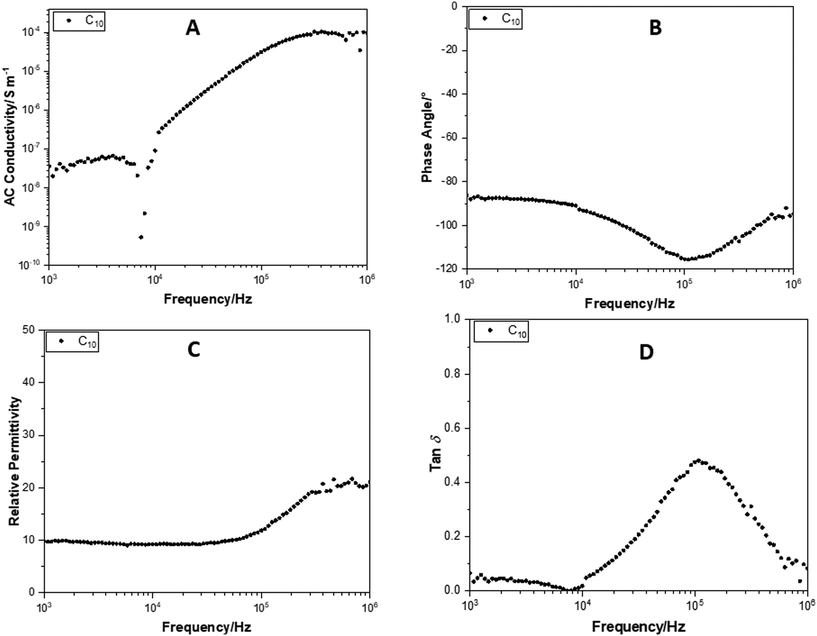 | ||
Fig. 12 Change in (A) AC conductance, (B) phase angle, (C) relative permittivity and (D) tan![[thin space (1/6-em)]](https://www.rsc.org/images/entities/char_2009.gif) δ, over a frequency sweep range of 103–106 Hz, for TBAFC10. δ, over a frequency sweep range of 103–106 Hz, for TBAFC10. | ||
The relative permittivity for TBAFC10 is 9.9 at 103 Hz (Fig. 12C), a small improvement compared to the C10 POSS cage without F− ion encapsulation. The relative permittivity increased to 21 at 106 Hz. In Fig. 12D, tan![[thin space (1/6-em)]](https://www.rsc.org/images/entities/char_2009.gif) δ also showed the same decrease at 7 kHz as that observed in the AC conductivity. The peak at 105 Hz is also observed for the alignment transition of the fluoride alkyl chain arms on the cage.
δ also showed the same decrease at 7 kHz as that observed in the AC conductivity. The peak at 105 Hz is also observed for the alignment transition of the fluoride alkyl chain arms on the cage.
When the cation is changed to crown ether, the compounds still exhibit the same decrease in AC conductivity at specific frequencies; this varies based on the side arm length of the cage. Fig. 13 shows plots of conductance, phase angle, relative permittivity and tan![[thin space (1/6-em)]](https://www.rsc.org/images/entities/char_2009.gif) δ, performed over a frequency sweep range of 103–106 Hz, for CrownC3, CrownC6 and CrownC8 compounds.
δ, performed over a frequency sweep range of 103–106 Hz, for CrownC3, CrownC6 and CrownC8 compounds.
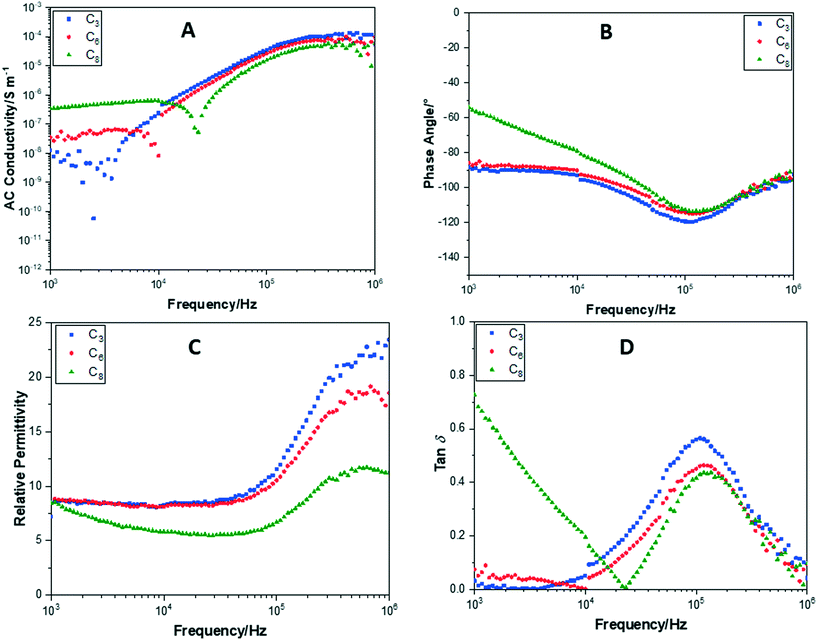 | ||
Fig. 13 Change in (A) AC conductance, (B) phase angle, (C) relative permittivity and (D) tan![[thin space (1/6-em)]](https://www.rsc.org/images/entities/char_2009.gif) δ, over a frequency sweep range of 103–106 Hz, for CrownC3, CrownC6 and CrownC8 compounds. δ, over a frequency sweep range of 103–106 Hz, for CrownC3, CrownC6 and CrownC8 compounds. | ||
For the CrownC3 cage, this drop off in conductivity (Fig. 13A) occurs at 2.5 kHz for CrownC6 at 10 kHz and for CrownC8y at 23 kHz. This again supports the premise that this peak is caused by the counter ion no longer able to respond to the frequency of the electric field and shows that it is affected by the fluorinated alkyl chain arm length. The shorter fluorinated alkyl chain arm length on the POSS cages means that they are able to pack closer together and thus the counter ion movement is inhibited at a lower frequency. With increasing fluorinated alkyl chain arm length, the POSS cages are packed less densely so the counter ion is able to move more freely until higher frequencies. Interestingly, CrownC8 compound shows a more conductive nature as the phase angle (Fig. 13B) of this cage shows a deviation from 90° towards 103 Hz, and a higher AC conductivity by one order of magnitude compared to the other crown compounds.
The relative permittivity (Fig. 13C) was similar at 103 Hz at 7.2, 8.5 and 8.5 for CrownC3, CrownC6 and CrownC8 compounds. This increased for all crown compounds at higher electric field frequencies. However, for the conducting CrownC8 compound, the increase was only to 11.3. This is due to the conductive nature of CrownC8, preventing charge from being stored as a capacitor. Finally, tan![[thin space (1/6-em)]](https://www.rsc.org/images/entities/char_2009.gif) δ (Fig. 13D) for the crown compounds shows the same behaviour as that observed for a TBAFC10. Tan
δ (Fig. 13D) for the crown compounds shows the same behaviour as that observed for a TBAFC10. Tan![[thin space (1/6-em)]](https://www.rsc.org/images/entities/char_2009.gif) δ drops dramatically at the same frequencies as observed in the AC conductivity, attributed to the restriction of counter ion movement. In addition, a similar peak at 105 Hz is observed as with the TBAFC10 and POSS cages without F− ion encapsulation.
δ drops dramatically at the same frequencies as observed in the AC conductivity, attributed to the restriction of counter ion movement. In addition, a similar peak at 105 Hz is observed as with the TBAFC10 and POSS cages without F− ion encapsulation.
3.4 Overall summary of results
The driving-force for the self-assembled nanocrystalline reordering is the increasing length of the fluorinated alkyl chain arms in these compounds. These will tend to separate and align (increasing rod-like geometry), and thus the packing density is efficient. The compounds with shorter fluorinated alkyl chain arms tend not to reorder on cooling; this is due to the lack of efficient packing of the POSS. Here, the ions may tend to assemble ‘freezing’ in the disorder before the fluorinated alkyl chain arms can assemble and pack efficiently, although this reordering and crystalline structure does return over time (being a slow kinetic process). Hence, these compounds tend to fall into two distinct assembly patterns, those which self-assemble into a regular nanocrystalline morphology due to the efficient packing of the fluorinated alkyl chain arms, and those where the ionic assembly is favoured and the fluorinated alkyl chain arms tend to be disordered. The potential ionic liquid nature of the compounds with F− ion encapsulation is also confirmed with the decreasing melting temperatures (below 100 °C), in comparison to the POSS cages with no F− ion encapsulation, which have higher melting points. The ionic packing and self-assembled structures in the TBAF compounds are less complex, due to their distributed charge, than the crown compounds, which have a more point-like charge in the molecules. Finally, the electrical characterization revealed that the POSS cages all exhibited an insulating behaviour with a typical conductivity of 1 × 10⁻⁸ S m−1 at 103 Hz, except for CrownC8, which showed a higher conductivity. Overall, the relative permittivity was highest for the POSS cages without F− ion encapsulation. Encapsulation of the F− ion appeared to reduce the compounds' capacitance behaviour due to a lower relative permittivity. Tan![[thin space (1/6-em)]](https://www.rsc.org/images/entities/char_2009.gif) δ shows a peak at 105 Hz for all compounds, which is attributed to the inability of the fluoride arms to respond to the increased electric field frequency. This is also observed in the phase angle where the out-of-phase response from the cages deviates further from −90° at 105 Hz. The AC conductivities for the encapsulated F− ion compounds all showed a characteristic drop in conductivity at different frequencies. This is attributed to the restriction of the response of the counter ion to the electric field. The reason this occurs at different frequencies is due to a difference in packing of the POSS cages from the differing lengths of the fluorinated alkyl chain arms.
δ shows a peak at 105 Hz for all compounds, which is attributed to the inability of the fluoride arms to respond to the increased electric field frequency. This is also observed in the phase angle where the out-of-phase response from the cages deviates further from −90° at 105 Hz. The AC conductivities for the encapsulated F− ion compounds all showed a characteristic drop in conductivity at different frequencies. This is attributed to the restriction of the response of the counter ion to the electric field. The reason this occurs at different frequencies is due to a difference in packing of the POSS cages from the differing lengths of the fluorinated alkyl chain arms.
4. Conclusions
Here, using combined thermal, SAXS/WAXS techniques, we have shown the self-assembled packing and crystalline nanostructure development in a series of POSS compounds where the F− anion is encapsulated inside the POSS cage and complexed with TBA+ or a crown ether cation outside the cage. From TGA and DSC, the melting temperatures of these compounds were below 100 °C (considerably lower than those of the POSS compounds without F− ion encapsulation) and showed thermal stability above Tm. The reduction in temperature is indicative of the nature of these ionic compounds. Furthermore, the stability of the F− ion encapsulated POSS compounds was seen to increase as the fluorinated alkyl chain arm length also increased due to increased molecular packing efficiency. The self-assembled packing morphology of the compounds was found to be of two types which was dependent on the length of the fluorinated alkyl chain arms: the self-assembly of a rod-like morphology was observed with long fluorinated alkyl chain arms (C8–C10), and the ordered structure was seen to return when cooled from the disordered melt. Those compounds with shorter fluorinated alkyl chain arms (C3–C6) showed a lack of crystalline reordering on cooling from the melt, remaining in a disordered state which is attributed to the favoured ionic assembly of the ions rather than the fluorinated alkyl chain arms. Reordering of the nanocrystalline structure was seen to occur over several days at room temperature. Electrical characterization revealed that all POSS compounds exhibited an insulating behavior. The POSS cages with or without fluoride ion encapsulation had similar AC conductivities but cages without fluoride ion encapsulation have the highest relative permittivity. Due to their ionic nature and organic–inorganic nanocrystalline structure, these POSS compounds lend themselves to many applications such as interface molecules to aid compatibilization and miscibility and as nanoscale fillers in polymer materials.Conflicts of interest
There are no conflicts to declare.Acknowledgements
The X-ray beam time at Diamond Light Source was provided under the experimental application SM-9121. The XMaS ESRF beam time was provided under the experimental applications 28-01/1127 and 28-01/1088. We are grateful for the assistance of all the Diamond I22 and ESRF BM28 (XMaS) beamline staff.References
- R. M. Laine, J. Mater. Chem., 2005, 15, 3725–3744 RSC.
- H.-L. Chen, X.-N. Jiao and J.-T. Zhou, Funct. Mater. Lett., 2017, 10, 1730001 CrossRef CAS.
- W. Zhang, G. Camino and R. Yang, Prog. Polym. Sci., 2017, 67, 77–125 CrossRef CAS.
- P. D. Lickiss and F. Rataboul, in Advances in Organometallic Chemistry, ed. A. F. Hill and M. J. Fink, Academic Press, 2008, vol. 57, pp. 1–116 Search PubMed.
- D. B. Cordes, P. D. Lickiss and F. Rataboul, Chem. Rev., 2010, 110, 2081–2173 CrossRef CAS PubMed.
- A. R. Bassindale, M. Pourny, P. G. Taylor, M. B. Hursthouse and M. E. Light, Angew. Chem., Int. Ed., 2003, 42, 3488–3490 CrossRef CAS PubMed.
- A. R. Bassindale, D. J. Parker, M. Pourny, P. G. Taylor, P. N. Horton and M. B. Hursthouse, Organometallics, 2004, 23, 4400–4405 CrossRef CAS.
- P. G. Taylor, A. R. Bassindale, Y. El Aziz, M. Pourny, R. Stevenson, M. B. Hursthouse and S. J. Coles, Dalton Trans., 2012, 41, 2048–2059 RSC.
- S. E. Anderson, D. J. Bodzin, T. S. Haddad, J. A. Boatz, J. M. Mabry, C. Mitchell and M. T. Bowers, Chem. Mater., 2008, 20, 4299–4309 CrossRef CAS.
- Y. El Aziz, A. R. Bassindale, P. G. Taylor, P. N. Horton, R. A. Stephenson and M. B. Hursthouse, Organometallics, 2012, 31, 6032–6040 CrossRef CAS.
- Y. El Aziz, P. G. Taylor, A. R. Bassindale, S. J. Coles and M. B. Pitak, Organometallics, 2016, 35, 4004–4013 CrossRef CAS.
- Y. El Aziz, A. R. Bassindale, P. G. Taylor, R. A. Stephenson, M. B. Hursthouse, R. W. Harrington and W. Clegg, Macromolecules, 2013, 46, 988–1001 CrossRef CAS.
- E. L. Heeley, D. J. Hughes, Y. El Aziz, I. Williamson, P. G. Taylor and A. R. Bassindale, Phys. Chem. Chem. Phys., 2013, 15, 5518–5529 RSC.
- E. L. Heeley, D. J. Hughes, Y. El Aziz, P. G. Taylor and A. R. Bassindale, Macromolecules, 2013, 46, 4944–4954 CrossRef CAS.
- E. L. Heeley, D. J. Hughes, Y. El Aziz, P. G. Taylor and A. R. Bassindale, Eur. Polym. J., 2014, 51, 45–56 CrossRef CAS.
- E. L. Heeley, D. J. Hughes, P. G. Taylor and A. R. Bassindale, RSC Adv., 2015, 5, 34709–34719 RSC.
- J. M. Mabry, A. Vij, S. T. Iacono and B. D. Viers, Angew. Chem., Int. Ed., 2008, 47, 4137–4140 CrossRef CAS PubMed.
- K. Lampard, XMaS: The UK Materials Science Facility at the ESRF, https://warwick.ac.uk/fac/cross_fac/xmas/, (accessed 07/10/2018, 2018) Search PubMed.
- D. L. Source, I22: Small Angle Scattering & Diffraction, http://www.diamond.ac.uk/Beamlines/Soft-Condensed-Matter/small-angle/I22.html (accessed 07/10/2018, 2018) Search PubMed.
- D. L. Source, FibreFix, http://www.diamond.ac.uk/Beamlines/Soft-Condensed-Matter/small-angle/SAXS-Software/CCP13/FibreFix.html, (accessed 07/10/2018, 2018) Search PubMed.
- M. Basham, J. Filik, M. T. Wharmby, P. C. Y. Chang, B. El Kassaby, M. Gerring, J. Aishima, K. Levik, B. C. A. Pulford, I. Sikharulidze, D. Sneddon, M. Webber, S. S. Dhesi, F. Maccherozzi, O. Svensson, S. Brockhauser, G. Naray and A. W. Ashton, J. Synchrotron Radiat., 2015, 22, 853–858 CrossRef PubMed.
- J. Filik, A. W. Ashton, P. C. Y. Chang, P. A. Chater, S. J. Day, M. Drakopoulos, M. W. Gerring, M. L. Hart, O. V. Magdysyuk, S. Michalik, A. Smith, C. C. Tang, N. J. Terrill, M. T. Wharmby and H. Wilhelm, J. Appl. Crystallogr., 2017, 50, 959–966 CrossRef CAS PubMed.
- R. Boese, H.-C. Weiss and D. Bläser, Angew. Chem., Int. Ed., 1999, 38, 988–992 CrossRef CAS.
- S. T. Iacono, A. Vij, W. Grabow, J. D. W. Smith and J. M. Mabry, Chem. Commun., 2007, 4992–4994, 10.1039/B712976A.
- S. C. Kettwich, S. N. Pierson, A. J. Peloquin, J. M. Mabry and S. T. Iacono, New J. Chem., 2012, 36, 941–946 RSC.
- R. D. Rogers and K. R. Seddon, Science, 2003, 302, 792–793 CrossRef PubMed.
- D. Freudenmann, S. Wolf, M. Wolff and C. Feldmann, Angew. Chem., Int. Ed., 2011, 50, 11050–11060 CrossRef CAS.
- K. Tanaka and Y. Chujo, J. Mater. Chem., 2012, 22, 1733–1746 RSC.
- P. Cardiano, G. Lazzara, S. Manickam, P. Mineo, S. Milioto and S. Lo Schiavo, Eur. J. Inorg. Chem., 2012, 2012, 5668–5676 CrossRef CAS.
- K. Tanaka, F. Ishiguro and Y. Chujo, J. Am. Chem. Soc., 2010, 132, 17649–17651 CrossRef CAS PubMed.
- J.-H. Jeon, K. Tanaka and Y. Chujo, J. Mater. Chem. A, 2014, 2, 624–630 RSC.
- J.-H. Jeon, K. Tanaka and Y. Chujo, RSC Adv., 2013, 3, 2422–2427 RSC.
- K. Tanaka, F. Ishiguro, J.-H. Jeon, T. Hiraoka and Y. Chujo, NPG Asia Mater., 2015, 7, e174 CrossRef CAS.
Footnote |
| † Electronic supplementary information (ESI) available. See DOI: 10.1039/c8ce01750f |
| This journal is © The Royal Society of Chemistry 2019 |

