
Halo-phenyl based linear dipodal receptors for entrapment of anions/anionic associations within neutral non-cooperative self-assemblies†
Utsab
Manna
and
Gopal
Das
 *
*
Department of Chemistry, Indian Institute of Technology Guwahati, Assam781039, India. E-mail: gdas@iitg.ernet.in; Fax: +91 361 258 2349; Tel: +91 361 258 2313
First published on 30th October 2018
Abstract
Two para-phenylenediamine based para-halophenyl substituted linear bis-urea receptors, L1 (para-chloro) and L2 (para-bromo), have been designed and synthesized to investigate their possible coordination with anions of various dimensions in the solid state. Both para-halophenyl-based isomers L1 and L2 form similar non-cooperative neutral self-assemblies with larger halides (i.e. chloride or bromide anions) and with planar acetate anions in solid state, although solution state studies indicate the binding tendency to be in the order of acetate > chloride > bromide, as evidenced from the 1H-NMR chemical shift values. In presence of excess strongly basic hydroxide anion, receptor L1 forms bicarbonate dimer (HCO3)2 entrapped neutral self-assemblies by OH− induced atmospheric CO2 fixation. Interestingly, in presence of tetrabutylammonium bisulfate anion, receptor L1 shows non-cooperative capture of divalent sulfate (SO42−) anion, whereas a bisulfate (HSO4)2 dimeric association has been entrapped within the non-cooperative self-assemblies of receptor L2. Furthermore, the para-halophenyl substituted isomer L1 also entraps linear (H2PO4)n polymeric aggregated anionic association within the neutral non-cooperative host-assemblies by hydrogen-bonding interactions.
1. Introduction
Neutral self-assembly formation via anion–receptor non-covalent interactions is an essential and contemporary aspects of supramolecular host–guest chemistry because of the tremendous relevance of anions in a range of biological, environmental, medical and chemical applications.1–7 The hydrogen-bonding environment of sulfate binding proteins in Salmonella typhimurium bacteria8 or phosphate binding proteins in Escherichia coli9 have encouraged researchers to develop various synthetic abiotic receptors containing hydrogen-bonding accessible functionalities, such as amine, amide, urea/thiourea, pyrrole/indole and imidazolium, for effective recognition of anionic guests.10–21 Subsequently, anion recognition also raises challenges as among anions of varied dimensionalities, the spherical chloride plays a substantial role in biological signal transduction processes as well as in organic solute transport through cell membranes. Meanwhile, the spherical bromide is a crucial cofactor for the assembly of collagen IV scaffolds in the growth of tissues, and the planar acetate anion is used by organisms with acetyl coenzyme A. The planar carbonate is a key anion in biomineralized materials and also works as a buffer in the blood. The tetrahedral sulfate anions have harmful effects on the remediation process of nuclear waste, while the high concentration of tetrahedral phosphate anions in aquatic ecosystems is accountable for eutrophication, etc.8,9,22–26 Another major environmental issue is the substantial increase in atmospheric CO2 concentration due to increased consumption of fossil fuels and the exponential rise in number of automobiles, industries, etc. Eventually, this rise may demand efficient fixation27,28 and activation of atmospheric CO2 as carbonate/bicarbonate via synthetic receptors. Thus far, numerous neutral or protonated structurally flexible and preorganized tripodal anion receptors with several –NH functionalities have been well-established. In most of these receptors, molecular capsules have been formed with topological complementarities.29–34 On the other hand, synthetic anion receptors derived from various dipodal amines are relatively less investigated in the literature compared to the tripodal anion receptors, as the dipodal receptor scaffolds exhibit more rigidity, less flexibility. They also contain less number of coordination sites and less preorganized architectures. However, few bisurea/thiourea functionalized dipodal anion receptors, derived from aromatic isomeric diamines, specifically most converging and preorganized diamine (ortho-phenylenediamine), were reported by Gale et al.,35–38 Das et al.,39 Wu et al.,40 Tarr et al.,41 Molina et al.42 and our group.43,44 Recently, we reported another set of dipodal anion receptors derived from meta-phenylenediamine, where the coordination phenomena were continually driven by the terminal aryl substituent effect or the anion dimensions.45–47 To continue our group's ongoing effort in the field of electronic and positional isomeric effect of receptors' substituents in anion recognition, herein we demonstrate the synthesis of two electronic isomeric para-halopenyl substituted linear and rigid dipodal urea receptors L1 and L2 (Scheme 1), derived from least converging and hence more challenging aromatic diamine (para-phenylenediamine). These linear receptors still showcase extensive coordination behavior with halides and oxyanions in their neutral form. Structural analyses reveal that para-chloro-isomer (L1) and para-bromo isomer (L2) form similar non-cooperative self-assemblies with spherical chloride (complex 2a) or bromide (complexes 1a, 2b) anions and planar acetate (complexes 1c, 2c) anions in the solid state. The hydroxide anion induced fixation of atmospheric CO2 as a cyclic (HCO3)2-anionic dimer is entrapped within the linear non-cooperative self-assemblies of receptor L1 (complex 1b). On the other hand, in presence of n-TBAHSO4 salt, receptor L1, with the aid of four urea groups form a divalent sulfate (SO42−) entrapped non-cooperative complex 1dvia hydrogen-bonding activated proton transfer from monovalent HSO4− anion. Conversely, receptor L2 entraps cyclic bisulfate (HSO4)2 anionic dimer (complex 2d) with the aid of two urea groups within the non-cooperative receptor self-assemblies. Moreover, the linear (H2PO4)n polymeric aggregated anionic association is captured within the neutral non-cooperative host-assemblies of receptor L1 in complex 1e.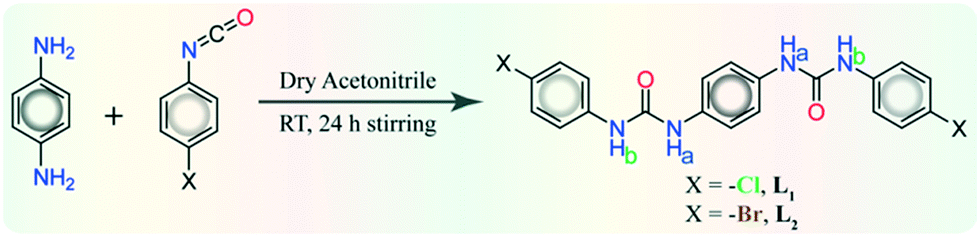 | ||
| Scheme 1 Synthetic route and molecular structure of aromatic 1,4-diamine based para-halophenyl-functionalized dipodal isomeric bis-urea receptors L1 and L2. | ||
2. Results and discussion
The halo-phenyl substituted bisurea receptors L1 or L2 were obtained as solid off-white precipitates in quantitative yield from dry acetonitrile reaction medium, by the reaction between 1,4-aromatic diamine and respective 4-halo-phenyl isocyanates. Note that, a particular anion receptor should hold appropriate hydrogen bonding donation sites, and both L1–L2 receptors contain urea –NH hydrogen bond donor sites capable of forming anion–receptor complexes despite their rigid linear architecture. Anion binding similarities or diversities of isomeric receptors can be visualized from the detailed structural information acquired from single crystal X-ray analyses of their anion complexes. Traditionally, crystallization is the fundamental route to understanding structural insights using anion receptor chemistry. Despite the many trials from different solvents and crystallization condition, good quality single crystals of free receptors were not attained; from basic DMF or DMSO solutions, instead each of them produced off-white semi-solid mass at the bottom of the crystallization vials. Detailed descriptions of structural analyses of halide and oxyanion complexes of receptors has been explained in following sections with pictorial depiction in the Fig. 1–4 and brief tabulation in Table 1.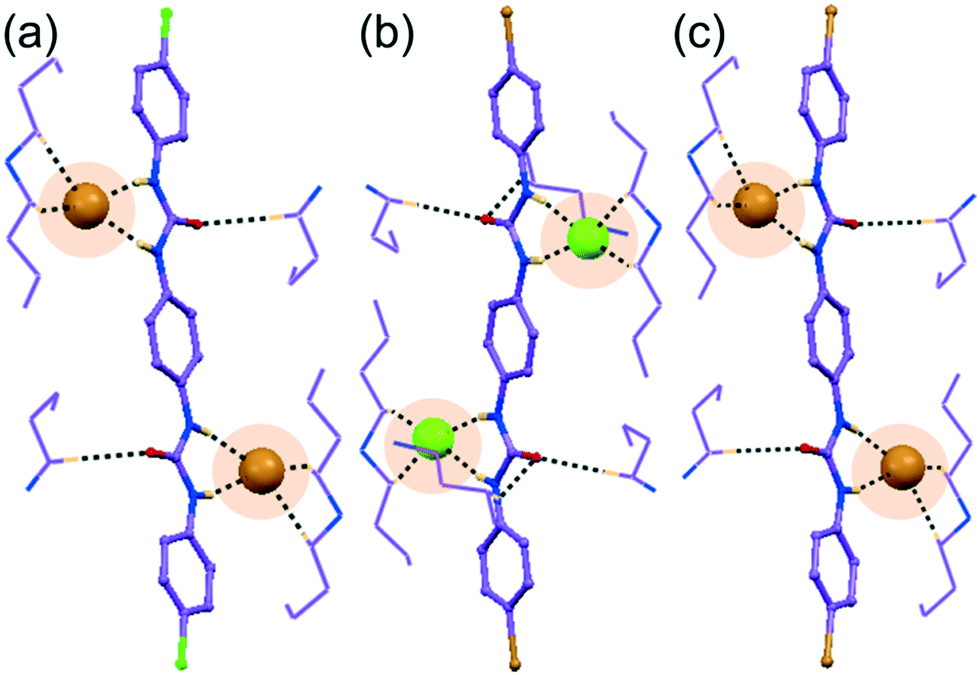 | ||
| Fig. 1 X-ray structures (partial) of non-cooperative halide complexes depicting arrays of hydrogen bonding interactions on (a) the spherical bromide entrapment within self-assemblies of para-chloro isomer L1 in complex 1a, (b) the spherical chloride entrapment within self-assemblies of para-bromo isomer L2 in complex 2a, and (c) the spherical bromide entrapment within self-assemblies of para-bromo isomer L2 in complex 2b. | ||
 | ||
| Fig. 2 X-ray structure (partial) of non-cooperative acetate complexes depicting the array of hydrogen bonding interactions on (a) the entrapped acetate within self-assemblies of para-chloro isomer L1 in complex 1c, and (b) the entrapped acetate within self-assemblies of para-bromo isomer L2 in complex 2c. | ||
 | ||
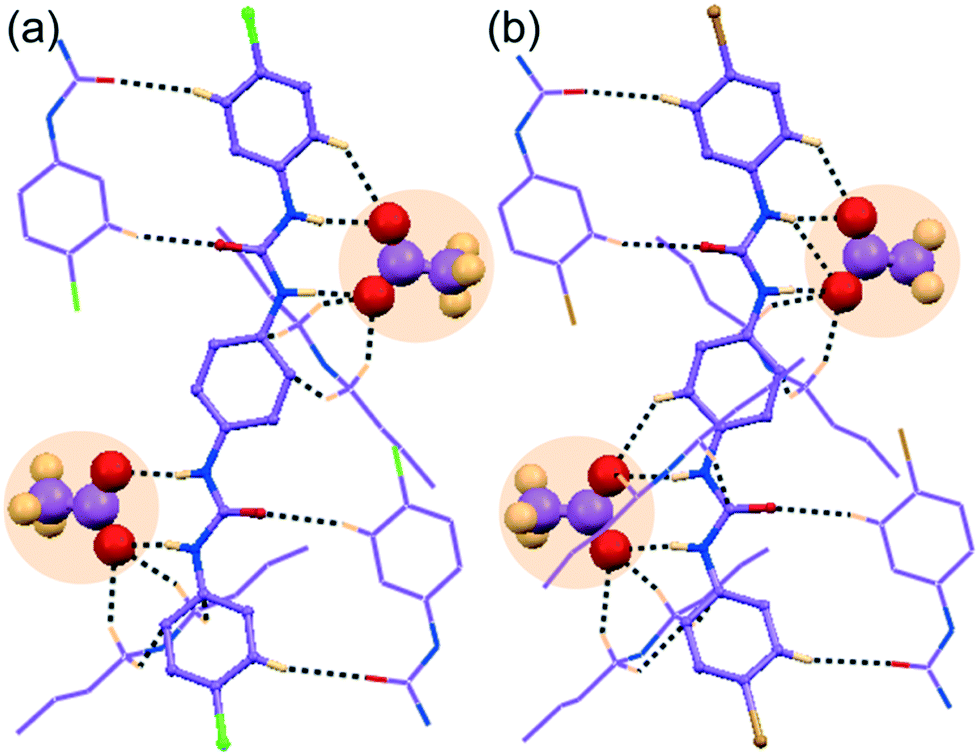
| Fig. 3 X-ray structures (partial) of non-cooperative anion complexes depicting (a) an array of hydrogen bonding interactions on the entrapped (HCO3)2 dimer within the self-assemblies of para-chloro isomer L1 by OH− induced aerial CO2 fixation in complex 1b, (b) magnified view of cyclic (HCO3)2 trapping in 1b, (c) an array of hydrogen bonding interactions on entrapment of (HSO4)2 dimer within the self-assemblies of para-bromo isomer L2 in complex 2d and (d) magnified view of cyclic (HSO4)2 trapping in 2d. | ||
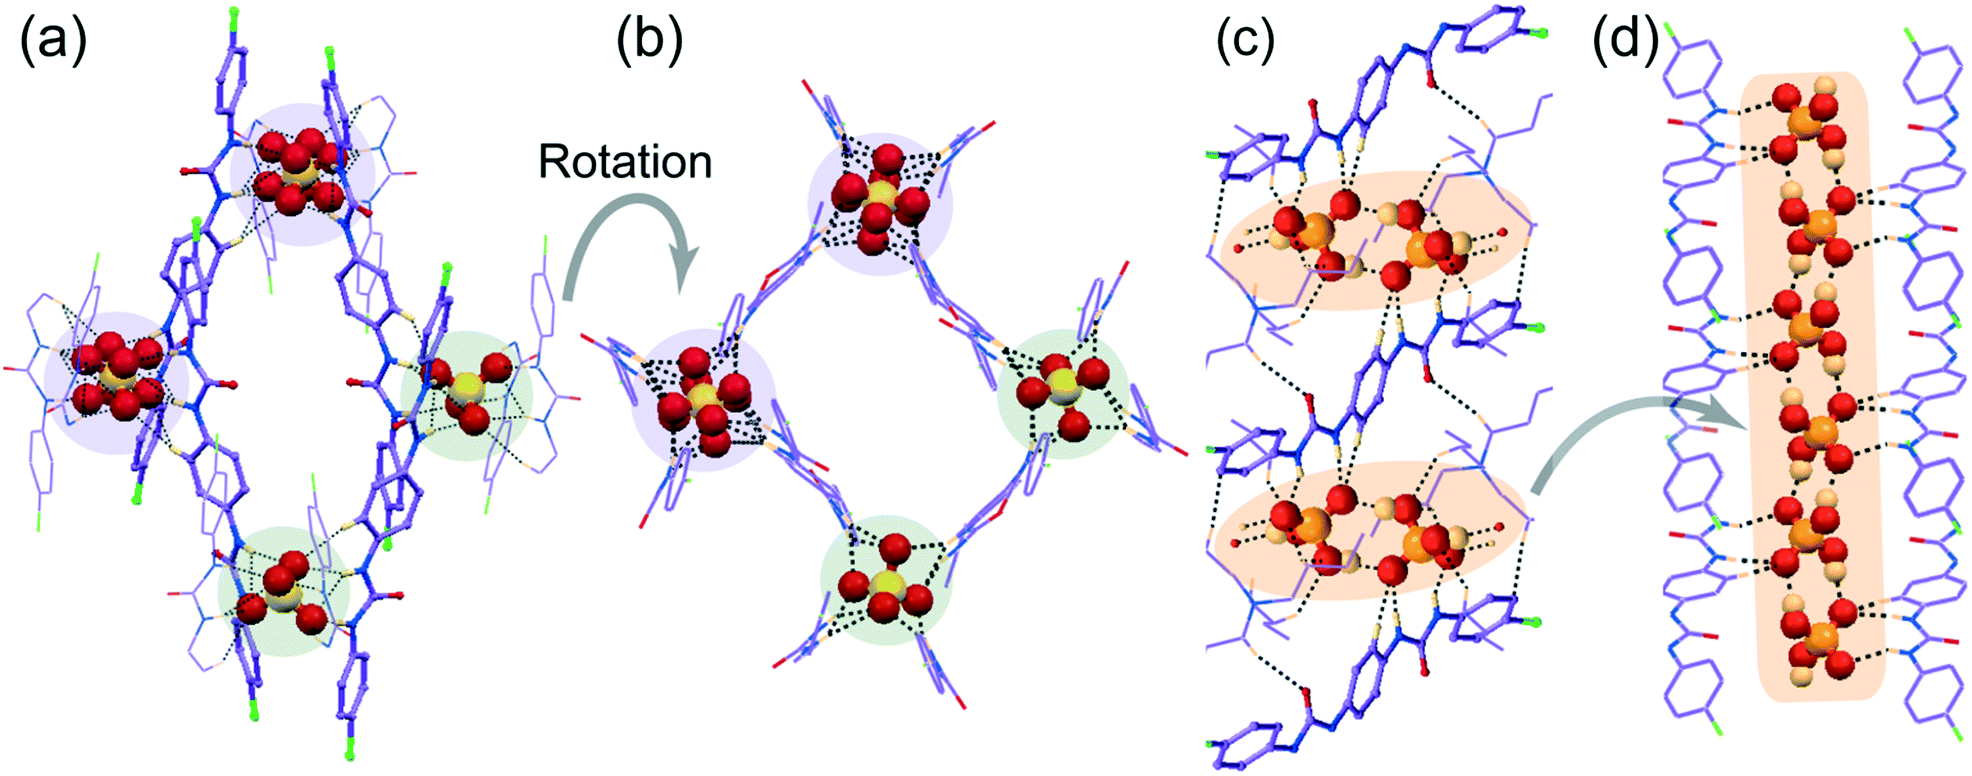 | ||
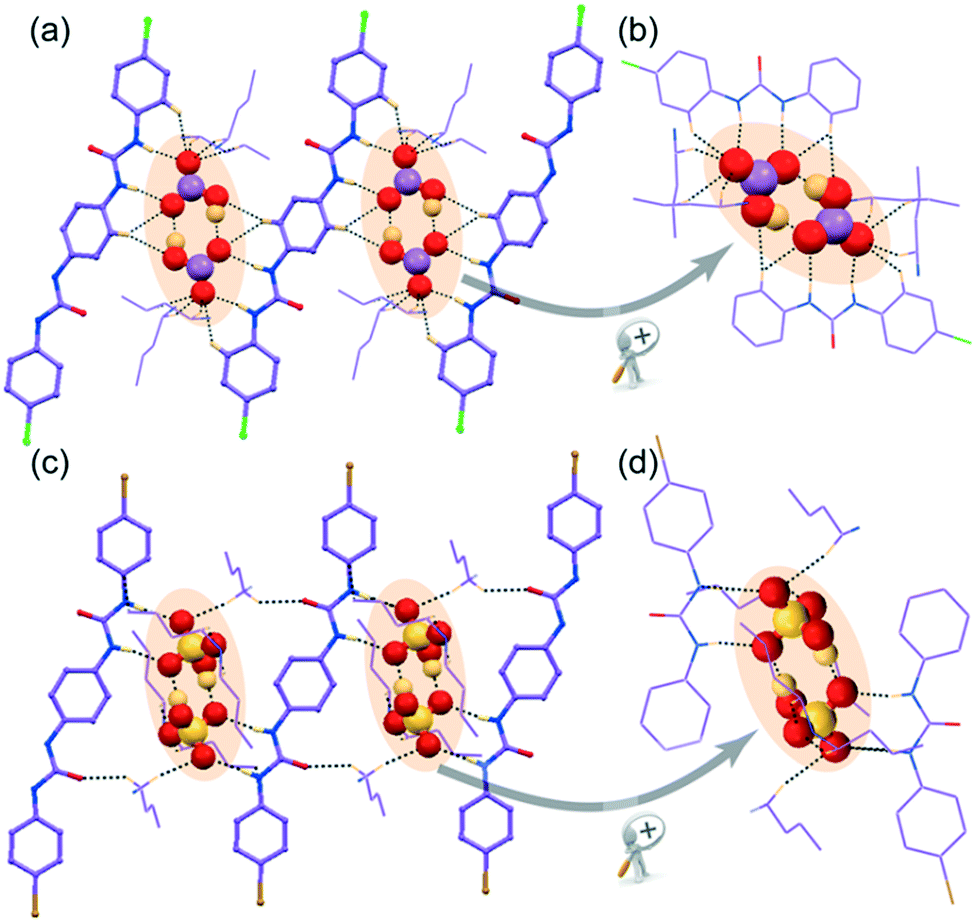
| Fig. 4 X-ray structures (partial) of non-cooperative anion complexes depicting (a) the array of hydrogen bonding interactions on entrapment of divalent SO42− by H-bonding activated proton transfer within the self-assemblies of para-chloro isomer L1 in complex 1d, (b) magnified view after rotation of cyclic host–guest tetramer entrapment in 1d, (c) the array of hydrogen bonding interactions on entrapment of (H2PO4)n polymer within the self-assemblies of para-chloro isomer L1 in complex 1e, and (d) the entrapment of linear polymeric aggregation of (H2PO4)n anionic association by L1 in complex 1e. | ||
| Anions by size | Anion-salt added | Bound anion assembly | Neutral host–guest complexes |
|---|---|---|---|
| Spherical chloride (Cl−) | n-TBACl | Single chloride | Non-cooperative complex with L2 (2a) |
| Spherical bromide (Br−) | n-TBABr | Single bromide | Non-cooperative complexes with L1 (1a) and L2 (2b) |
| Planar bicarbonate (HCO3−) | n-TBAOH | Cyclic (HCO3−)2 dimer | Non-cooperative complex with L1 (1b) |
| Planar acetate (OCOCH3−) | n-TBAOAc | Single acetate (OAc−) | Non-cooperative complexes with L1 (1c) and L2 (2c) |
| Tetrahedral sulfate (SO42−) | n-TBAHSO4 | Single sulfate (SO42−) | Non-cooperative complexes with L1 (1d) |
| Tetrahedral bisulfate (HSO4−) | Cyclic (HSO4−)2 dimer | Non-cooperative complexes with L2 (2d) | |
| Tetrahedral dihydrogenphosphate (H2PO4−) | n-TBAH2PO4 | Polymeric (H2PO4)n | Non-cooperative complexes with L1 (1e) |
2.1. Single crystal X-ray structural analysis studies
![[1 with combining macron]](https://www.rsc.org/images/entities/char_0031_0304.gif) with Z = 1. The asymmetric unit of complex 1b contains one C2v-inversion symmetric L1 receptor half-unit, one planar bicarbonate monoanion and its corresponding n-TBA+ counteraction. Structural elucidation reveals strong O–Hbicarbonate⋯Obicarbonate hydrogen-bonded cyclic dimeric anion structure—built by two symmetry-identical monovalent HCO3− ions (Fig. 3a and b) efficiently entrapped within arrays of linear non-cooperative neutral self-assemblies of para-chloro isomer L1 (Fig. 3a). A total of sixteen hydrogen bonding interactions (four strong N–Hurea⋯Obicarbonate, six C–Ho-aryl⋯Obicarbonate and six weak C–HTBA⋯Obicarbonate) are observed in complex 1b (Fig. 3b). Note that each mono-anion of cyclic dimer exhibits a coordination number of ten, which is the combination of two strong N–Hurea⋯Obicarbonate, two strong O–Hbicarbonate⋯Obicarbonate, three C–Ho-aryl⋯Obicarbonate and three weak C–HTBA⋯Obicarbonate hydrogen-bonding interactions (Fig. 3b). It is also worth mentioning that the planar HCO3− anion was absent in the basic solvent mixture prior to crystallization, and we believe that the bicarbonate anion is produced from atmospheric CO2. The hydroxide anions generated in situ, from basic ligand/OH− solution at the air solvent interface, dissolves aerial CO2 to form HCO3−.
with Z = 1. The asymmetric unit of complex 1b contains one C2v-inversion symmetric L1 receptor half-unit, one planar bicarbonate monoanion and its corresponding n-TBA+ counteraction. Structural elucidation reveals strong O–Hbicarbonate⋯Obicarbonate hydrogen-bonded cyclic dimeric anion structure—built by two symmetry-identical monovalent HCO3− ions (Fig. 3a and b) efficiently entrapped within arrays of linear non-cooperative neutral self-assemblies of para-chloro isomer L1 (Fig. 3a). A total of sixteen hydrogen bonding interactions (four strong N–Hurea⋯Obicarbonate, six C–Ho-aryl⋯Obicarbonate and six weak C–HTBA⋯Obicarbonate) are observed in complex 1b (Fig. 3b). Note that each mono-anion of cyclic dimer exhibits a coordination number of ten, which is the combination of two strong N–Hurea⋯Obicarbonate, two strong O–Hbicarbonate⋯Obicarbonate, three C–Ho-aryl⋯Obicarbonate and three weak C–HTBA⋯Obicarbonate hydrogen-bonding interactions (Fig. 3b). It is also worth mentioning that the planar HCO3− anion was absent in the basic solvent mixture prior to crystallization, and we believe that the bicarbonate anion is produced from atmospheric CO2. The hydroxide anions generated in situ, from basic ligand/OH− solution at the air solvent interface, dissolves aerial CO2 to form HCO3−.| 2F− + H2O → OH− + HF2− |
| OH− + CO2 → HCO3− |
However, this type of atmospheric CO2 fixation by induction of strongly basic hydroxide or fluoride anions within several preorganized artificial receptor systems, resulting in carbonate or bicarbonate trapped complexes. This is not uncommon in the literature and was previously reported by Gunnlaugsson et al.,48 Gale et al.49,50 Ghosh et al.51 and also from our group.44,46,52,53 But here, the OH− induced cyclic (HCO3)2-dimer has been trapped within the neutral assemblies of linear, rigid, less preorganised receptor, synthesized from the most divergent aromatic diamine.
with Z = 1 and its asymmetric unit comprises of one C2v-inversion-symmetric half L2 receptor, one monovalent HSO4− anion, its corresponding single n-TBA counter-cation unit and one solvent DMF molecule of crystallization. X-ray analysis clearly reveals that a divalent higher coordinating sulfate anion is efficiently captured with the aid of eight urea –NH groups from four non-cooperative symmetry-identical linear L1 conformers in complex 1d (Fig. 4a and b). The coordination number of tetrahedral divalent sulfate anion becomes fourteen, which is the combination of twelve strong N–Hurea⋯Osulfate and two weak C–Ho-aryl⋯Osulfate hydrogen-bonding interactions (Fig. 4a and c). Structural study of complex 1d also unveils the formation of a cyclic tetrameric host–guest assembly through consecutive (L1-SO42−)4 non-cooperative interactions (Fig. 4a). On the other hand, in complex 2d, the dimeric cyclic (HSO4−)2 association (formed by strong O–Hbisulfate⋯Obisulfate donor–acceptor interactions between monovalent HSO4−) is entrapped within the non-cooperative assemblies of L2 (Fig. 3c). This entrapment involves an array of ten (four strong N–Hurea⋯Obisulfate and six weak C–HTBA⋯Obisulfate) hydrogen bonding interactions (Fig. 3c and d), where each HSO4− anion exhibit hepta-coordination (Fig. 3d). Additionally, both complexes gain extra stability by several weak C–HTBA⋯Ocarbonyl interactions between the receptor and the counter-cations.
with Z = 1. Structural elucidation reveals that one C2v inversion-symmetric L1 receptor, one monovalent tetrahedral H2PO4− anion and its corresponding n-TBA+ counter-cation are present in the asymmetric unit of complex 1e. It is also clearly evident from the X-ray structure that a linear polymeric anionic association of (H2PO4−)n, aggregated by four O–Hbiphosphate⋯Obiphosphate donor–acceptor interactions around a single monovalent H2PO4− anion, is efficiently captured within the arrays of non-cooperative L1 host assemblies (Fig. 4c). This capture is aided by strong N–Hurea⋯Obiphosphate, C–Ho-aryl⋯Obiphosphate and weak C–HTBA⋯Obiphosphate interactions, where each H2PO4− anion exhibits a coordination number of eleven in the neutral complex 1e (Fig. 4c and d).
Note that, depending on the size, shape and coordination number of the anion or anionic association, the orientation of non-cooperative host-assemblies and participation of urea groups has been systematically altered. Consequently, only one urea group of a particular receptor was involved in the coordination of spherical chloride, bromide or planar single acetate anion (Fig. 1a–c and 2a and b). Meanwhile, for the entrapment of dimeric or polymeric anionic associations, such as (HCO3−)2, (HSO4−)2 or (H2PO4−)n, at least two urea groups of different symmetry-identical receptor conformers were involved in the coordination (Fig. 3a and c and 4b). Furthermore, four urea groups from four different symmetry-identical receptor conformers were engaged in entrapping larger coordinating tetrahedral divalent sulfate anion (Fig. 4a and c) to form non-cooperative host–guest self-assembly.
A relationship of N–H⋯A angle vs. H⋯A distance indicates that most of the N–H⋯A interactions between isomeric halo-phenyl based receptors and halides or oxyanions, in the corresponding neutral complexes, are in the strong hydrogen-bonding region of d(H⋯A) ≤ 2.6 Å and d(D⋯A) ≤ 3.2 Å in solid state. The scattered plot of N–H⋯A angles vs. H⋯A distances (Fig. S25, ESI†) of individual neutral anion complexes also support the assumption that most of these interactions show strong hydrogen-bonding character. Hydrogen bonding data and crystal parameters with refinement data of all halides and oxyanion complexes 1a–1e and 2a–2d of receptors L1 and L2, respectively, are tabulated in Table S1 (ESI†) and Tables 3 and 4.
2.2. Hirshfeld surface analyses
The presence of strong N–H⋯A (anion) bonds as well as several weak C–H⋯O, C–H⋯π, C–H⋯Cl/Br non-covalent interactions involved in the structural alteration of linear receptors upon anion complexation can also be visualized by the Hirshfeld surfaces (HSs). HSs analysis is considered to be a valuable tool to define the surface characteristics of molecules.54 It can offer characteristic visualization of intermolecular interactions by color-coding short or long contacts, where the color intensity describes relative strength of the interactions. The two dimensional fingerprint plots (2D FPs) of these Hirshfeld surfaces quantitatively explain the nature and types of intermolecular interactions, experienced by the molecules in a specific crystal, as “contact contribution”.55 The contact contribution percentage of the dnorm surface area of anion bound dipodal receptor segments of each non-cooperative host–guest complexes are provided in Table 2.| Contacts | 1a | 1b | 1c | 1d | 1e | 2a | 2b | 2c | 2d |
|---|---|---|---|---|---|---|---|---|---|
| H⋯Cl/Br | 14.0/15.0 | 16.1 | 14.1 | 17.7 | 14.1 | 13.9/14.4 | 29.5 | 14.3 | 16.0 |
| H⋯O | 4.6 | 15.2 | 14.4 | 13.1 | 17.5 | 4.6 | 4.5 | 14.0 | 17.5 |
| H⋯N | 3.3 | 3.6 | 2.8 | 4.0 | 2.8 | 3.3 | 3.3 | 2.7 | 3.5 |
| H⋯C | 17.7 | 21.2 | 16.8 | 20.3 | 18.2 | 17.7 | 17.1 | 16.6 | 19.6 |
| H⋯H | 42.3 | 43.6 | 51.1 | 42.3 | 46.5 | 41.1 | 41.1 | 50.6 | 41.1 |
Fig. 5a refers to the HSs mapped with dnorm for the halide and oxyanion bound neutral dipodal receptor segments of 4-halophenyl functionalized linear free bisurea receptors L1 and L2. The strong N–H⋯A (halide or oxyanion) hydrogen bonds among urea N–H donors of L1/L2 receptor and Cl/Br/O atom of halides/oxyanions in the neutral complexes(1a–1e and 2a–2d) are depicted as bright red spots on the surfaces mapped with dnorm in Fig. 5a. In addition, several weak interactions, such as C–H⋯π, C–H⋯O and C–H⋯Cl/Br (terminal substituent), that exist among the adjacent linear receptor segments, the anion and o-aryl receptor group or the anion and n-TBA counter-cations (Fig. 5a) appear as bright to faint red spots on the HSs mapped with dnorm of anion complexes. The H⋯O close contacts, as obtained from the corresponding 2D fingerprint plots of HSs for each anion complex (Fig. 5b), describe characteristic sharp as well as soft ‘spikes” in the plots. But, the corresponding 2D fingerprint plots for the H⋯C close contacts show relatively soft characteristic “spikes”, compared to the H⋯O close contacts, for most of the anion complexes (Fig. 5c). From Table 2, it is observed that the H⋯X(Cl/Br) close contacts of chloride or bromide complexes show contact contributions of ∼28–30% that are comparatively larger than the contact contributions of oxyanion bound complexes of dipodal receptors (∼14–18%). This phenomenon is heavily attributed to the combined H⋯X (X as anion as well as aryl substituents) interactions in halide bound neutral complexes of dipodal receptor segments. Subsequently, the H⋯O close contacts of halide complexes exhibit very small contact contributions (∼4.5–4.6%) compared to the contact contributions of oxyanion complexes (∼13–18%) (Table 2). This is due to a higher number of N–H⋯O or C–H⋯O interactions involved in oxyanion bound complexes of dipodal receptor segments than in the halide complexes. As a result, the HSs mapped with dnorm and corresponding 2D FPs of anion bound neutral dipodal receptor segments thoroughly authenticate the solid state outcomes obtained from single crystal X-ray analyses of neutral host–guest complexes.
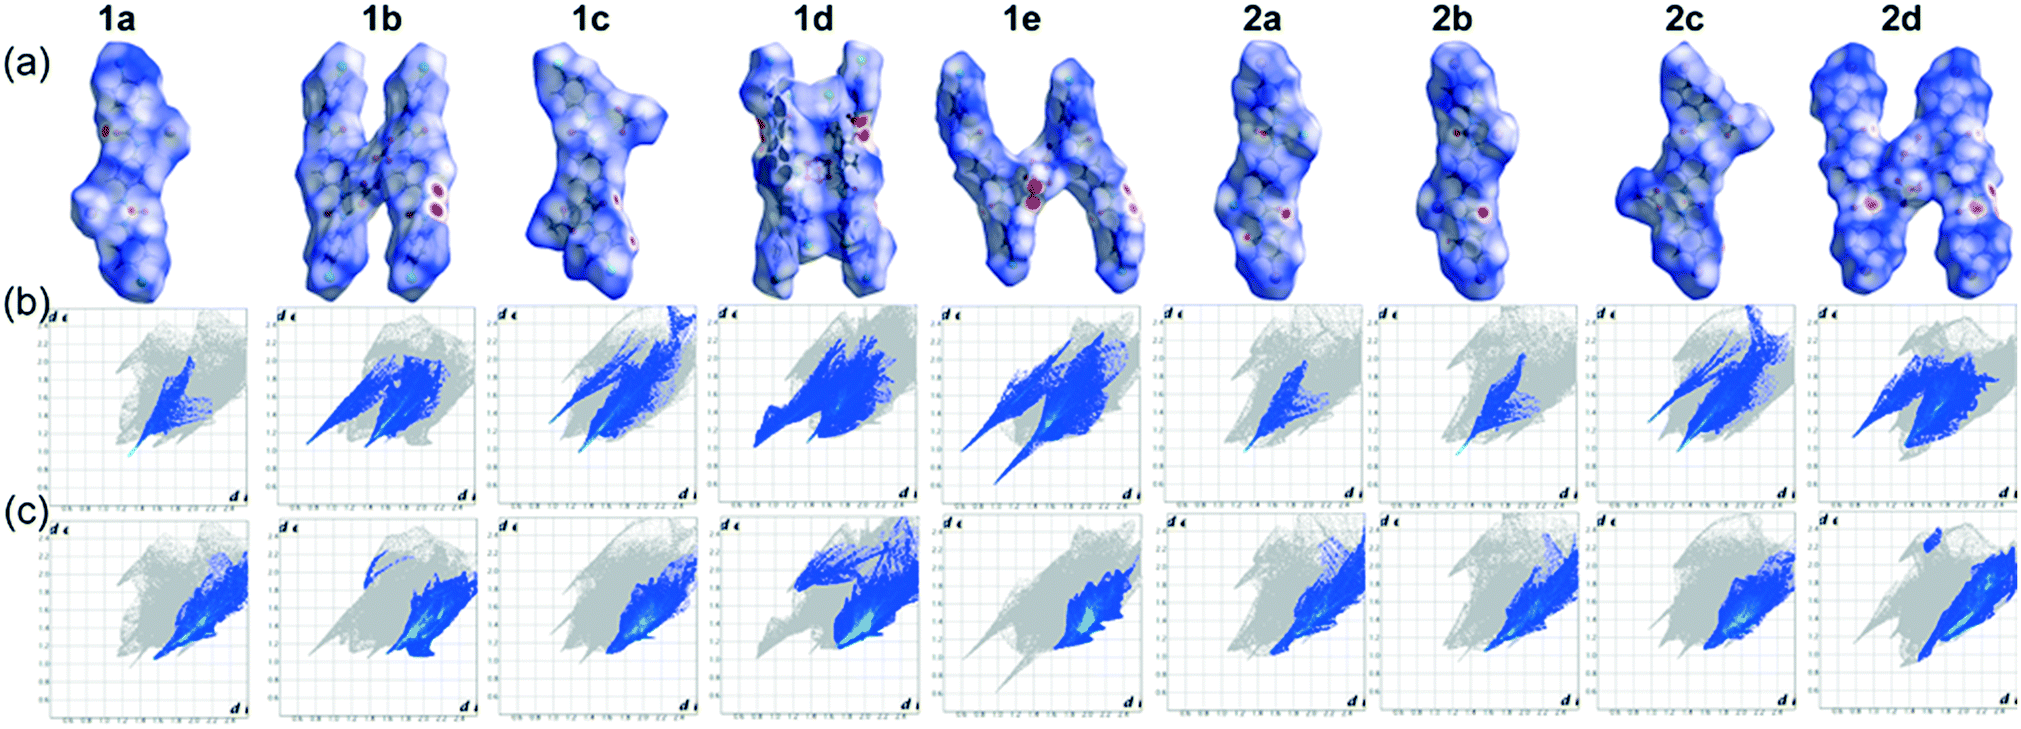 | ||
| Fig. 5 Hirshfeld surface analysis displaying (a) the dnorm surfaces of anion bound dipodal segments of complexes 1a–1e and 2a–2d, (b) corresponding 2D FPs with O⋯H interactions highlighted in color (from N–H⋯O or C–H⋯O close contacts) and (c) corresponding 2D FPs with the C⋯H interactions highlighted in color (involved in C–H⋯O or C–H⋯π or C–H⋯X (Cl/Br) contacts). | ||
2.3. Solution-state anion-binding studies
Solution phase anion binding studies of both receptors L1 and L2 have also been thoroughly carried out by 1H NMR experiments in DMSO-d6 to compare binding of halide as well as oxyanions with receptors, as observed from the solid state investigations. Most significant changes have been observed in the urea –NH protons of receptors, as they are expected to be the primary sites for anion recognition, in systematic qualitative 1H NMR analyses of the isolated anion complexes 1a–1e and 2a–2d in DMSO-d6. Fig. 6a and b show the maximum amount of chemical shift changes noticed in presence of anions of different sizes, such as halide or oxyanion, to the respective solutions of free isomeric receptors L1 and L2. 1H NMR analysis of the free receptors reveal that both of the para-chlorophenyl (L1) and para-bromophenyl (L2) functionalized isomers exhibit similar chemical shift (δ) values for urea –NH protons, i.e., –NHa = 8.580 ppm and NHb = 8.756 ppm for L1 and –NHa = 8.586 ppm and NHb = 8.762 ppm for L2. Then, the quaternary ammonium salts of halides or oxyanions were added to the individual DMSO-d6 solution of receptors to verify the results of solid state anion–receptor binding. Different types of downfield chemical shift changes have been observed in urea –NH signal upon halide and oxyanion addition. The quaternary bromide salt addition to individual DMSO-d6 solutions of the two receptors exhibits very negligible downfield shifts of urea –NH protons, with identical average Δδ = 0.06 ppm for L1 and L2 (Δδ –NHa = 0.06 ppm; ΔδNHb = 0.06 ppm for both receptors). Subsequently, addition of chloride salt to the solution of L2 results in an average downfield shift of Δδ = 0.35 ppm (ΔδNHa = 0.32 ppm; ΔδNHb = 0.37 ppm) for urea –NH protons in its 1H-NMR data. This explains the better binding efficiency of receptor-chloride than receptor-bromide in solution state. Note that the broadening and splitting of 1H NMR peaks on chloride addition occurs possibly due to the complexation of anion with receptors, followed by the equilibrium of hydrogen bonding interactions between N–H⋯Cl and N⋯H–Cl in the solution phase. On the other hand, despite exhibiting similar non-cooperative binding as halides in solid state, the acetate complexes of each ligand display large average downfield shifts of Δδ = 1.97 ppm for L1 (ΔδNHa = 1.92 ppm; ΔδNHb = 2.01 ppm) and Δδ = 2.65 ppm for L2 (ΔδNHa = 2.58 ppm; ΔδNHb = 2.72 ppm) for the urea –NH protons in 1H-NMR data. This indicates the efficient binding of acetate anions with receptors in solution state, similar to that observed from solid state studies. Furthermore, entrapment of anionic associations in solid state are fully supported by the 1H-NMR solution state studies, for example, the hydroxide induced (HCO3)2-dimer and (H2PO4)n-polymer entrapped complexes of receptor L1 show large average downfield shifts of Δδ = 1.96 ppm (ΔδNHa = 1.91 ppm; ΔδNHb = 2.00 ppm) and Δδ = 1.56 ppm (ΔδNHa = 1.44 ppm; ΔδNHb = 1.68 ppm), respectively, for the urea –NH protons in 1H-NMR data. Therefore, the greater binding efficiency of oxyanions relative to halides with either of the receptors in solution phase can be attributed to the stronger N–H⋯O hydrogen bonding interactions in oxyanion complexes compared to the weaker N–H⋯Cl/Br interactions in halide complexes. However, the higher coordinating divalent sulfate entrapped complex of L1 exhibits moderate average downfield shifts of Δδ = 1.16 ppm (ΔδNHa = 1.04 ppm; ΔδNHb = 1.28 ppm) for urea –NH protons in solution phase and the monovalent HSO4− dimer trapped complex of L1 shows very small average downfield shifts of Δδ = 0.04 ppm (ΔδNHa = 0.04 ppm; ΔδNHb = 0.04 ppm) for urea –NH protons in its 1H-NMR data. This can be attributed to the stronger coordinating power of divalent sulfate with more number of ligand urea –NH groups compared to the monovalent bisulfate anion, which was also observed from the solid state analyses. Note that, the anion binding dissimilarities with receptor molecule in solid and solution states are a common phenomenon in literature, which can occur because of the rigid, more organized receptor arrangement in solid state compared with the flopping, looser orientations in solution state.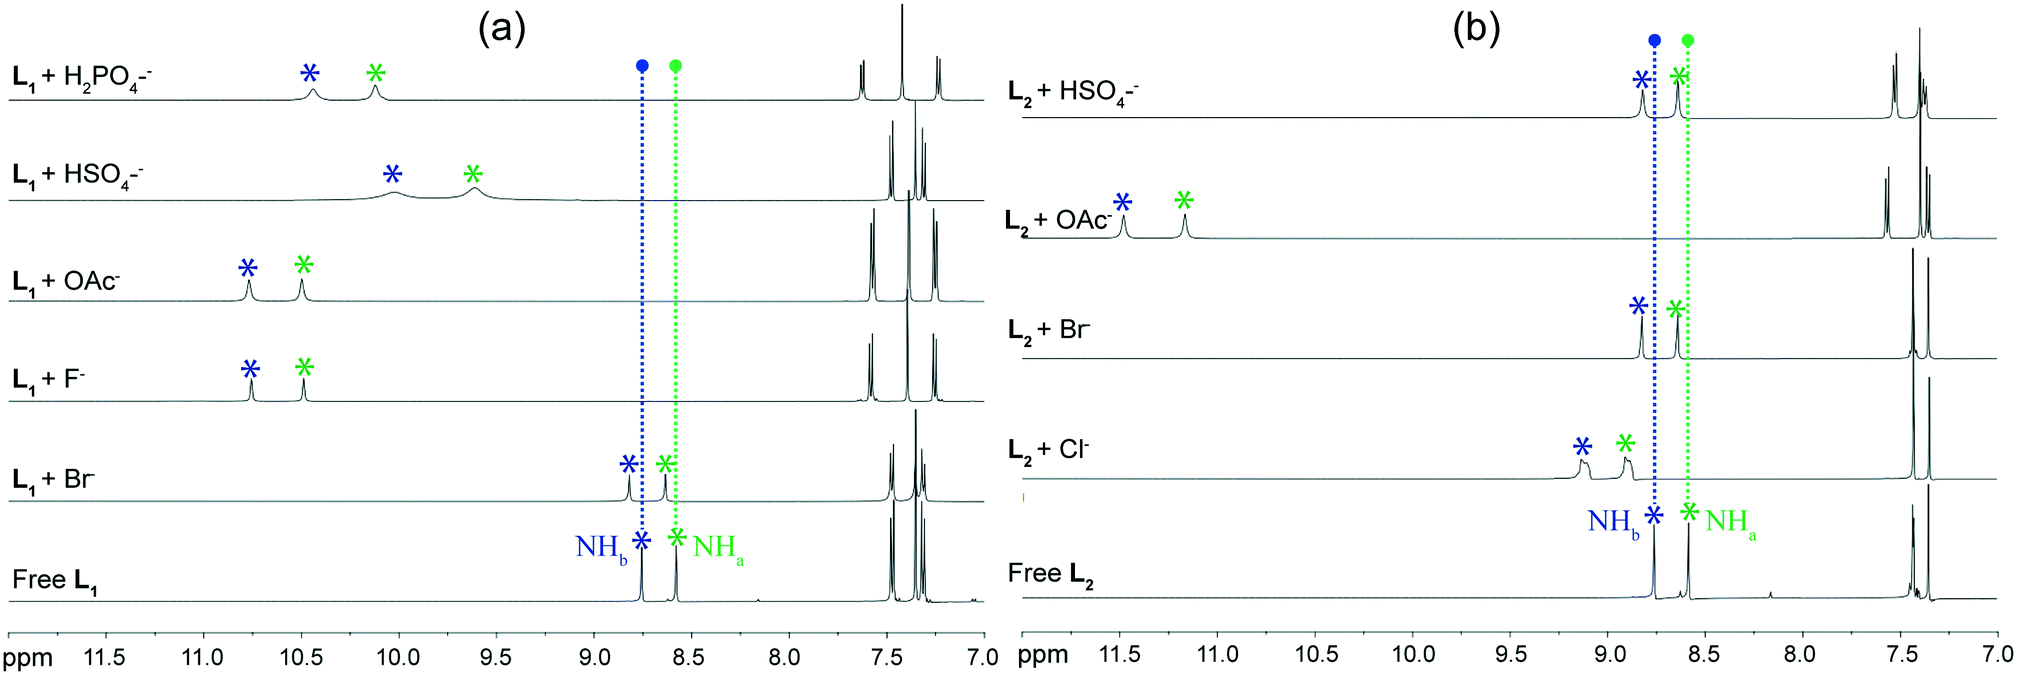 | ||
| Fig. 6 Comparative expanded and stacked partial 1H NMR spectra in solution phase of (a) L1 with different anions and (b) L2 with different anions, as observed from the solid state results displaying the maximum observable downfield shifts of urea proton upon anion complexation. | ||
3. Conclusions
In summary, two para-halophenyl functionalized linear bisurea receptors, derived from the most divergent aromatic diamine (para-phenylenediamine), have been rationally developed to investigate their possible coordination with anionic guests. Structural analyses exhibit that both receptors, isomeric with respect to para-halo substitution, establish themselves as potential halide and oxyanion binding scaffolds via formation of non-cooperative neutral host-assemblies despite their rigid, linear and less preorganized ligand architectures. Both the para-chloro isomer L1 and para-bromo isomer L2 form similar non-cooperative self-assemblies with either spherical chloride/bromide or planar acetate anions, where only one urea group of a particular receptor was involved in binding with these less coordinating anionic guests. On entrapping anionic associations, such as OH− ion induced dimeric (HCO3)2, dimeric (HSO4)2 and polymeric (H2PO4)n (formed by strong O–H⋯O interactions), both receptors form non-cooperative neutral host–guest self-assemblies in solid state with the aid of two urea groups from two symmetry-identical linear conformers. Furthermore, the larger coordinating divalent sulfate anion is efficiently entrapped within the non-cooperative host-assemblies of para-chloro isomer L1 with the assistance of four urea groups from four symmetry-identical conformers. Thorough Hirshfeld surface analyses of neutral complexes and 1H-NMR studies for solution-state anion binding also validate the host–guest complexation in solid state. Hence, the systematic halide and oxyanion binding with the rigid linear bisurea scaffolds is reliably interpreted, and observed variations are consistently explained. Nevertheless, such less cooperative and less preorganized divergent dipodal anion receptors, containing hydrophobic environment, is of immense importance for developing a new class of host–guest self-assemblies.4. Experimental section
4.1. Materials and methods
All solvents and reagents required for the synthetic procedures were obtained from commercial sources and used as received without any advanced purification. para-Phenylenediamine, 4-chlorophenyl isocyanate, 4-bromophenyl isocyanate and all quaternary ammonium salts were purchased from Sigma-Aldrich. All solvents for crystallization purposes as well as synthesis were purchased from Merck, India. 1H NMR spectra of free linear ligands and their anion bound complexes were recorded on a Varian FT-600 MHz instrument and chemical shift values were noted in parts per million (ppm) using tetramethylsilane [Si(CH3)4] or a residual solvent peak as the reference. Electrospray ionization mass spectrometry (ESI-MS) spectra of individual free receptors were recorded from methanol solutions. FT-IR spectra of air-dried samples of free L1 and L2 receptors as well as the anion complexes were recorded on a Perkin-Elmer-Spectrum with KBr disks in the range 4000–500 cm−1.4.2. Syntheses and characterization
L
1
: 1H NMR (600 MHz, DMSO-d6) δ (ppm): 7.307–7.322 (d, 4H, ∼9.0 Hz, Ar–H), 7.352 (s, 4H, Ar–H), 7.464–7.479 (d, 4H, ∼9.0 Hz, Ar–H), 8.580 (s, 2H, NHa), 8.756 (s, 2H, NHb). IR spectra (KBr pellet): 3292 cm−1 vs(N–H), 3076 cm−1 vs(C–H), 1634 cm−1 vs(C![[double bond, length as m-dash]](https://www.rsc.org/images/entities/char_e001.gif) O), 644 cm−1 vs(C–Cl). ESI-MS, (m/z) calculated for C20H16N4O2Cl2: 414.0650. Found: 415.0761.
O), 644 cm−1 vs(C–Cl). ESI-MS, (m/z) calculated for C20H16N4O2Cl2: 414.0650. Found: 415.0761.
L
2
: 1H NMR (600 MHz, DMSO-d6) δ (ppm): 7.351 (s, 4H, Ar–H), 7.412–7.427 (d, 4H, ∼9.0 Hz, Ar–H), 7.432–7.448 (d, 4H, ∼9.6 Hz, Ar–H), 8.586 (s, 2H, NHa), 8.762 (s, 2H, NHb). IR spectra (KBr pellet): 3299 cm−1 vs(N–H), 3076 cm−1 vs(C–H), 1640 cm−1 vs(CO), 607 cm−1 vs(C–Br). ESI-MS, (m/z) calculated for C20H16N4O2Br2: 501.9640. Found: 505.2766.
1a: 1H NMR (600 MHz, DMSO-d6) δ (ppm): 0.918–0.943 (t, 12H, ∼7.2 Hz, TBA-CH3), 1.272–1.333 (m, 8H, TBA-CH2), 1.534–1.586 (m, 8H, TBA-CH2), 3.144–3.172 (t, 8H, ∼8.4 Hz, N+-TBA-CH2), 7.306–7.320 (d, 4H, ∼8.4 Hz, Ar–H), 7.353 (s, 4H, Ar–H), 7.467–7.481 (d, 4H, ∼8.4 Hz, Ar–H), 8.635 (s, 2H, NHa), 8.819 (s, 2H, NHb). IR spectra (KBr pellet): 3240 cm−1 vs(N–H), 3051 cm−1 vs(C–H), 1693 cm−1 vs(CO), 657 cm−1 vs(C–Cl).
2a: 1H NMR (600 MHz, DMSO-d6) δ (ppm): 0.918–0.942 (t, 12H, ∼7.2 Hz, TBA-CH3), 1.271–1.332 (m, 8H, TBA-CH2), 1.532–1.584 (m, 8H, TBA-CH2), 3.143–3.171 (t, 8H, ∼8.4 Hz, N+-TBA-CH2), 7.347 (s, 4H, Ar–H), 7.240–7.256 (bs, 8H, Ar–H), 8.902 (bs, 2H, NHa), 9.127 (bs, 2H, NHb). IR spectra (KBr pellet): 3246 cm−1 vs(N–H), 3050 cm−1 vs(C–H), 1699 cm−1 vs(CO), 513 cm−1 vs(C–Br).
2b: 1H NMR (600 MHz, DMSO-d6) δ (ppm): 0.919–0.944 (t, 12H, ∼7.2 Hz, TBA-CH3), 1.272–1.333 (m, 8H, TBA-CH2), 1.534–1.586 (m, 8H, TBA-CH2), 3.145–3.173 (t, 8H, ∼8.4 Hz, N+-TBA-CH2), 7.352 (s, 4H, Ar–H), 7.414–7.430 (d, 4H, ∼9.6 Hz, Ar–H), 7.431–7.447 (d, 4H, ∼9.6 Hz, Ar–H), 8.641 (s, 2H, NHa), 8.824 (s, 2H, NHb). IR spectra (KBr pellet): 3240 cm−1 vs(N–H), 3056 cm−1 vs(C–H), 1693 cm−1 vs(CO), 510 cm−1 vs(C–Br).
1c: 1H NMR (600 MHz, DMSO-d6) δ (ppm): 0.909–0.933 (t, 12H, ∼7.2 Hz, TBA-CH3), 1.262–1.323 (m, 8H, TBA-CH2), 1.519–1.572 (m, 8H, TBA-CH2), 1.767 (s, 3H, acetate–CH3), 3.127–3.155 (t, 8H, ∼8.4 Hz, N+-TBA-CH2), 7.245–7.260 (d, 4H, ∼9.0 Hz, Ar–H), 7.387 (s, 4H, Ar–H), 7.565–7.580 (d, 4H, ∼9.0 Hz, Ar–H), 10.498 (s, 2H, NHa), 10.768 (s, 2H, NHb). IR spectra (KBr pellet): 3416 cm−1 vs(O–H), 3299 cm−1 vs(N–H), 3056 cm−1 vs(C–H), 1699 cm−1 vs(CO), 646 cm−1 vs(C–Cl).
2c: 1H NMR (600 MHz, DMSO-d6) δ (ppm): 0.912–0.937 (t, 12H, ∼7.2 Hz, TBA-CH3), 1.265–1.326 (m, 8H, TBA-CH2), 1.523–1.576 (m, 8H, TBA-CH2), 1.738 (s, 3H, acetate–CH3), 3.132–3.160 (t, 8H, ∼8.4 Hz, N+-TBA-CH2), 7.346–7.360 (d, 4H, ∼8.4 Hz, Ar–H), 7.393 (s, 4H, Ar–H), 7.556–7.571 (d, 4H, ∼9.0 Hz, Ar–H), 11.166 (s, 2H, NHa), 11.481 (s, 2H, NHb). IR spectra (KBr pellet): 3416 cm−1 vs(O–H), 3300 cm−1 vs(N–H), 3050 cm−1 vs(C–H), 1693 cm−1 vs(CO), 513 cm−1 vs(C–Br).
1b: 1H NMR (600 MHz, DMSO-d6) δ (ppm): 0.914–0.938 (t, 12H, ∼7.2 Hz, TBA-CH3), 1.267–1.328 (m, 8H, TBA-CH2), 1.527–1.579 (m, 8H, TBA-CH2), 3.136–3.164 (t, 8H, ∼8.4 Hz, N+-TBA-CH2), 7.247–7.262 (d, 4H, ∼9.0 Hz, Ar–H), 7.394 (s, 4H, Ar–H), 7.574–7.589 (d, 4H, ∼9.0 Hz, Ar–H), 10.488 (s, 2H, NHa), 10.756 (s, 2H, NHb). IR spectra (KBr pellet): 3416 cm−1 vs(O–H), 3240 cm−1 vs(N–H), 3056 cm−1 vs(C–H), 1693 cm−1 vs(CO), 657 cm−1 vs(C–Cl).
1d: 1H NMR (600 MHz, DMSO-d6) δ (ppm): 0.919–0.943 (t, 24H, ∼7.2 Hz, TBA-CH3), 1.272–1.333 (m, 16H, TBA-CH2), 1.532–1.585 (m, 16H, TBA-CH2), 3.142–3.170 (t, 16H, ∼8.4 Hz, N+-TBA-CH2), 7.303–7.318 (d, 4H, ∼9.0 Hz, Ar–H), 7.353 (s, 4H, Ar–H), 7.469–7.484 (d, 4H, ∼9.0 Hz, Ar–H), 9.618 (s, 2H, NHa), 10.024 (s, 2H, NHb). IR spectra (KBr pellet): 3416 cm−1 vs(O–H), 3240 cm−1 vs(N–H), 3056 cm−1 vs(C–H), 1699 cm−1 vs(CO), 657 cm−1 vs(C–Cl).
2d: 1H NMR (600 MHz, DMSO-d6) δ (ppm): 0.906–0.930 (t, 12H, ∼7.2 Hz, TBA-CH3), 1.260–1.321 (m, 8H, TBA-CH2), 1.521–1.569 (m, 8H, TBA-CH2), 3.128–3.156 (t, 8H, ∼8.4 Hz, N+-TBA-CH2), 7.363–7.378 (d, 4H, ∼9.0 Hz, Ar–H), 7.396 (s, 4H, Ar–H), 7.516–7.531 (d, 4H, ∼9.0 Hz, Ar–H), 8.626 (s, 2H, NHa), 8.806 (s, 2H, NHb). IR spectra (KBr pellet): 3426 cm−1 vs(O–H), 3246 cm−1 vs(N–H), 3056 cm−1 vs(C–H), 1699 cm−1 vs(CO), 520 cm−1 vs(C–Br).
1e: 1H NMR (600 MHz, DMSO-d6) δ (ppm): 0.915–0.940 (t, 12H, ∼7.2 Hz, TBA-CH3), 1.269–1.330 (m, 8H, TBA-CH2), 1.529–1.581 (m, 8H, TBA-CH2), 3.139–3.167 (t, 8H, ∼8.4 Hz, N+-TBA-CH2), 7.228–7.243 (d, 4H, ∼9.0 Hz, Ar–H), 7.421 (s, 4H, Ar–H), 7.618–7.633 (d, 4H, ∼9.0 Hz, Ar–H), 10.116 (s, 2H, NHa), 10.435 (s, 2H, NHb). IR spectra (KBr pellet): 3428 cm−1 vs(O–H), 3240 cm−1 vs(N–H), 3058 cm−1 vs(C–H), 1699 cm−1 vs(CO), 656 cm−1 vs(C–Cl).
4.3. Crystallographic refinement details
The crystallographic refinement details of all anion complexes 1a–1e and 2a–2d of para-phenylenediamine based linear receptors L1 and L2 are given in Tables 3 and 4, respectively. A particular crystal of suitable size was selected from the mother liquor, immersed in silicone oil, mounted on the tip of a glass fibre and cemented using epoxy resin. The crystallographic intensity data were collected using Supernova, single source at offset, Eos diffractometer using Mo-Kα radiation (λ = 0.71073 Å), equipped with CCD area detector. The corresponding data refinement and cell reduction were performed by CrysAlisPro.56 Data integration and reduction were made with SAINT and XPREP57 software and multi-scan empirical absorption corrections were applied to the data using SADABS program.58 All crystal structures were solved by direct methods using SHELXTL-2014 and were refined on F2 by the full-matrix least-squares technique via SHELXL-2014 program package.59 Graphics for structural diagrams were generated using MERCURY 2.3 (ref. 60) for Windows. All non-hydrogen atoms were refined anisotropically and the hydrogen atoms attached to all carbon atoms of respective crystal structures were geometrically fixed, while the positional and temperature factors were refined isotropically. The hydrogen atoms were located on difference Fourier maps and refined wherever possible, and were geometrically fixed in other cases. Structural illustrations were drawn with ORTEP-3 for Windows.61 Crystallographic non-covalent interactions data are summarized in Table S1 (ESI†).| Parameters | 1a | 1b | 1c | 1d | 1e |
|---|---|---|---|---|---|
| Formula | C52H88N6O2Cl2Br2 | C54H90N6O8Cl2 | C56H94N6O6Cl2 | C72H104N10O8Cl4S | C52H92N6O10Cl2P2 |
| F w | 1059.98 | 1022.22 | 1018.27 | 1411.51 | 1094.16 |
| Crystal system | Monoclinic | Triclinic | Monoclinic | Monoclinic | Triclinic |
| Space group | P21/n′ |
P |
P21/c | P21/c |
P |
| a/Å | 8.9461(6) | 8.4539(7) | 13.2862(6) | 18.1061(11) | 8.4459(5) |
| b/Å | 16.1753(10) | 10.2145(8) | 16.5740(8) | 13.5141(7) | 11.6202(10) |
| c/Å | 20.8774(17) | 18.1488(15) | 28.0803(13) | 17.5192(9) | 15.6367(11) |
| α/° | 90.00 | 92.095(7) | 90.00 | 90.00 | 82.597(7) |
| β/° | 100.396(8) | 99.967(7) | 93.874(5) | 111.113(6) | 83.548(5) |
| γ/° | 90.00 | 107.977(7) | 90.00 | 90.00 | 86.964(6) |
| V/Å3 | 2971.5(4) | 1461.4(2) | 6169.3(5) | 3999.0(4) | 1511.05(19) |
| Z | 2 | 1 | 4 | 2 | 1 |
| D c/g cm−3 | 1.185 | 1.165 | 1.096 | 1.172 | 1.202 |
| μ Mo Kα/mm−1 | 1.494 | 0.165 | 0.154 | 0.230 | 0.217 |
| F000 | 1124.0 | 554.0 | 2216.0 | 1508.0 | 590.0 |
| T/K | 298(2) | 298(2) | 298(2) | 298(2) | 298(2) |
| θ max. | 25.000 | 24.999 | 24.999 | 25.000 | 24.999 |
| Total no. of reflections | 11![[thin space (1/6-em)]](https://www.rsc.org/images/entities/char_2009.gif) 706 706 |
9820 | 25218 |
17306 |
10428 |
| Independent reflections | 5232 | 5119 | 10858 |
7031 | 5307 |
| Observed reflections | 2896 | 2468 | 5267 | 4069 | 3542 |
| Parameters refined | 293 | 338 | 642 | 453 | 331 |
| R 1, I > 2σ(I) | 0.0655 | 0.0853 | 0.0797 | 0.0683 | 0.0640 |
| wR2, I > 2σ(I) | 0.1767 | 0.2052 | 0.1791 | 0.1422 | 0.1684 |
| GOF (F2) | 1.119 | 0.998 | 1.179 | 1.083 | 0.871 |
| CCDC no. | 1860326 | 1860327 | 1860328 | 1860329 | 1860330 |
| Parameters | 2a | 2b | 2c | 2d |
|---|---|---|---|---|
| Formula | C52H88N6O2Cl2Br2 | C52H88N6O8Br4 | C56H94N6O6Br2 | C58H104N6O12Br2S2 |
| F w | 1059.98 | 1148.88 | 1107.17 | 1329.41 |
| Crystal system | Monoclinic | Monoclinic | Monoclinic | Triclinic |
| Space group | P21/n | P21/n | P21/c |
P |
| a/Å | 9.0143(6) | 8.9473(16) | 13.2635(9) | 8.2364(9) |
| b/Å | 15.6469(17) | 16.101(4) | 16.5661(12) | 10.9069(14) |
| c/Å | 21.0997(15) | 21.153(4) | 28.231(3) | 20.0064(17) |
| α/° | 90.00 | 90.00 | 90.00 | 85.053(8) |
| β/° | 98.821(7) | 100.90(2) | 93.852(7) | 79.089(8) |
| γ/° | 90.00 | 90.00 | 90.00 | 81.371(10) |
| V/Å3 | 2940.8(4) | 2992.3(10) | 6189.1(8) | 1741.7(3) |
| Z | 2 | 2 | 4 | 1 |
| D c/g cm−3 | 1.197 | 1.275 | 1.188 | 1.268 |
| μ Mo Kα/mm−1 | 1.509 | 2.729 | 1.358 | 1.283 |
| F000 | 1124.0 | 1196.0 | 2360.0 | 706.0 |
| T/K | 298(2) | 298(2) | 298(2) | 298(2) |
| θ max. | 24.998 | 24.998 | 24.999 | 24.998 |
| Total no. of reflections | 12250 |
11098 |
25495 |
12265 |
| Independent reflections | 5174 | 5147 | 10864 |
6100 |
| Observed reflections | 3780 | 2196 | 7625 | 4133 |
| Parameters refined | 294 | 293 | 642 | 378 |
| R 1, I > 2σ(I) | 0.0818 | 0.0777 | 0.0743 | 0.0922 |
| wR2, I > 2σ(I) | 0.1850 | 0.1773 | 0.1560 | 0.1801 |
| GOF (F2) | 1.154 | 1.183 | 1.001 | 1.147 |
| CCDC no. | 1860331 | 1860332 | 1860333 | 1860334 |
4.4. Hirshfeld surface analysis
The Hirshfeld surfaces (HSs) and 2D fingerprint plots (FPs) are built based on electron distribution calculated by the sum of spherical atom electron densities and obtained from the results of single crystal X-ray analysis. The Hirshfeld surface surrounding a molecule is well-defined by points where the electron density contribution from a molecule of interest is equivalent to the contribution from all the other molecules. Subsequently, two distances are defined for this point on the isosurface: de, distance from the point to the nearest nucleus external to the surface, and di, the distance to the nearest nucleus internal to the surface. The normalized contact distance dnorm is the ratio of the distances of any surface point to the nearest interior (di) and exterior (de) atom and the van der Waals radii of the atoms, which is given by eqn (1). This term shortens the effective detection of regions of particular importance to intermolecular interactions.62| dnorm = {(di − rvdwi)/rvdwi} + {(de − rvdwe)/rvdwe} | (1) |
Note that, the value of dnorm can be negative, positive or zero. Negative dnorm value indicates that the sum of di and de is shorter than the sum of relevant vdW radii, which is considered to be the closest contact and is visualized as red color in HSs. White colour denotes intermolecular distances close to vdW contacts with dnorm equal to zero. The contact distances longer than the sum of vdW radii, with positive dnorm values, are coloured with blue. The combination plot of divs. de denotes the 2D fingerprint plot that distinguishes the different existing intermolecular interactions. The HSs mapped with dnorm and the corresponding 2D FPs of all anion-receptor complexes are presented in Fig. 5, and the percentage contact contributions from dnorm surface areas are summarized in Table 2, which were generated using Crystal Explorer 3.1.63
Conflicts of interest
There are no conflicts to declare.Acknowledgements
This work was supported by CSIR and SERB through grant 01/2727/13/EMR-II and SR/S1/OC-62/2011, New Delhi, India. CIF IIT Guwahati and DST-FIST for providing instrument facilities. U.M. thanks IIT Guwahati for fellowship.Notes and references
- J. W. Steed and J. L. Atwood, Supramolecular Chemistry, John Wiley & Sons, Ltd., New York, 2009 Search PubMed.
- R. Martinez-Manez and F. Sancenon, Chem. Rev., 2003, 103, 4419 CrossRef CAS PubMed.
- P. A. Gale, Coord. Chem. Rev., 2003, 240, 191 CrossRef CAS.
- P. R. Edwards, J. R. Hiscock, P. A. Gale and M. E. Light, Org. Biomol. Chem., 2010, 8, 100 RSC.
- E. A. Katayev, Y. A. Ustynyuk and J. L. Sessler, Coord. Chem. Rev., 2006, 250, 3004 CrossRef CAS.
- P. R. Edwards, J. R. Hiscock and P. A. Gale, Tetrahedron Lett., 2009, 50, 4922 CrossRef CAS.
- J. W. Steed, Chem. Soc. Rev., 2009, 38, 506 RSC.
- J. W. Pflugrath and F. A. Quiocho, Nature, 1985, 314, 257 CrossRef CAS PubMed.
- Z. Wang, H. Luecke, N. Yao and F. A. Quiocho, Nat. Struct. Biol., 1997, 4, 519 CrossRef CAS PubMed.
- U. Manna, B. Nayak, M. N. Hoque and G. Das, CrystEngComm, 2016, 18, 5036 RSC.
- M. N. Hoque, U. Manna and G. Das, Supramol. Chem., 2016, 28, 284 CrossRef CAS.
- J. L. Sessler, D. E. Gross, W.-S. Cho, V. M. Lynch, F. P. Schmidtchen, G. W. Bates, M. E. Light and P. A. Gale, J. Am. Chem. Soc., 2006, 128, 12281 CrossRef CAS PubMed.
- P. A. Gale, J. L. Sessler, V. Král and V. Lynch, J. Am. Chem. Soc., 1996, 118, 5140 CrossRef CAS.
- P. Anzenbacher, A. C. Try, H. Miyaji, K. Jursíková, V. M. Lynch, M. Marquez and J. L. Sessler, J. Am. Chem. Soc., 2000, 122, 10268 CrossRef CAS.
- P. A. Gale, N. Busschaert, C. J. E. Haynes, L. E. Karagiannidis and I. L. Kirby, Chem. Soc. Rev., 2014, 43, 205 RSC.
- M. Wenzel, J. R. Hiscock and P. A. Gale, Chem. Soc. Rev., 2012, 41, 480 RSC.
- P. A. Gale, Chem. Soc. Rev., 2010, 39, 3746 RSC.
- C. Caltagirone and P. A. Gale, Chem. Soc. Rev., 2009, 38, 520 RSC.
- P. A. Gale, S. E. García-Garrido and J. Garric, Chem. Soc. Rev., 2008, 37, 151 RSC.
- T. Gunnlaugsson, M. Glynn, G. M. Tocci, P. E. Kruger and F. M. Pfeffer, Coord. Chem. Rev., 2006, 250, 3094 CrossRef CAS.
- Z. Xu, S. K. Kim and J. Yoon, Chem. Soc. Rev., 2010, 39, 1457 RSC.
- S. Ayoob and A. K. Gupta, Crit. Rev. Environ. Sci. Technol., 2006, 36, 433 CrossRef CAS.
- A. S. McCall, C. F. Cummings, G. Bhave, R. Vanacore, A. Page-McCaw and B. G. Hudson, Cell, 2014, 15, 1380 CrossRef PubMed.
- M. C. Barth and A. T. Church, J. Geophys. Res.: Space Phys., 1999, 104, 30231 CrossRef CAS.
- W. D. Heizer, R. S. Sandler, E. Seal, S. C. Murrai, M. G. Busby, B. G. Schliebe and S. N. Pusek, Dig. Dis. Sci., 1997, 42, 1055 CrossRef CAS PubMed.
- T. H. Milby and R. C. Baselt, Am. J. Ind. Med., 1999, 35, 192 CrossRef CAS PubMed.
- International Panel on Climate Change, Climate Change 2007: Synthesis Report, Cambridge University Press, Cambridge, U.K., 2007 Search PubMed.
- G. A. Olah, A. Goeppert and G. K. S. Prakash, J. Org. Chem., 2009, 74, 487 CrossRef CAS PubMed.
- S. K. Dey, A. Basu, R. Chutia and G. Das, RSC Adv., 2016, 6, 26568 RSC.
- R. Dutta and P. Ghosh, Chem. Commun., 2014, 50, 10538 RSC.
- U. Manna, S. Halder and G. Das, Cryst. Growth Des., 2018, 18, 1818 CrossRef CAS.
- U. Manna and G. Das, Cryst. Growth Des., 2018, 18, 3138 CrossRef CAS.
- U. Manna and G. Das, CrystEngComm, 2018, 20, 3741 RSC.
- U. Manna and G. Das, CrystEngComm, 2018, 20, 4406 RSC.
- S. J. Brooks, P. A. Gale and M. E. Light, Chem. Commun., 2005, 4696 RSC.
- S. J. Brooks, P. A. Gale and M. E. Light, CrystEngComm, 2005, 7, 586 RSC.
- S. J. Brooks, P. R. Edwards, P. A. Gale and M. E. Light, New J. Chem., 2006, 30, 65 RSC.
- S. J. Moore, C. J. E. Haynes, J. González, J. L. Sutton, S. J. Brooks, M. E. Light, J. Herniman, G. J. Langley, V. Soto-Cerrato, R. Perez-Tomás, I. Marques, P. J. Costa, V. Fèlix and P. A. Gale, Chem. Sci., 2013, 4, 103 RSC.
- D. A. Jose, D. K. Kumar, B. Ganguly and A. Das, Org. Lett., 2004, 6, 3445 CrossRef CAS PubMed.
- R. Li, Y. Zhao, S. Li, P. Yang, X. Huang, X.-J. Yang and B. Wu, Inorg. Chem., 2013, 52, 5851 CrossRef CAS PubMed.
- G. Xu and M. A. Tarr, Chem. Commun., 2004, 1050 RSC.
- F. Otón, A. Tárraga, M. D. Velasco, A. Espinosa and P. Molina, Chem. Commun., 2004, 1658 RSC.
- U. Manna, B. Nayak and G. Das, Cryst. Growth Des., 2016, 16, 7163 CrossRef CAS.
- U. Manna, S. Kayal, B. Nayak and G. Das, Dalton Trans., 2017, 46, 11956 RSC.
- U. Manna, R. Chutia and G. Das, Cryst. Growth Des., 2016, 16, 2893 CrossRef CAS.
- U. Manna, S. Kayal, S. Samanta and G. Das, Dalton Trans., 2017, 46, 10374 RSC.
- U. Manna and G. Das, CrystEngComm, 2017, 19, 5622 RSC.
- T. Gunnlaugsson, P. E. Kruger, P. Jensen, F. M. Pfeffer and G. M. Hussey, Tetrahedron Lett., 2003, 44, 8909 CrossRef CAS.
- S. J. Brooks, S. E. Garcia-Garrido, M. E. Light, P. A. Cole and P. A. Gale, Chem. - Eur. J., 2007, 13, 3320 CrossRef CAS PubMed.
- S. J. Brooks, P. A. Gale and M. E. Light, Chem. Commun., 2006, 4344 RSC.
- I. Ravikumar and P. Ghosh, Chem. Commun., 2010, 46, 1082 RSC.
- R. Chutia and G. Das, Dalton Trans., 2014, 43, 15628 RSC.
- S. K. Dey, R. Chutia and G. Das, Inorg. Chem., 2012, 51, 1727 CrossRef CAS PubMed.
- J. McKinnon, A. S. Mitchell and M. A. Spackman, Chem. – Eur. J., 1998, 4, 2136 CrossRef CAS.
- T. E. Clark, M. Makha, A. N. Sobolev and C. L. Raston, Cryst. Growth Des., 2008, 8, 890 CrossRef CAS.
- CrysAlisPro, version 1171.33.34d, Oxford Diffraction Ltd. [release 27-02-2009 CrysAlis 171. NET] Search PubMed.
- SMART, SAINT, and XPREP, Siemens Analytical X-ray Instruments Inc., Madison, WI, 1995 Search PubMed.
- G. M. Sheldrick, SADABS, Program for area detector adsorption correction, Institute for Inorganic Chemistry; University of Göttingen, Germany, 1996 Search PubMed.
- G. M. Sheldrick, Crystal structure refinement with SHELXL, Acta Crystallogr., Sect. C: Struct. Chem., 2015, 71, 3 Search PubMed.
- Mercury 2.3 Supplied with Cambridge Structural Database; CCDC: Cambridge, U.K., 20011 .
- J. Farrugia, ORTEP-3 for windows - a version of ORTEP-III with a graphical user interface (GUI), J. Appl. Crystallogr., 1997, 30, 565 CrossRef.
- A. Spackman and J. J. McKinnon, CrystEngComm, 2002, 4, 378 RSC.
- S. K. Wolff, D. J. Grimwood, J. J. McKinnon, M. J. Turner, D. Jayatilaka and M. A. Spackman, CrystalExplorer 3.1, University of Western Australia, Crawley, Western Australia, 2005–2013, http://hirshfeldsurface.net/CrystalExplorer Search PubMed.
Footnote |
| † Electronic supplementary information (ESI) available: Characterization data for the receptors L1 and L2 and their anion complexes 1a–1e and 2a–2d, IR spectra, 1H NMR studies in the solution state, distance vs. angle plots, and a hydrogen-bonding data table. CCDC 1860326–1860334. For ESI and crystallographic data in CIF or other electronic format see DOI: 10.1039/c8ce01558a |
| This journal is © The Royal Society of Chemistry 2019 |