 Open Access Article
Creative Commons Attribution 3.0 Unported Licence
Isothermal amplification of specific DNA molecules inside giant unilamellar vesicles†
Yusuke
Sato‡
 *a,
Ken
Komiya
 b,
Ibuki
Kawamata
 a,
Satoshi
Murata
a and
Shin-ichiro M.
Nomura
 *a
*a
aDepartment of Robotics, Tohoku University, Miyagi 980-8579, Japan. E-mail: sato.y.cf@m.titech.ac.jp; nomura@molbot.mech.tohoku.ac.jp
bDepartment of Computer Science, Tokyo Institute of Technology, Kanagawa 226-8502, Japan
First published on 9th July 2019
Abstract
An isothermal amplification circuit for specific DNA molecules was implemented in giant unilamellar vesicles. Using this circuit, over 5000-fold amplification of output DNAs was achieved, and the amplification behaviour depended on the concentration of input signal DNAs in a cell-sized compartment. Moreover, initiation of the amplification by photo-stimulation was demonstrated.
In living organisms, biochemical reactions that regulate various biological functions occur in enclosed environments within the lipid membrane. A giant unilamellar vesicle (GUV) is widely used as a suitable model of a cell-sized compartment because of its overall similarity to biomembranes and well-established preparation methods.1 In particular, encapsulation of biochemical components into GUVs has been explored as a feasible approach to create models of biological systems for synthetic biology or artificial cell studies.2 The GUV-based artificial biological systems that exhibit gene expression using synthetic gene-circuits,2f drug delivery,2g and artificial evolution of a protein1c have been constructed through bottom-up approaches from the molecular level.
In such an approach, DNA is one of the promising materials for the construction of molecular logic circuits or designed biochemical reactions owing to their sequence-specific hybridisation.3 This feature allows the construction of artificial molecular systems that are able to determine their own behaviour based on a molecular reaction regulated by DNA signals or other external stimuli. Indeed, previous studies had reported the programmable behaviour of systems in response to DNA signals;4 for example, cargo release from lipid vesicles through DNA nanopores,4a DNA-based protein assembly,4b and control of conformational change of GUVs using DNA clutch.4c However, these molecular systems cannot be effectively controlled by the low signal DNA concentrations required by the system. The amplification circuit of DNAs can overcome this limitation.
Amplification of DNA in lipid vesicles has been achieved using the polymerase chain reaction (PCR);5 however, PCR requires repetitive thermal cycles over a high temperature range, which often induces damage to the delicate biomolecules constituting biological systems. Isothermal amplification techniques6 provide an alternative method for signal DNA amplification, and have been used in test tubes or water-in-oil droplets for the detection/quantification of a target DNA and production of genome-like long DNA.6,7 Torino et al.8 had reported the isothermal replication of 85-bp DNA inside lipid vesicles using thermostable proteins at 65 °C for building cell-like structures. Okano et al.9 had reported the isothermal amplification of T4 phage DNA at 45 °C using a random primer inside GUVs to induce osmotic stress. However, the amplification process in GUVs, at a physiological temperature of 37 °C, for DNAs with a specific sequence that are applicable as signals, has not been reported to date.
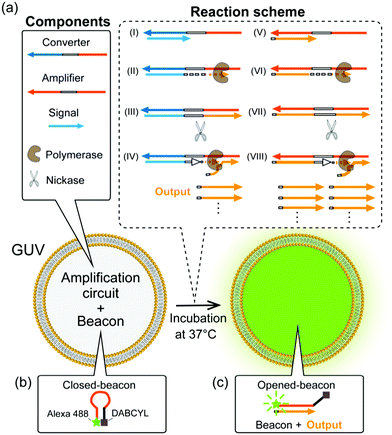
We herein report the isothermal amplification of DNA with a specific sequence, achieved in GUVs, at a physiological temperature of 37 °C. A schematic illustration of the amplification circuit is shown in Fig. 1. In brief, amplification begins with hybridisation of the signal and converter DNAs (Fig. 1a(I)). The hybridised signal DNA is then elongated on the converter DNA by DNA polymerase (Fig. 1a(II)), and the recognition site in the elongated part is cut by the nickase (Fig. 1a(III)). Consequently, the cut DNA detaches from the converter DNA when the DNA polymerase again elongates the signal DNA (Fig. 1a(IV)). As a result, “output” DNAs are produced, serving as output signals, which hybridise to amplifier DNA (Fig. 1a(V)). The amplifier DNA has complementary sequences to that of the output DNA at both sides of the recognition site. The output DNA is then further amplified, since the enzymatic reaction on the amplifier DNA is similar to that on the converter DNA (Fig. 1a(VI)–(VIII)). Through the above reactions, output DNAs are exponentially amplified upon triggering, from only a small quantity of signal DNA at physiological temperature (Fig. S1, ESI†). Although the use of amplifier DNA allows efficient amplification, it also causes non-specific amplification in the absence of the signal DNA (Fig. S2, ESI†). Thus, to suppress such leaky amplification, locked nucleic acids were introduced in the amplifier.10
A beacon DNA probe, labelled with a fluorophore (Alexa 488) and a quencher (DABCYL) at both ends, was used to detect amplification (Fig. 1b and c). When the beacon forms a hairpin shape in the closed state, it exhibits weak fluorescence due to the proximity between the fluorophore and quencher (Fig. 1b), whereas hybridisation with the output DNA opens the beacon, thereby increasing the fluorescence intensity (FI) (Fig. 1c and Fig. S3, ESI†). The DNA sequences and detailed compositions of the amplification circuit are shown in Tables S1 and S2 in the ESI.†
The amplification circuit was encapsulated into GUVs composed of 1,2-dioleoyl-sn-glycero-3-phosphocholine (DOPC)![[thin space (1/6-em)]](https://www.rsc.org/images/entities/char_2009.gif) :
:![[thin space (1/6-em)]](https://www.rsc.org/images/entities/char_2009.gif) cholesterol at a molar ratio of 9
cholesterol at a molar ratio of 9![[thin space (1/6-em)]](https://www.rsc.org/images/entities/char_2009.gif) :
:![[thin space (1/6-em)]](https://www.rsc.org/images/entities/char_2009.gif) 1 by a water-in-oil emulsion transfer method.1b,c The prepared GUVs, whose membranes contained rhodamine B-labelled lipids, were deposited onto a glass slide and observed using a confocal laser-scanning microscope with a stage incubator at 37 °C.
1 by a water-in-oil emulsion transfer method.1b,c The prepared GUVs, whose membranes contained rhodamine B-labelled lipids, were deposited onto a glass slide and observed using a confocal laser-scanning microscope with a stage incubator at 37 °C.
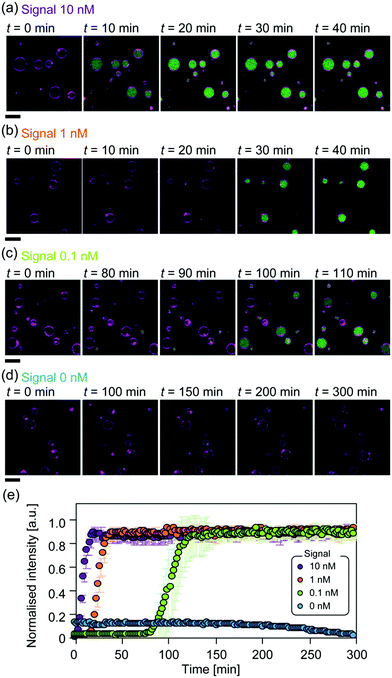
An increase in green FI was detected in the GUVs, indicating the successful production and amplification of output DNAs from the signal DNA (Fig. 2). The average FI with respect to time at each signal concentration is shown in Fig. 2e. The FI reached a plateau in a sigmoidal curve, typical of an exponential increase in the presence of the signal. Since the concentration of beacon DNA was 500 nM, the fact that FI reached a plateau indicates that over 50-, 500-, and 5000-fold amplification of the output DNAs was achieved at signal concentrations of 10 nM, 1 nM, and 0.1 nM, respectively. The FI increases in GUVs were detected at highly similar time points, with a signal concentration of 10 nM or 1 nM, based on microscopic observations (Fig. 2a and b). In contrast, the FI increase in GUVs at a signal concentration of 0.1 nM was detected at various time points (Fig. 2c). This suggests that a lower signal concentration would induce timing fluctuation of amplification initiation in GUVs. Note that no FI increase was observed under the 0 nM signal conditions or for GUVs with a 10 nM signal incubated at 4 °C (Fig. 2d and Fig. S4, ESI†).
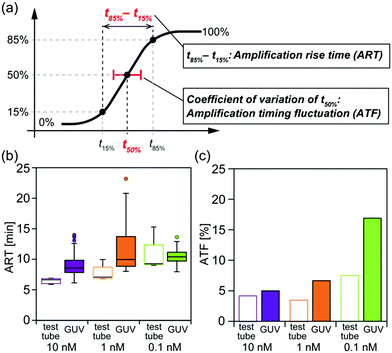
To gain further insights into the amplification behaviour in GUVs, we also conducted the amplification in test tubes, for comparison (Fig. S5 in the ESI†). The obtained data from both GUVs and test tubes were fitted using log–logistic curves11 so as to reduce the measurement noise (see the ESI† for detailed methods). We calculated the amplification rise time (ART) as the median value for the time between reaching an intensity of 85% (t85%) and 15% (t15%) compared to the maximum value, and calculated the amplification timing fluctuation (ATF) as the coefficient of variation of the time at which the intensity reached 50% (t50%) (Fig. 3a).
The median values of ART with signal concentrations of 10, 1, and 0.1 nM were 6.6, 7.1, and 9.3 min in test tubes, and 8.6, 10.0, and 10.4 min in GUVs, respectively (Fig. 3b). These data suggest that ART tends to become larger as the signal concentration decreases. ART differences in GUVs were smaller than in test tubes. The ATF values exhibited a similar trend, showing an increase as the signal concentration decreased (Fig. 3c). Both the ART and ATF values tended to be larger in the GUVs than in test tubes.
Several factors can contribute to the observed signal concentration-dependent differences in the ART and ATF. Regarding the ART, we attributed these differences to the existence of non-triggered converter DNAs with which signal DNAs do not hybridise. In our amplification circuit, amplification of the output DNA initiates on the converter DNA, hybridised to the signal DNA, and further amplification of the output DNA propagates to the amplifier DNA (Fig. 1). At a lower signal concentration, the non-triggered converter DNA that does not produce the output DNA remains in the reaction, resulting in a lower production rate of output DNA in both the test tubes and GUVs to induce a large ART. On the other hand, the differences were not significantly confirmed in GUVs. Compartmentalisation of reaction components into GUVs would hide the signal-dependent differences.
The large ATF obtained for the lower signal concentration could be attributed to the competitive hybridisation between the output DNA and other DNAs. The output DNA can hybridise to not only the beacon DNA or the 3′ end of the amplifier DNA but also the 5′ end of non-triggered converter DNA or amplifier DNA. When this occurs, amplification of the output will not proceed. Thus, hybridisation of the output DNA to the non-triggered converter DNA, whose existence ratio increases as the signal concentration decreases, may cause the large ATF observed.
Moreover, we suspect that the differences between amplification in test tubes and GUVs are largely due to an interaction between lipid membranes and DNAs. We confirmed that the ART and ATF exhibited large values with an increase of the total lipid concentration (Fig. S6, ESI†) when the amplification circuit was mixed in test tubes with large unilamellar vesicles (LUVs) having the same lipid composition as the GUVs. A previous study had indicated that in the presence of divalent cations, DNAs interact with a phospholipid membrane consisting of zwitterionic lipids.12 Under our experimental conditions, the GUV membranes comprised of PC lipids (which are zwitterionic), and 10 mM MgCl2 was included in the amplification reaction. Relatively larger ATF values were obtained in the GUVs at a signal concentration of 0.1 nM compared to those obtained at other concentrations. Although the size of compartments has been reported to affect PCR amplification,5b a relationship between the size of GUVs and amplification timing was not confirmed with 0.1 nM signal (Fig. S7, ESI†). In addition, the number of molecules encapsulated in lipid vesicles has been reported to follow Poisson distribution;13 however, there was no significant number fluctuation in the measurement size-range of GUVs: 0.1 nM signal <3%, converter <0.3%, and amplifier <0.2% (Fig. S8, ESI†). These number fluctuations were much smaller than ATF in GUVs at 0.1 nM signal (Fig. 3c). Taken together, we considered the interaction of DNA and lipid membranes to likely contribute to the larger ART and ATF in GUVs, and to remarkably appear in 0.1 nM concentration.
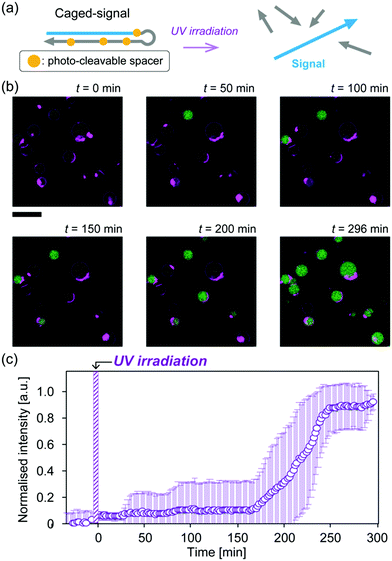
Finally, to demonstrate that our amplification circuit can be initiated by an external stimulation, we employed caged-signal DNA, which is hairpin-shaped DNA with photo-cleavable sites covering the “signal” sequence (Fig. 4a and Fig. S9, ESI†). The cover in the caged-signal is unlocked by ultraviolet (UV) irradiation (Fig. 4a and Fig. S10, ESI†). The caged-signal was encapsulated into the GUVs at a 10 nM concentration. To ensure that the amplification did not occur before UV irradiation, the sample was incubated and observed for 30 min prior to irradiation at 37 °C. After irradiation for 5 min, the FI inside GUVs increased, indicating that the amplification of output DNAs was successfully triggered via photo-stimulation (Fig. 4b). Although the increases in FI with a normal signal of 10 nM (Fig. 2a and e) were detected at similar time points, those generated by 10 nM caged-signal were detected at various time points (Fig. 4b). In addition, the time taken for FI to reach the plateau level was delayed in the caged-signal (Fig. 4c) compared to that with the normal trigger (Fig. 2e). This delay may be due to UV-induced DNA damage and the hybridisation between signal DNAs and fragmented DNAs that covered the signal sequence.
In conclusion, we achieved isothermal amplification of DNA with a specific sequence inside GUVs. Our amplification circuit amplified the output DNAs by over 5000-fold with only 0.1 nM signal DNAs in GUVs. Furthermore, real-time monitoring revealed differences in the amplification behaviour between GUVs and test tubes owing to the interaction between DNA and lipid membranes. Further investigation of the detailed mechanisms underlying the differences mentioned would reveal the effects of compartmentalisation in artificial molecular systems. In addition, the amplification reaction can be triggered by photo-stimulation. Photo-triggered DNA amplification would enable spatiotemporal control of the production and assembly of nanostructures in GUVs, such as the artificial cytoskeleton.14 We believe that our results will become the basis for the creation of novel artificial molecular systems with isothermal DNA amplification function; for instance, in autonomous replication, sustainable growth, and evolution of artificial cells and molecular robots.15
We thank Dr Y. Suzuki for constructive comments and Dr M. Takinoue for providing experimental equipment. This work was supported by JSPS and MEXT KAKENHI (grant numbers JP16J02406, JP15H02774, JP24104003, JP24104004, JP17K18852, and JP18J00720); the ImPACT Program of Council for Science, Technology and Innovation (Cabinet Office, Government of Japan; no. 2016-PM14-13-01); and AMED-CREST 19gm0810001h0105. Y. Sato is a JSPS Research Fellow.
Conflicts of interest
There are no conflicts to declare.Notes and references
- (a) P. Walde, K. Cosentino, H. Engel and P. Stano, ChemBioChem, 2010, 11, 848–865 CrossRef CAS; (b) S. Pautot, B. J. Frisken and D. A. Weitz, Langmuir, 2003, 19, 2870–2879 CrossRef CAS; (c) S. Fujii, T. Matsuura, T. Sunami, T. Nishikawa, Y. Kazuta and T. Yomo, Nat. Protoc., 2014, 9, 1578–1591 CrossRef CAS.
- (a) K. Kurihara, M. Tamura, K. Shoda, T. Toyota, K. Suzuki and T. Sugawara, Nat. Chem., 2011, 3, 775–781 CrossRef CAS; (b) S. M. Nomura, K. Tsumoto, T. Hamada, K. Akiyoshi, Y. Nakatani and L. Yoshikawa, ChemBioChem, 2003, 4, 1172–1175 CrossRef CAS; (c) V. Noireaux and A. Libchaber, Proc. Natl. Acad. Sci. U. S. A., 2004, 101, 17669–17674 CrossRef CAS; (d) N. Ichihashi, T. Matsuura, H. Kita, T. Sunami, H. Suzuki and T. Yomo, Cold Spring Harbor Perspect. Biol., 2010, 10, a004945 Search PubMed; (e) P. Stano, P. Carrara, Y. Kuruma, T. Souza and P. L. Luisi, J. Mater. Chem., 2011, 21, 18887–18902 RSC; (f) K. P. Adamala, D. A. Martin-Alarcon, K. R. Guthrie-Honea and E. S. Boyden, Nat. Chem., 2016, 9, 431–439 CrossRef; (g) Z. Chen, J. Wang, W. Sun, E. Archibong, A. R. Kahkoska, X. Zhang, Y. Lu, F. S. Ligler, J. B. Buse and Z. Gu, Nat. Chem. Biol., 2018, 14, 86–93 CrossRef CAS.
- (a) G. Seelig, D. Soloveichik, D. Y. Zhang and E. Winfree, Science, 2006, 314, 1585–1588 CrossRef CAS; (b) G. Gines, A. S. Zadorin, J.-C. Galas, T. Fujii, A. Estevez-Torres and Y. Rondelez, Nat. Nanotechnol., 2017, 12, 351–359 CrossRef CAS PubMed.
- (a) J. R. Burns, A. Seifert, N. Fertig and S. Howorka, Nat. Nanotechnol., 2016, 11, 152–156 CrossRef CAS; (b) R. P. Chen, D. Blackstock, Q. Sun and W. Chen, Nat. Chem., 2018, 10, 474–481 CrossRef CAS; (c) Y. Sato, Y. Hiratsuka, I. Kawamata, S. Murata and S. M. Nomura, Sci. Robot., 2017, 2, eaal3735 CrossRef; (d) J. J. Keya, R. Suzuki, Arif Md. R. Kabir, D. Inoue, H. Asanuma, K. Sada, H. Hess, A. Kuzuya and A. Kakugo, Nat. Commun., 2018, 9, 453 CrossRef.
- (a) T. Oberholzer, M. Albrizio and P. L. Luisi, Chem. Biol., 1995, 2, 677–682 CrossRef CAS; (b) K. Shoda, M. Tamura, Y. Kageyama, K. Suzuki, A. Suyama and T. Sugawara, Soft Matter, 2011, 7, 3750–3753 RSC.
- (a) T. Notomi, H. Okayama, H. Masubuchi, T. Yonekawa, K. Watanabe, N. Amino and T. Hase, Nucleic Acids Res., 2000, 28, e63 CrossRef CAS; (b) A. Fire and S. Q. Su, Proc. Natl. Acad. Sci. U. S. A., 1995, 92, 4641–4645 CrossRef CAS; (c) G. T. Walker, M. C. Little, J. G. Nadeau and D. D. Shank, Proc. Natl. Acad. Sci. U. S. A., 1992, 89, 392–396 CrossRef CAS.
- (a) L. Mazutis, A. F. Araghi, O. J. Miller, J.-C. Baret, L. Frenz, A. Janoshazi, V. Taly, B. J. Miller, J. B. Hutchison, D. Link, A. D. Griffiths and M. Ryckelynck, Anal. Chem., 2009, 81, 4813–4821 CrossRef CAS; (b) T. D. Rane, L. Chen, H. C. Zec and T.-H. Wang, Lab Chip, 2015, 15, 776–782 RSC.
- D. Torino, C. Del Bianco, L. A. Ross, J. L. Ong and S. S. Mansy, BMC Res. Notes, 2011, 4, 128 CrossRef CAS.
- T. Okano, K. Inoue, K. Koseki and H. Suzuki, ACS Synth. Biol., 2018, 7, 739–747 CrossRef CAS.
- K. Komiya, M. Komori, C. Noda, S. Kobayashi, T. Yoshimura and M. Yamamura, Org. Biomol. Chem., 2019 10.1039/C9OB00521H.
- A.-N. Spiess, C. Feig and C. Ritz, BMC Bioinf., 2008, 9, 221 CrossRef.
- D. H. Mengistu, K. Bohinc and S. May, J. Phys. Chem. B, 2009, 113, 12277–12282 CrossRef CAS.
- P. L. Luisi, M. Allegretti, T. P. de Souza, F. Steiniger, A. Fahr and P. Stano, ChemBioChem, 2010, 11, 1989–1992 CrossRef CAS.
- C. Kurokawa, K. Fujiwara, M. Morita, I. Kawamata, Y. Kawagishi, A. Sakai, Y. Murayama, S. I. M. Nomura, S. Murata, M. Takinoue and M. Yanagisawa, Proc. Natl. Acad. Sci. U. S. A., 2017, 114, 7228–7233 CrossRef CAS.
- (a) M. Hagiya, A. Konagaya, S. Kobayashi, H. Saito and S. Murata, Acc. Chem. Res., 2014, 47, 1681–1690 CrossRef CAS; (b) R. Kawano, ChemPhysChem, 2018, 19, 359–366 CrossRef CAS.
Footnotes |
| † Electronic supplementary information (ESI) available. See DOI: 10.1039/c9cc03277k |
| ‡ Present address: School of Computer Science, Tokyo Institute of Technology, Kanagawa, 226-8502, Japan. |
| This journal is © The Royal Society of Chemistry 2019 |


