 Open Access Article
How well can we predict cluster fragmentation inside a mass spectrometer?†
Monica
Passananti‡
 *a,
Evgeni
Zapadinsky
a,
Tommaso
Zanca
a,
Juha
Kangasluoma
ab,
Nanna
Myllys§
 a,
Matti P.
Rissanen
a,
Theo
Kurtén
c,
Mikael
Ehn
a,
Matti P.
Rissanen
a,
Theo
Kurtén
c,
Mikael
Ehn
 a,
Michel
Attoui
d and
Hanna
Vehkamäki
a
aInstitute for Atmospheric and Earth System Research/Physics, Faculty of Science, University of Helsinki, FI-00014, Finland. E-mail: monica.passananti@helsinki.fi
bAerosol and Haze Laboratory, Beijing Advanced Innovation Center for Soft Matter Science and Engineering, Beijing University of Chemical Technology, 100029 Beijing, China
cInstitute for Atmospheric and Earth System Research/Chemistry, Faculty of Science, University of Helsinki, FI-00014, Finland
dLISA, UMR CNRS 7583, UPEC et UPD, IPSL, 61, av du Général de Gaulle, 94010 Créteil, France
First published on 25th April 2019
Abstract
Fragmentation of molecular clusters inside mass spectrometers is a significant source of uncertainty in a wide range of chemical applications. We have measured the fragmentation of sulfuric acid clusters driving atmospheric new-particle formation, and developed a novel model, based on first principles calculations, capable of quantitatively predicting the extent of fragmentation.
Recent developments in high-resolution mass spectrometry have made possible the direct detection and monitoring of trace gas molecules and molecular clusters at mixing ratios well below one part per trillion (ppt).1,2 This has revolutionized the study of atmospheric and environmental chemical processes,3 such as new-particle formation, and it is also permitting advances in for example exhaled breath analysis4 and explosives detection.5 However, the detection of molecular clusters has so far been associated with large uncertainties due to transformations of the clusters within the mass spectrometers. These transformations include both collision induced cluster fragmentation (CICF) inside the ion optics, and chemical reactions induced by the charging process. Charging-induced reactions can in many cases be modelled by high-level quantum chemistry,6–8 and are also irrelevant in cases where the original sample consists of charged clusters. We thus focus here on the more general, but poorly understood, CICF process. CICF is known to occur both when the sample consists of molecular clusters, and when the sample consists of individual molecules chemically ionized by clustering with a reagent ion (e.g. NO3−). In some cases, CICF has been used to improve the sensitivity of the instruments, inducing fragmentation of clusters formed in the ion source.9 CICF can be quantified by calibration in cases where the concentrations of the sample species can be verified by a non-MS method. Unfortunately, the extremely low (ppt or below) concentrations of many key species especially in atmospheric and environmental applications prevents their quantification by any other methods. Modelling approaches for reliably predicting the extent of CICF are thus urgently needed.
We have recently published the first quantitative model for CICF processes based purely on statistical principles and quantum chemical input data, and demonstrated its behaviour for a single instrument chamber with a uniform pressure.10 In this study, we apply our model to an entire Atmospheric Pressure interface Time Of Flight Mass Spectrometer (APi-TOF-MS), accounting for the pressure gradients between different chambers. We also perform a novel set of experiments, varying key voltages inside the instrument to change the extent of CICF, allowing a direct comparison to, and validation of, our model.
We have chosen the APi-TOF for our testing, as this instrument, especially combined with a Chemical Ionization (CI) inlet, has been the key tool permitting several recent breakthroughs in atmospheric chemistry.3 These include the molecular-level identification of the main chemical species involved in atmospheric new-particle formation (NPF) in different conditions around the world,11,12 as well as the discovery of entirely new types of reaction mechanisms in the atmosphere, which lead to the formation of extremely low-volatility organic compounds.13 Both NPF and organic low-volatility compounds play crucial roles in forming aerosol particles, and thus impact both air quality and global climate.14
To quantify CICF, we first separate the thermal reactions related to charging from the CICF using an ElectroSpray Ionization-Differential Mobility Analyser (ESI-DMA) coupled with the APi-TOF. The experiments and the simulations are both carried out using a medium-sized sample cluster ((H2SO4)2HSO4−). We chose sulfuric acid as our test system as this molecule, and its clusters, play a key role in NPF.15
The APi-TOF (Tofwerk) consists of a Time Of Flight (TOF) mass spectrometer and an Atmospheric Pressure interface (APi) used to guide the ions from ambient pressure into the ultrahigh vacuum of the TOF. The combination of the voltages applied to the APi-TOF is called the voltage configuration of the instrument, and it significantly affects the transmission and fragmentation of clusters.16 In this work, we evaluated how different voltage configurations can affect cluster fragmentation. The experimental set-up, shown in Fig. 1, consists of an ESI source to produce charged clusters, connected to a Hermann DMA,17 which separates clusters based on their size. The exit of the DMA is connected to an electrometer and to the APi-TOF. We use compressed air as carrier gas. This set-up allows to select only one type of clusters (according to its electrical mobility) to enter the APi-TOF. Hereafter we will for simplicity refer to bisulfate ions (HSO4−), negatively charged sulfuric acid dimers (H2SO4HSO4−) and negatively charged sulfuric acid trimers ((H2SO4)2HSO4−) as sulfuric acid monomer (SA)1−, dimer (SA)2− and trimer (SA)3−, respectively.
 | ||
| Fig. 1 A schematic representation of the experimental set-up, an ESI-DMA-APi-TOF. The above drawing is not to scale, in particular the APi-TOF chambers are not in scale to each other. | ||
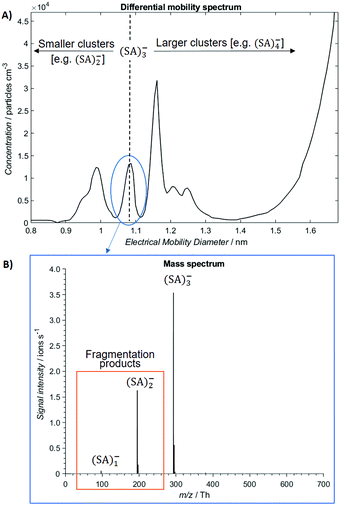
The ion distribution generated by the ESI source and measured by the electrometer after the DMA is shown in Fig. 2A. The peaks have been identified through the MS spectra: the sharp peak at around 1.1 nm of electrical mobility diameter is the sulfuric acid trimer. Due to the low resolution of the Hermann DMA, in the mobility spectrum (Fig. 2A) only the sulfuric acid trimer peak is perfectly separated from the other peaks. The mass spectrum (Fig. 2B) corresponding to the (SA)3− peak at 1.1 nm shows not only the (SA)3− signal, but also peaks at lower masses (SA)2− and (SA)1−, due to fragmentation inside the APi, at the specific voltage configuration that was used. The higher intensity of (SA)2− compared to (SA)1−, indicates that the (SA)3− is mainly fragmented to a charged dimer and a neutral monomer, demonstrated by the kinetic rate constant calculations for all possible fragmentation channels (see ESI†). From a standard configuration (with 30% of (SA)3− fragmentation), other configurations were reached by varying one voltage in the APi one at a time. A schematic representation of the APi is shown in Fig. S1 (ESI†). The percentage of survived sulfuric acid trimers  is defined by the percentage ratio of (SA)3−:
 | ||
| Fig. 2 The differential mobility spectrum of negatively charged sulfuric acid clusters generated by ESI (A). The MS spectrum of sulfuric acid trimer (B). | ||
In our experimental conditions we never observed  (no fragmentation), while for some voltage configurations complete fragmentation
  was reached. We have verified that the observed changes in
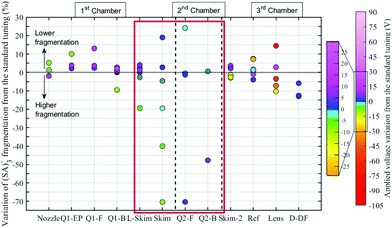
  are due to fragmentation of (SA)3− and not to mass-dependent transmission efficiency changes (see ESI†). Fig. 3 summarizes the effects of the APi's voltages on (SA)3− fragmentation. For each electrode [listed in the x-axis (Fig. 3)] the applied voltage was changed (colour coding) and the deviation of
  from the standard configuration (y-axis) was calculated. Changing the voltages applied to the nozzle (the pinhole of the APi) up to the end of the 1st quadrupole (Q1-B) did not affect the fragmentation significantly. The same trend was observed for the voltages applied to the electrodes in the 3rd chamber (from Skim2 to Deflectors). In all these cases, these voltages affect the (SA)3− fragmentation less than ±15%. The voltages that are crucial to the (SA)3− fragmentation are the ones at the end of the 1st chamber and in the 2nd chamber: Lens Skimmer (L-Skim), Skimmer (Skim), Q2-Front (Q2-F) and Q2-Back (Q2-B). The voltages applied to these electrodes were changed up ±10 V from the standard configuration and (SA)3− fragmentation varied between 10% and 100%. These results are in agreement with the data recently reported in literature which identify the Skimmer and the Q2-Front as the voltages that affect fragmentation.16,18
The details of our statistical model are explained in Zapadinsky et al.10 Briefly, the model describes the trajectory of a charged cluster moving through different electrodes under the electric field defined by the voltage configuration, and along the travel distance the electric field, pressure, flux velocity and temperature change according to the conditions inside the instrument. The cluster undergoes collisions with carrier gas molecules, with the collision frequency depending on the carrier gas pressure and properties. These collisions can lead to fragmentation if sufficient energy is transferred to the cluster. After the collision the cluster, depending on its energy and fragmentation rate, can reach the end of the simulated region, experience another collision or undergo fragmentation.
APi-TOF is often used for environmental measurements, and thus the usual carrier gas is air. Therefore, our experiments were performed in air, and we modelled the carrier gas as a mixture of 79% N2 and 21% O2. The cross-section of the carrier gas strongly affects both the collision and fragmentation probabilities. The effect of carrier gas collision cross section on cluster fragmentation is discussed and reported in the ESI† and in Zapadinsky et al.10 In other fields, e.g. noble gases are often used as carriers, and in this case the model can be accordingly modified to simulate a different carrier gas. In cases where the carrier gas is a polyatomic molecule, e.g. a hydrocarbon, the internal (rotational–vibrational) energy levels of the carrier may also need to be accounted for. Experiments on the effects of carrier gas properties on fragmentation, and comparison with the simulation, will be an object of further studies.
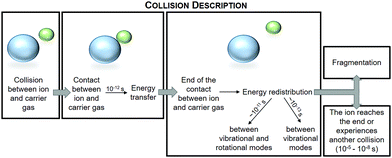
After simulating a statistically significant number of trajectories, we calculate the proportion of fragmented clusters in that particular section of the APi. The crucial part of the model is the description of the energy transfer in collisions (see Fig. 4). It is determined by the conservation laws (energy, momentum and angular momentum) and a probability density function (PDF) defined by the density of states of the cluster. More details on the principle for the calculation of PDFs can be found in the ESI.† The energy-dependent fragmentation rate constant, as well as the density of states of the cluster used to define the fragmentation probability, are based on quantum chemistry calculations (see ESI†).
 | ||
| Fig. 4 A schematic representation of a collision between the charged cluster (blue sphere) and the carrier gas (green sphere), and the energy transfer and redistribution described in the model. | ||
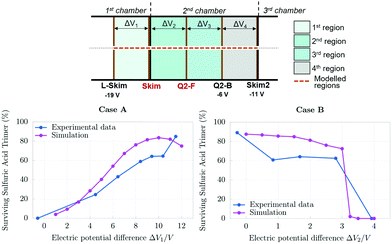
The model reproduces the fragmentation trends observed at the beginning of the first chamber and in the 3rd chamber: in these cases, an increase of the electric field strength does not lead to a significant increase in fragmentation. These results can be explained by the carrier gas density. At the beginning of the 1st chamber the pressure is still high (around 1.5 mbar), and the clusters are not able to reach high velocities because they are slowed down by many collisions with the dense gas. These collisions are thus energetically low, and they do not lead to cluster fragmentation. In the last chamber, clusters can reach high speeds, but they are not fragmented since they are not likely to experience collisions due to the very low pressure. In the 2nd chamber, in particular at the interface between the 1st and the 2nd chamber, clusters are accelerated by the electric field, and they reach high velocities because they experience few collisions with the sparse carrier gas. These collisions occur at energies that often lead to fragmentation. We modelled in detail the region of the APi where the CICF could happen: the region between the Lens Skimmer and Skimmer2. In particular, we studied two cases: (A) only the voltage applied to the Skimmer was varied from −19 V to −7 V (Fig. 5, case A), (B) only the voltage applied to the Q2-Front was varied from −9 V to −5 V (Fig. 5, case B). In both cases, the electric potential difference between the voltages applied at the L-Skim and Skim2 is constant, whereas voltage differences ΔV1 and ΔV2 defined in Fig. 5 change during the experiment A, and ΔV2 and ΔV3 change during the experiment B. The sums (ΔV1 + ΔV2) and (ΔV2 + ΔV3) remain constant, therefore the cluster will accelerate before the Skimmer and decelerate after or vice versa. In general, these electric potential differences define, together with the distance between the electrodes and the pressure, the region where the velocity of the cluster increases, and where it is most likely fragmented. The principles of calculations of the pressure, flux velocity and temperature used in the model, the analysis of the uncertainty in these parameters as well as in other potential sources of error in (SA)3− fragmentation, are reported in the ESI.† The model results are in excellent agreement with the experiments, and they capture the trends of the effects of voltages on the cluster fragmentation. This indicates that the model correctly accounts for CICF inside the APi, and it can be used to retrieve the true concentration of sulfuric acid trimer clusters.
In summary, we studied the fate of (SA)3− inside an APi, both experimentally and theoretically. We combined the APi-TOF with a DMA in order to select negative sulfuric acid trimer clusters produced by ESI,† and systematically measured the effect of the voltages applied to the APi on the cluster fragmentation. We have developed a model for CICF and obtained a good agreement between the model and the experiments. We identified the fragmentation region of the APi to be between the end of the 1st chamber until the end of the 2nd one, however the electrodes that can induce fragmentation are located between the end of the 1st chamber and the beginning of the 2nd one. Our model significantly decreases the uncertainties involved in cluster detection by mass spectrometry. The input data required by the model are the experimental conditions (carrier gas, pressure, applied voltages, etc.), the instrument geometry (distances between the electrodes) and quantum chemical data (structures, binding energies and vibrational frequencies) of the studied clusters.
The model can be applied to any clusters for which the appropriate quantum chemical data have been computed, as well as any instrument in which an ion cluster moves under an electric field (e.g. IMS-MS). It can also assist future instrument development aimed to decrease the fragmentation of weakly bounded compounds.
We acknowledge the ERC Projects 692891-DAMOCLES and 638703-COALA, Academy of Finland, ATMATH Project, for funding, and the CSC-IT Center for Science in Espoo, Finland, for computational resources. N. M. thanks the Jenny and Antti Wihuri foundation for financial support. We thank Tofwerk, in particular Manuel Hutterli for providing useful information of the APi-TOF.
Conflicts of interest
There are no conflicts to declare.Notes and references
- T. Jokinen, M. Sipilä, H. Junninen, M. Ehn, G. Lönn, J. Hakala, T. Petäjä, R. L. Mauldin III, M. Kulmala and D. R. Worsnop, Atmos. Chem. Phys., 2012, 12, 4117–4125 CrossRef CAS.
- H. Junninen, M. Ehn, T. Petäjä, L. Luosujärvi, T. Kotiaho, R. Kostiainen, U. Rohner, M. Gonin, K. Fuhrer, M. Kulmala and D. R. Worsnop, Atmos. Meas. Tech., 2010, 3, 1039–1053 CrossRef CAS.
- M. Kulmala, T. Petäjä, M. Ehn, J. Thornton, M. Sipilä, D. R. Worsnop and V.-M. Kerminen, Annu. Rev. Phys. Chem., 2014, 65, 21–37 CrossRef CAS PubMed.
- A. Romano, S. Doran, I. Belluomo and G. B. Hanna, Anal. Chem., 2018, 90, 10204–10210 CrossRef CAS.
- Y. Hashimoto, Mass. Spectrom., 2017, 6, A0054 CrossRef PubMed.
- C. A. Bauer and S. Grimme, Eur. J. Mass Spectrom., 2015, 21, 125–140 CrossRef CAS.
- N. Hyttinen, R. V. Otkjær, S. Iyer, H. G. Kjaergaard, M. P. Rissanen, P. O. Wennberg and T. Kurtén, J. Phys. Chem. A, 2018, 122, 269–279 CrossRef CAS PubMed.
- I. K. Ortega, T. Olenius, O. Kupiainen-Määttä, V. Loukonen, T. Kurtén and H. Vehkamäki, Atmos. Chem. Phys., 2014, 14, 7995–8007 CrossRef.
- C. Jost, D. Sprung, T. Kenntner and T. Reiner, Int. J. Mass Spectrom., 2003, 223–224, 771–782 CrossRef CAS.
- E. Zapadinsky, M. Passananti, N. Myllys, T. Kurtén and H. Vehkamäki, J. Phys. Chem. A, 2019, 123, 611–624 CrossRef CAS.
- M. Sipilä, N. Sarnela, T. Jokinen, H. Henschel, H. Junninen, J. Kontkanen, S. Richters, J. Kangasluoma, A. Franchin, O. Peräkylä, M. P. Rissanen, M. Ehn, H. Vehkamäki, T. Kurten, T. Berndt, T. Petäjä, D. Worsnop, D. Ceburnis, V.-M. Kerminen, M. Kulmala and C. O’Dowd, Nature, 2016, 537, 532 CrossRef PubMed.
- L. Yao, O. Garmash, F. Bianchi, J. Zheng, C. Yan, J. Kontkanen, H. Junninen, S. B. Mazon, M. Ehn, P. Paasonen, M. Sipilä, M. Wang, X. Wang, S. Xiao, H. Chen, Y. Lu, B. Zhang, D. Wang, Q. Fu, F. Geng, L. Li, H. Wang, L. Qiao, X. Yang, J. Chen, V.-M. Kerminen, T. Petäjä, D. R. Worsnop, M. Kulmala and L. Wang, Science, 2018, 361, 278–281 CrossRef CAS PubMed.
- F. Bianchi, T. Kurtén, M. Riva, C. Mohr, M. P. Rissanen, P. Roldin, T. Berndt, J. D. Crounse, P. O. Wennberg, T. F. Mentel, J. Wildt, H. Junninen, T. Jokinen, M. Kulmala, D. R. Worsnop, J. A. Thornton, N. Donahue, H. G. Kjaergaard and M. Ehn, Chem. Rev., 2019, 119, 3472–3509 CrossRef CAS PubMed.
- J. H. Seinfeld and S. N. Pandis, Atmospheric Chemistry and Physics: From Air Pollution to Climate Change, John Wiley and Sons, Hoboken, 2006 Search PubMed.
- H. Vehkamäki and I. Riipinen, Chem. Soc. Rev., 2012, 41, 5160–5173 RSC.
- F. D. Lopez-Hilfiker, S. Iyer, C. Mohr, B. H. Lee, E. L. D'Ambro, T. Kurtén and J. A. Thornton, Atmos. Meas. Tech., 2016, 9, 1505–1512 CrossRef CAS.
- J. Kangasluoma, M. Attoui, F. Korhonen, L. Ahonen, E. Siivola and T. Petäjä, Aerosol Sci. Technol., 2016, 50, 222–229 CrossRef CAS.
- T. H. Bertram, J. R. Kimmel, T. A. Crisp, O. S. Ryder, R. L. N. Yatavelli, J. A. Thornton, M. J. Cubison, M. Gonin and D. R. Worsnop, Atmos. Meas. Tech., 2011, 4, 1471–1479 CrossRef CAS.
Footnotes |
| † Electronic supplementary information (ESI) available: Chemicals used in the experiments, description of the experimental set-up, fragmentation experiments and transmission measurement, quantum chemistry calculations, fragmentation rate constants and density of states, short description of the model, effect of carrier gas properties, modelling the pressure inside the APi, evaluation of the uncertainties of the simulations. See DOI: 10.1039/c9cc02896j |
| ‡ Present address: Dipartimento di Chimica, Università di Torino, Via Giuria 5, 10125 Torino, Italy. |
| § Present address: Department of Chemistry, University of California, Irvine, California 92697-2025, USA. |
| This journal is © The Royal Society of Chemistry 2019 |


