A bright red-emitting flavonoid for Al3+ detection in live cells without quenching ICT fluorescence†
Chathura S.
Abeywickrama
a,
Keti A.
Bertman
a and
Yi
Pang
 *ab
*ab
aDepartment of Chemistry, University of Akron, Akron, Ohio 44325, USA. E-mail: yp5@uakron.edu
bMaurice Morton Institute of Polymer Science, University of Akron, Akron, Ohio 44325, USA
First published on 22nd May 2019
Abstract
A bright red-emitting flavonoid derivative was synthesized, which exhibited a large Stokes shift (Δλ > 150 nm) and high fluorescence quantum yields (ϕfl = 0.10–0.35). The probe could form a stable complex with Al3+ in 1![[thin space (1/6-em)]](https://www.rsc.org/images/entities/char_2009.gif) :
:![[thin space (1/6-em)]](https://www.rsc.org/images/entities/char_2009.gif) 1 binding stoichiometry, generating a large bathochromic shift in both absorption and fluorescence (Δλ ≈ 70 nm) to enable ratiometric determination of cellular Al3+.
1 binding stoichiometry, generating a large bathochromic shift in both absorption and fluorescence (Δλ ≈ 70 nm) to enable ratiometric determination of cellular Al3+.
As the most abundant metal in the earth's crust, aluminium-based products are widely used in household products (e.g. cooking wares) and constructions materials.1,2 However, a high concentration of Al3+ is toxic to living organisms due to its potential neurotoxicity.3–5 Increased Al3+ levels in the human body can lead to severe disease conditions such as dementia, Alzheimer's disease, Parkinson's disease, Al-related bone diseases (ARBD), encephalopathy, and myopathy.6–11 Therefore, monitoring Al3+ level in the human body will be useful in identifying potential risk of such disease conditions. According to recent World Health Organization (WHO) reports, the recommended daily Al3+ intake is 3–10 mg per day, whereas the recommended Al3+ concentration level in drinking water is below 200 μg L−1.12,13 Therefore, the development of highly sensitive and reliable techniques for the detection of Al3+ level is essential in biological research. Atomic absorption spectroscopy, mass spectrometry, voltammetry, ion selective membranes and liquid chromatography coupled mass spectrometry are commonly used for detecting Al3+ ions in aqueous solutions.14–17 However, these methods are not suitable for cellular studies.
Fluorescent sensors for Al3+ detection in an aqueous environment have gained more attention recently, due to their high sensitivity and selectivity.18–24 However, the most challenging step is to identify a suitable ligand for Al3+ binding, due to the strong hydration of the Al3+ cation.18 The current designs of fluorescent Al3+ probes utilize chelating groups such as hydrazides, Schiff bases, urea/thiourea conjugates and pyrene–amino acid conjugates for Al3+ binding. However, the currently reported Al3+ probes suffer from major drawbacks, including their characteristic blue emission, small Stokes shifts, poor chemical stability in aqueous environments, low biocompatibility and higher energy excitation, which limit their applications in biological environments.18–21,25–30 Therefore, it is desirable to develop red-emitting, highly biocompatible probes with large Stokes shifts for bio-imaging applications.
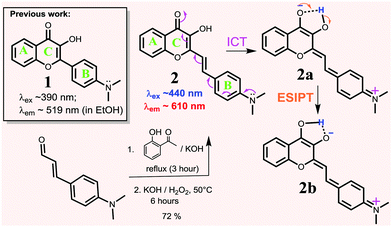
Flavonoids are a class of naturally occurring dyes, which often exhibit beneficial biological properties and find uses as anti-oxidants,31–35 anti-inflammatory agents,35,36 anti-microbial drugs,33,37 and anti-cancer drugs.38–42 Due to their low toxicity and environmentally sensitive fluorescence with a large Stokes shift (Δλ ≈ 100–150 nm),43 flavonoids have been used in the design of fluorescent chemical sensors for proteins,44 cations,45 and other biological imaging applications.44,46,47 However, the existing flavonoid probes have limited conjugation, which typically show fluorescence in the blue and green region, since many of them are based on the structure of 1. In order to overcome this barrier, we now report the synthesis of flavonoid derivative 2, in which a vinyl bond is inserted between the B and C rings for extended conjugation and intramolecular charge transfer (ICT) interaction. The result showed that the strategy effectively shifted the λabs and λem of 2 to a longer wavelength, giving bright red-emission (λem ≈ 610 nm in EtOH) with a large Stokes shift (Δλ ≈ 150 nm) (Scheme 1). In addition, 2 also exhibited a large spectral response upon binding with Al3+ in aqueous environments, showing its potential in detecting Al3+ in biological environments.
Flavonoid derivative 2 was synthesized according to the previously reported procedure47 in good yield (Scheme 1) and characterized by 1H NMR and 13C NMR spectroscopy, melting point determination and high-resolution mass spectrometry (ESI,† Fig. S1 and S2).
Spectroscopic properties. The spectroscopic properties of 2 were examined in different solvents (Table 1 and ESI,† Fig. S3). The absorption λabs of 2 was affected slightly by solvent polarity (Δλ ≈ 14 nm, Table 1 and ESI,† Fig. S3), in sharp contrast to 1 whose absorption λabs was affected by Δλ ≈ 45 nm.47 However, the emission spectra of 2 displayed a large solvatochromic effect, with emission λem shifting from 528 nm (in toluene) to 640 nm (in water). This can be explained by the relative stability of the polar ICT-transition state complex of probe 2 in different solvents. On the basis of the observed large Stokes shift (e.g. Δλ ≈ 175 nm in EtOH), the emission was assumed to arise from the ESIPT process that was coupled with ICT (Scheme 2). Interestingly, the emission of 2 was very weak in aqueous solutions (ϕfl = 0.008) but became strong in non-aqueous solutions (ϕfl ≈ 0.34 in acetonitrile). Therefore, probe 2 retained the valuable environmentally sensitive fluorescence of 1, while extending the emission to a longer wavelength.
| Solvent | λ abs (nm) | λ em (nm) | ϕ fl | Δλ (cm−1) | Δλ (nm) | ε (M−1 cm−1) |
|---|---|---|---|---|---|---|
| Toluene | 437 | 528 | 0.11 | 3944 | 91 | 27![[thin space (1/6-em)]](https://www.rsc.org/images/entities/char_2009.gif) 260 260 |
| DCM | 440 | 567 | 0.14 | 5091 | 127 | 28![[thin space (1/6-em)]](https://www.rsc.org/images/entities/char_2009.gif) 235 235 |
| Acetonitrile | 432 | 588 | 0.37 | 6141 | 156 | 26![[thin space (1/6-em)]](https://www.rsc.org/images/entities/char_2009.gif) 100 100 |
| THF | 431 | 561 | 0.21 | 5377 | 130 | 24![[thin space (1/6-em)]](https://www.rsc.org/images/entities/char_2009.gif) 395 395 |
| DMSO | 444 | 595 | 0.33 | 5716 | 151 | 28![[thin space (1/6-em)]](https://www.rsc.org/images/entities/char_2009.gif) 543 543 |
| DMF | 438 | 589 | 0.32 | 5853 | 151 | 29![[thin space (1/6-em)]](https://www.rsc.org/images/entities/char_2009.gif) 173 173 |
| EtOH | 438 | 613 | 0.24 | 6518 | 175 | 29![[thin space (1/6-em)]](https://www.rsc.org/images/entities/char_2009.gif) 460 460 |
| MeOH | 439 | 621 | 0.24 | 6676 | 182 | 27![[thin space (1/6-em)]](https://www.rsc.org/images/entities/char_2009.gif) 316 316 |
| Water | 430 | 640 | 0.008 | 7631 | 210 | 16![[thin space (1/6-em)]](https://www.rsc.org/images/entities/char_2009.gif) 306 306 |
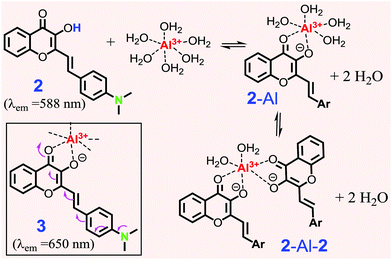 | ||
| Scheme 2 Proposed formation of the Al3+ complex with 2. Structure 3 shows enhanced ICT in the complex. | ||
Low temperature fluorescence. In order to evaluate the extent of the ICT effect, a sample of 2 (in EtOH) was frozen quickly by immersing it into liquid nitrogen in a quartz Dewar. At an extremely low temperature (i.e., −189 °C), the molecule of 2 was frozen in a rigid solvent matrix (m.p. of EtOH: −112 °C), which restricted the molecular motion and bond changes that are associated with the ESIPT/ICT process. As a consequence, the emission λem was observed at 541 nm (Fig. 1), which could be attributed to its locally excited state. When the temperature was increased to room temperature, the emission peak was red-shifted towards 612 nm, as molecular motion became possible, enabling the ESIPT/ICT process. The observed large spectral shift (Δλem ≈ 70 nm from 541 nm to ∼612 nm) provided experimental evidence, supporting the assumption that the ESIPT/ICT process played an important role in the emission of 2 occurring at a longer wavelength.
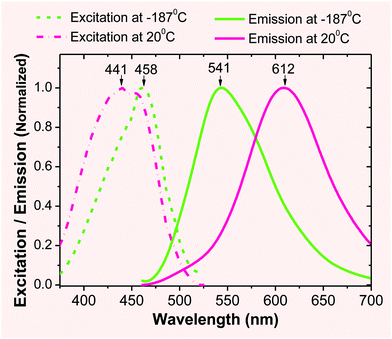 | ||
| Fig. 1 Excitation (broken line) and fluorescence (solid line) spectra of 2 (1 × 10⁻⁶ M) in EtOH at different temperatures. | ||
Al
3+
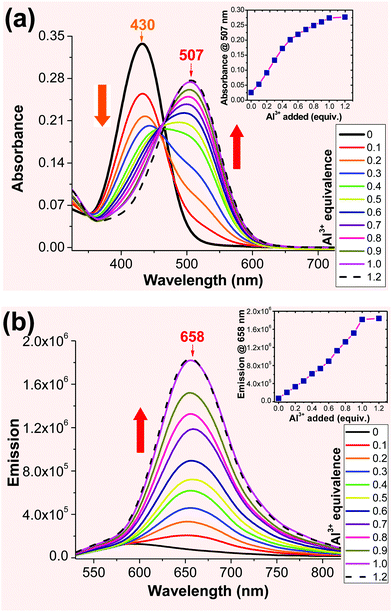
sensing in solution. When the solution of 2 (in acetonitrile) was titrated with an Al3+ (1 mM in aqueous) solution, a new absorption band was observed at ∼507 nm, whose intensity gradually increased with the Al3+ concentration (Fig. 2a). The absorbance at 507 nm exhibited a good linear correlation with the Al3+ concentration up to 1 equivalent. Probe 2 was excited at either 430 nm or 507 nm to record the emission spectra of the resulting Al3+ complex. When 2 was excited at 430 nm, the emission peak at 588 nm gradually decreased with increasing Al3+ concentration (ESI,† Fig. S4). However, excitation at 507 nm revealed the emission only from the resulting Al3+ complex (λem ≈ 658 nm), which gradually increased with the Al3+ concentration (Fig. 2b). The emission spectra remained unchanged after the addition of 1 equivalent of Al3+ cation, indicating 1![[thin space (1/6-em)]](https://www.rsc.org/images/entities/char_2009.gif) :
:![[thin space (1/6-em)]](https://www.rsc.org/images/entities/char_2009.gif) 1 binding stoichiometry for the probe 2-Al3+ complex. The 1
1 binding stoichiometry for the probe 2-Al3+ complex. The 1![[thin space (1/6-em)]](https://www.rsc.org/images/entities/char_2009.gif) :
:![[thin space (1/6-em)]](https://www.rsc.org/images/entities/char_2009.gif) 1 ligand-to-metal ratio for the Al3+ complex was determined by Job's plot (ESI,† Fig. S8). Also, the limit of detection (LOD) for probe 2 was found to be 0.05 μM. The calculated binding constant (log
1 ligand-to-metal ratio for the Al3+ complex was determined by Job's plot (ESI,† Fig. S8). Also, the limit of detection (LOD) for probe 2 was found to be 0.05 μM. The calculated binding constant (log![[thin space (1/6-em)]](https://www.rsc.org/images/entities/char_2009.gif) K) for the 2-Al complex was found to be 6.77, which further revealed the stronger binding properties of the 2-Al complex (ESI,† Fig. S9).
K) for the 2-Al complex was found to be 6.77, which further revealed the stronger binding properties of the 2-Al complex (ESI,† Fig. S9).
The spectral evidence clearly indicated that the chelation of ligand 2 with the Al3+ cation was sufficiently strong to replace the water on the metal cation, forming the 2-Al complex. When the concentration of Al3+ was less than 0.5 equiv., the equilibrium could also include some 2-Al-2, in addition to the major product 2-Al complex. This assumption could account for the higher response in the absorbance in the presence of 0–0.5 equiv. of Al3+ (inset in Fig. 2a). Since Al3+ was more reactive compared to 2-Al (bearing two positive charge), the reaction of “2-Al-2 + Al3+ → 2 (2-Al) “occurred when the concentration of the Al3+ cation was higher than 0.5 equiv., as the Job plot shows. This assumption also explained the lack of an ideal isobestic point in the absorption spectra (Fig. 2a). However, the fluorescence response of 2 at 658 nm was almost linear (inset in Fig. 2b). The ability of 2 to show a large spectral shift upon binding to Al3+ makes it a potentially useful method for ratiometric determination (I658/I588) of the Al3+ concentration in the solution (ESI,† Fig. S6 and S7).
The proposed formation for Al3+ binding was further studied by NMR spectroscopic analysis in deuterated DMSO (Fig. 3). Addition of Al3+ (1 eq.) into probe 2 resulted in the disappearance of the –OH proton signal (Ha) at 9.34 ppm, which is in agreement with the proposed formation of the 2-Al complex (Scheme 2). The aromatic proton Hc signal (on the B ring of 2) at 6.75 ppm disappeared and shifted notably downfield, indicating that ligand 2 was binding to the cation when one equiv. of Al3+ was used. The noticeable downfield shift in the 1H NMR signal also indicated the reduced electron density on the B ring of 2, which is in agreement with the enhanced ICT interaction upon Al3+ binding (shown in 3 in Scheme 2).
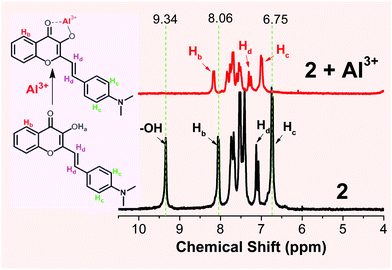 | ||
| Fig. 3 1H NMR spectra of probe 2 in the absence (bottom) and presence (top) of one equiv. of Al3+ (prepared from Al(NO3)3·9H2O dissolved in acetonitrile-d3) in deuterated DMSO-d6. | ||
Probe 2 was tested against other cationic species to investigate its selective interaction with metal cations. Interestingly, 2 did not show any noticeable optical response towards any other cationic species except for Al3+ (ESI,† Fig. S11). Therefore, it could be used for selective identification of Al3+ in the presence of other metal ion species.
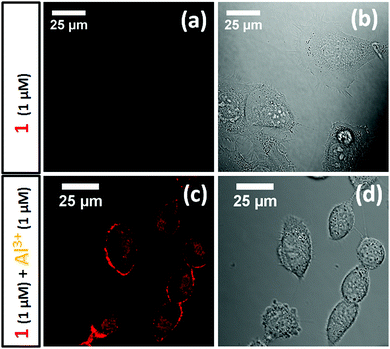
Al 3+ detection in live cells. The attractive photophysical properties, in addition to its selectivity towards Al3+, led us to investigate the potential use of 2 for Al3+ detection in live cells. Thus, progenitor oligodendrocytes (MO3.13) were pre-incubated with an aqueous Al3+ solution (1 μM) for 30 minutes and then incubated with probe 2 (1 μM) for another 30 minute period. As a control experiment, another batch of MO3.13 cells was incubated with probe 2 (1 μM) in the absence of Al3+ in the media. Surprisingly, the cells pre-incubated with Al3+ showed bright red fluorescence confocal images upon exciting probe 2 with a 561 nm laser line (Fig. 4c and d). In sharp contrast, the cells incubated with probe 2 (1 μM) only (i.e., absence of Al3+) did not reveal any noticeable fluorescence signal (Fig. 4a and b) upon 561 nm laser excitation. However, probe 2 (1 μM) showed weak red emission upon excitation with a 488 nm laser (ESI,† Fig. S12). This result illustrated that probe 2 could be a reliable tool for determination of Al3+ toxicity in live cells. It is also important to notice that the probe showed bright confocal microscopy images with Al3+ concentrations as low as 1 μM, which is a significant improvement in comparison to previously reported Al3+ sensing fluorescent probes.
In conclusion, flavonoid derivative 2 was synthesized in good yield, which exhibited excellent selectivity towards Al3+. Probe 2 exhibited a large Stokes shift (Δλ > 150 nm) due to Al3+ binding enhanced ICT. Bright red emission (λem ≈ 640 nm) could be generated upon binding with Al3+ due to the formation of the 2-Al complex, with a 1![[thin space (1/6-em)]](https://www.rsc.org/images/entities/char_2009.gif) :
:![[thin space (1/6-em)]](https://www.rsc.org/images/entities/char_2009.gif) 1 ligand-to-metal ratio. Very good response towards Al3+, while being silent to other metal ions, indicated that probe 2 could be a potentially useful sensor for tracking Al3+ concentrations in biological cells.
1 ligand-to-metal ratio. Very good response towards Al3+, while being silent to other metal ions, indicated that probe 2 could be a potentially useful sensor for tracking Al3+ concentrations in biological cells.
We acknowledge the Coleman endowment from the University of Akron. We also thank Dr Leah Shriver from the University of Akron for the generous gift of the MO3.13 cell line, Dr Michael Konopka from the University of Akron for assistance in bio-imaging, and Nicolas Alexander for providing mass spectrometry data.
Conflicts of interest
There is no conflict of interest to declare.References
- G. H. Robinson, Chem. Eng. News, 2003, 81, 54 CrossRef CAS.
- C. Exley, J. Inorg. Biochem., 2005, 99, 1747–1920 CrossRef CAS.
- M. I. Yousef, A. M. A. El-Morsy and M. S. Hassan, Toxicology, 2005, 215, 97–107 CrossRef CAS.
- H. Bielarczyk, A. Jankowska, B. Madziar, A. Matecki, A. Michno and A. Szutowicz, Neurochem. Int., 2003, 42, 323–331 CrossRef CAS PubMed.
- D. R. Burwen, S. M. Olsen, L. A. Bland, M. J. Arduino, M. H. Reid and W. R. Jarvis, Kidney Int., 1995, 48, 469–474 CrossRef CAS PubMed.
- S. Goswami, S. Paul and A. Manna, RSC Adv., 2013, 3, 10639–10643 RSC.
- D. Jeyanthi, M. Iniya, K. Krishnaveni and D. Chellappa, RSC Adv., 2013, 3, 20984–20989 RSC.
- T. P. Flaten, Brain Res. Bull., 2001, 55, 187–196 CrossRef CAS PubMed.
- C. N. Martyn, C. Osmond, J. A. Edwardson, D. J. P. Barker, E. C. Harris and R. F. Lacey, Lancet, 1989, 333, 59–62 CrossRef.
- P. Nayak, Environ. Res., 2002, 89, 101–115 CrossRef CAS PubMed.
- D. P. Perl, D. C. Gajdusek, R. M. Garruto, R. T. Yanagihara and C. J. Gibbs, Science, 1982, 217, 1053–1055 CrossRef CAS.
- Z. Krejpcio and R. W. Wojciak, Pol. J. Environ. Stud., 2002, 11, 251–254 CAS.
- J. Barcelo and C. Poschenrieder, Environ. Exp. Bot., 2002, 48, 75–92 CrossRef CAS.
- M. Frankowski, A. Zioła-Frankowska and J. Siepak, Talanta, 2010, 80, 2120–2126 CrossRef CAS PubMed.
- A. Sanz-Medel, A. B. S. Cabezuelo, R. Milačič and T. B. Polak, Coord. Chem. Rev., 2002, 228, 373–383 CrossRef CAS.
- R. N. Goyal, V. K. Gupta and S. Chatterjee, Biosens. Bioelectron., 2009, 24, 3562–3568 CrossRef CAS PubMed.
- V. K. Gupta, A. K. Singh, S. Mehtab and B. Gupta, Anal. Chim. Acta, 2006, 566, 5–10 CrossRef CAS.
- D. Maity and T. Govindaraju, Eur. J. Inorg. Chem., 2011, 5479–5485 CrossRef CAS.
- K. Boonkitpatarakul, J. Wang, N. Niamnont, B. Liu, L. Mcdonald, Y. Pang and M. Sukwattanasinitt, ACS Sens., 2015, 1, 144–150 CrossRef.
- J.-C. Qin, X. Cheng, R. Fang, M. Wang, Z. Yang, T. Li and Y. Li, Spectrochim. Acta, Part A, 2016, 152, 352–357 CrossRef CAS PubMed.
- X. Sun, Y.-W. Wang and Y. Peng, Org. Lett., 2012, 14, 3420–3423 CrossRef CAS.
- Y.-W. Wang, Y.-X. Hua, H.-H. Wu, X. Sun and Y. Peng, Chin. Chem. Lett., 2017, 28, 1994–1996 CrossRef CAS.
- Y.-W. Wang, S.-B. Liu, W.-J. Ling and Y. Peng, Chem. Commun., 2016, 52, 827–830 RSC.
- T. Ma, M. Dong, Y. Dong, Y. Wang and Y. Peng, Chem. – Eur. J., 2010, 16, 10313–10318 CrossRef CAS PubMed.
- L. McDonald, J. Wang, N. Alexander, H. Li, T. Liu and Y. Pang, J. Phys. Chem. B, 2016, 120, 766–772 CrossRef CAS PubMed.
- J. Zhang, S. Chen, Y. Ma, D. Wang, J. Zhang, Y. Wang, W. Li, Z. Yu, H. Zhang and F. Yin, J. Mater. Chem. B, 2018, 6, 4065–4070 RSC.
- Q. Xia, Z. Chen, Z. Yu, L. Wang, J. Qu and R. Liu, ACS Appl. Mater. Interfaces, 2018, 10, 17081–17088 CrossRef CAS PubMed.
- Q. Xu, T. Kuang, Y. Liu, L. Cai, X. Peng, T. S. Sreeprasad, P. Zhao, Z. Yu and N. Li, J. Mater. Chem. B, 2016, 4, 7204–7219 RSC.
- P. Miao, B. Wang, Z. Yu, J. Zhao and Y. Tang, Biosens. Bioelectron., 2015, 63, 365–370 CrossRef CAS PubMed.
- B. Li, H. Wen, Y. Cui, W. Zhou, G. Qian and B. Chen, Adv. Mater., 2016, 28, 8819–8860 CrossRef CAS.
- Y. Zhang, D. Wang, L. Yang, D. Zhou and J. Zhang, PLoS One, 2014, 9(8), e105725 CrossRef.
- M. G. L. Hertog, E. J. M. Feskens, D. Kromhout, M. G. L. Hertog, P. C. H. Hollman, M. G. L. Hertog and M. B. Katan, Lancet, 1993, 342, 1007–1011 CrossRef CAS.
- P. G. Pietta, J. Nat. Prod., 2000, 63, 1035–1042 CrossRef CAS.
- P. A. Nijveldt, R. J. Van Nood, E. L. S. Van Hoorn, D. E. Boelens, P. G. Van Norren and K. Van Leeuwen, Am. J. Clin. Nutr., 2001, 74, 418–425 CrossRef.
- Z. Hanáková, J. Hošek, Z. Kutil, V. Temml, P. Landa, T. Vaněk, D. Schuster, S. Dall’Acqua, J. Cvačka, O. Polanský and K. Šmejkal, J. Nat. Prod., 2017, 80, 999–1006 CrossRef PubMed.
- H. Lim, H. Park and H. P. Kim, Biochem. Pharmacol., 2015, 96, 337–348 CrossRef CAS PubMed.
- T. P. T. Cushnie and A. J. Lamb, Int. J. Antimicrob. Agents, 2005, 26, 343–356 CrossRef CAS PubMed.
- M. K. Chahar, N. Sharma, M. P. Dobhal and Y. C. Joshi, Pharmacogn. Rev., 2011, 5, 1–12 CrossRef CAS PubMed.
- C. Faggio, A. Sureda, S. Morabito, A. Sanches-Silva, A. Mocan, S. F. Nabavi and S. M. Nabavi, Eur. J. Pharmacol., 2017, 807, 91–101 CrossRef CAS.
- B. H. Havsteen, The biochemistry and medical significance of the flavonoids, 2002, vol. 96 Search PubMed.
- Y. Zhang, N.-D. Yang, F. Zhou, T. Shen, T. Duan, J. Zhou, Y. Shi, X.-Q. Zhu and H.-M. Shen, PLoS One, 2012, 7, e46749 CrossRef CAS.
- G. Galati and P. J. O’Brien, Free Radical Biol. Med., 2004, 37, 287–303 CrossRef CAS PubMed.
- A. S. Klymchenko, Acc. Chem. Res., 2017, 50, 366–375 CrossRef CAS.
- B. Liu, Y. Pang, R. Bouhenni, E. Duah, S. Paruchuri and L. McDonald, Chem. Commun., 2015, 51, 11060–11063 RSC.
- C. Zhao, B. Liu, X. Bi, D. Liu, C. Pan, L. Wang and Y. Pang, Sens. Actuators, B, 2016, 229, 131–137 CrossRef CAS.
- L. McDonald, B. Liu, A. Taraboletti, K. Whiddon, L. P. Shriver, M. Konopka, Q. Liu and Y. Pang, J. Mater. Chem. B, 2016, 4, 7902–7908 RSC.
- K. A. Bertman, C. S. Abeywickrama, H. J. Baumann, N. Alexander, L. McDonald, L. P. Shriver, M. Konopka and Y. Pang, J. Mater. Chem. B, 2018, 6, 5050–5058 RSC.
Footnote |
| † Electronic supplementary information (ESI) available. See DOI: 10.1039/c9cc02322d |
| This journal is © The Royal Society of Chemistry 2019 |

