Aluminum-doped NiO nanofibers as chemical sensors for selective and sensitive methanol detection
Changhao
Feng
 *a,
Zhongwei
Jiang
a,
Bin
Chen
 a,
Pengfei
Cheng
b,
Yinglin
Wang
 b and
Chengzhi
Huang
 *a
*a
aKey Laboratory of Luminescent and Real-Time Analytical Chemistry (Southwest University), Ministry of Education, College of Electronic and Information Engineering, Southwest University, Chongqing 400715, China. E-mail: fengchanghao@qq.com; chengzhi@swu.edu.cn; Fax: +86-023-68250394
bSchool of Aerospace Science and Technology, Xidian University, 266 Xibeng Street, Xian 710126, China
First published on 17th December 2018
Abstract
One-dimensional nanomaterials with controlled morphology have received considerable attention as chemical sensors. Herein, we report a low-cost and facile method for manufacturing chemical sensors based on Al-doped NiO nanofibers. The structures and morphologies of the samples were characterized by SEM, TEM, SAED and XRD. Chemical sensors with 3 mol% Al-doped NiO nanofibers showed a response of 10.4 to 200 ppm methanol. The transient, dynamic, repeatability, selectivity, and long-term stability characteristics of the obtained sensors were tested, which indicated that these chemical sensors were promising for detecting methanol vapor in air.
| Changhao Feng Changhao Feng received his MS degree from the Department of Electronic Sciences and Technology, Heilongjiang University, China in 2012. He obtained his PhD from Jilin University of China in 2016. Now, he is a lecturer in the College of Electronic and Information Engineering at the Southwest University. |
| Zhongwei Jiang Zhongwei Jiang is a PhD student at the College of Chemistry and Chemical Engineering, Southwest University (Chongqing, China). His current research interests include the preparation of 2D metal organic frameworks and their applications for analysis and sensing. |
| Bin Chen Bin Chen received her PhD degree from the Graduate School of Information Science and Electrical Engineering from Kyushu University (Japan) in 2014. She is now a lecturer at the College of Electronic and Information Engineering at Southwest University and engaged in the research of chemical sensors. |
| Pengfei Cheng Pengfei Cheng obtained his PhD from Jilin University of China in 2013. Now, he is engaged in the synthesis and characterization of semiconducting functional materials and dye-sensitized solar cells. |
| Yinglin Wang Yinglin Wang received her PhD degree from the College of Electronic Science and Engineering at Jilin University in 2017. She is currently a lecturer at Xidian University, China. Her current research is focused on the preparation and applications of graphene and semiconductor oxides, particularly gas sensors. |
| Chengzhi Huang Chengzhi Huang is a Professor of Analytical Chemistry and Pharmaceutical Analytics at Southwest University, PR China. He received his PhD from Peking University in 1996 and was a postdoctoral scholar at the Central Research Laboratory of Hitachi Limited, Tokyo from 1998 to 1999. Then, he worked in the Loeb Laboratory at Ottawa University in 2000–2001 and the Pharmaceutical Department of Tokyo University in 2001–2003. His past research interests involved the analytical applications of light scattering, fluorescence and absorption spectroscopy of small organic molecules, biomolecules and nanoparticles. Currently, his research focuses on nanomaterial-based pharmaceutical analysis, drug delivery and near-infrared photothermal therapy. |
1. Introduction
During the past decades, air pollution caused by gaseous pollutants has become a serious global problem, manifested by the greenhouse effect, acid rain and ozone layer destruction. Gas sensors, as a type of chemical sensors, which are used to monitor the concentrations of gases, have been investigated extensively.1–4 Various types of gas sensors have been developed, such as catalytic combustion-type gas sensors,5,6 optical gas sensors,7,8 electrochemical gas sensors,9–11 and MOS (metal oxide semiconductor) gas sensors.4,12–14 Until now, gas sensors based on metal oxides are actually one of the most investigated sensors due to their low cost, ease of use, durability, and low limit of detection.2,3,14 The general mechanism involves measuring the resistance changes upon exposure to target gases and air.4 Various sensors based on metal-oxide materials including SnO2,15,16 ZnO,17,18 WO3,19,20 In2O3,21,22 α-Fe2O3 (ref. 23 and 24) and NiO25,26 were developed. As a p-type metal oxide semiconductor with good oxygen adsorbing ability, NiO has gained considerable attention and has been commonly used to detect harmful gases and VOCs (volatile organic compounds) including H2,27n-butanol,28 C2H5OH29 and NO2.30 Furthermore, the gas-sensing properties of NiO can be improved by doping. For example, Park et al. synthesized NiO thin films via a simple solvothermal route, and the NO2 gas sensing performance of these sensors was enhanced remarkably by Co doping.31 Kim et al. prepared hollow spheres by coating Fe precursors onto Ni spheres, which increased the response to 100 ppm C2H5OH relative to that of NiO hollow spheres.32 Wang et al. synthesized Zn-doped NiO dendritic crystals using an electrolytic approach, and the resulting gas sensors exhibited excellent reproducibility, reversibility, stability and selectivity toward NH3.33 We all know that methanol is an important chemical raw material that is widely used in many applications such as pigments, pharmaceuticals, organic synthesis and clean liquid fuel. However, methanol is toxic and harmful to human health, particularly when present in blood and the nervous system. Therefore, it is of great significance to study and develop a highly responsive, reliable, cost-effective, portable, and selective methanol sensor.In this study, we prepared novel chemical sensors based on Al-doped NiO nanofibers. These chemical sensors demonstrated enhanced sensing performances in detecting VOCs, particularly methanol. Finally, the effect of doping was investigated, and a possible mechanism is proposed.
2. Experimental
All chemical reagents involved in the experiments were analytical grade and used as purchased from Aladdin Industrial Corporation of China. Al(NO3)3·9H2O and NiCl2 were used as the aluminum and nickel sources, respectively.2.1. Fabrication of Al-doped NiO nanofibers
In a typical procedure, 2 mmol NiCl2 and 0, 0.02, 0.06, or 0.12 mmol Al(NO3)3·9H2O were dissolved in 9 mL N,N-dimethylformamide (DMF) and 1 mL ethanol. After stirring for 30 min, 1.5 g polyvinyl pyrrolidone (PVP, Mw = 1![[thin space (1/6-em)]](https://www.rsc.org/images/entities/char_2009.gif) 300
300![[thin space (1/6-em)]](https://www.rsc.org/images/entities/char_2009.gif) 000 g mol−1) was added to the solution as a polymer matrix with vigorous stirring for 3 h at 50 °C to obtain a light-green, transparent, and homogeneous polymer solution. Subsequently, the above solution was transferred to a 10 mL plastic syringe equipped with a needle made of stainless steel. The electrospun nanofibers were prepared with commercial electrospinning equipment (DNF-001, Beijing Kai-Weixin Technology Co., Ltd, China). The electrospinning parameters were set as follows: the applied voltage was 15 kV, the collection distance was 13 cm, the electrospinning solution feed rate was controlled at 0.08 mm min−1, and the grounded rotating cylinder was 120 rpm. The collected sensing materials were calcined at 500 °C for 3 h with a heating ratio of 2 °C min−1 in a muffle furnace. The samples were labeled S1, S2, S3 and S4 for the ratios of Al to Ni of 0%, 1%, 3% and 6%, respectively.
000 g mol−1) was added to the solution as a polymer matrix with vigorous stirring for 3 h at 50 °C to obtain a light-green, transparent, and homogeneous polymer solution. Subsequently, the above solution was transferred to a 10 mL plastic syringe equipped with a needle made of stainless steel. The electrospun nanofibers were prepared with commercial electrospinning equipment (DNF-001, Beijing Kai-Weixin Technology Co., Ltd, China). The electrospinning parameters were set as follows: the applied voltage was 15 kV, the collection distance was 13 cm, the electrospinning solution feed rate was controlled at 0.08 mm min−1, and the grounded rotating cylinder was 120 rpm. The collected sensing materials were calcined at 500 °C for 3 h with a heating ratio of 2 °C min−1 in a muffle furnace. The samples were labeled S1, S2, S3 and S4 for the ratios of Al to Ni of 0%, 1%, 3% and 6%, respectively.
2.2. Characterization
The crystallinities of pure NiO and Al-doped NiO nanofibers were determined by X-ray diffraction (XRD) in a 2θ range from 20° to 80° using Rigaku TTRIII with Cu Kα1 radiation (λ = 0.154 nm). The morphology of the products was examined by field emission scanning electron microscopy (SEM; JSM-7500F, JEOL, Tokyo, Japan). Transmission electron microscopy (TEM) images, high-resolution transmission electron microscopy (HRTEM) images, corresponding selected area electron diffraction (SAED) patterns, and energy-dispersive X-ray spectroscopy (EDS) measurements were obtained using a JEM-3010 (JEOL, Tokyo, Japan).2.3. Fabrication and measurement of sensors
The sensors were prepared by coating the mixture onto L-shaped Au electrodes that contained the as-synthesized nanomaterials and deionized water. As shown in Fig. 1a, each end of the Au electrode was connected with a Pt wire. After coating, the sensing devices were dried at room temperature and then kept at 300 °C for 3 h. The inset of Fig. 1a is a model diagram of the sensor. Fig. 1b depicts the micro-heater of the sensor, which is made of ruthenium oxides (RuO2). The operating temperatures of the sensor were controlled by adjusting the electric current. The operating temperatures were measured by a pyrometer (T250, FLIR Systems Inc., USA). The emissivity value of the temperature sensors was fixed at 0.9. The DC power of the gas sensors was GPD 3303s (Gwinstek Co., China), which was used to supply power to heat the substrates, and the temperature distributions appeared uniform on the substrate, as shown in the inset of Fig. 1b.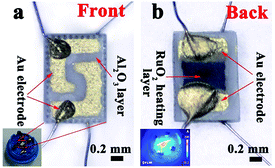 | ||
| Fig. 1 (a) A schematic of the alumina substrate; the inset depicts the gas sensor. (b) The photograph of the gas sensor; the inset shows the temperature distribution of the gas sensor. | ||
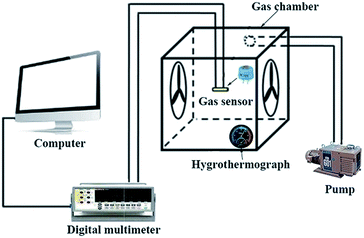
The gas sensing performance of the sensors was measured by a static testing method under laboratory conditions (∼30 RH%, 22 °C), as shown in Fig. 2. The sensors were placed in a gas chamber (50 L) filled with fresh air, and the electrical resistance of the sensors was measured using digital multimeters controlled by a computer. Following this, a given amount of target VOC was injected into the closed chamber and distributed uniformly with the help of electric fans. The concentrations of the VOCs were obtained by a static liquid gas distribution method, calculated by formula (1):
 | (1) |
3. Results and discussion
3.1. Structural and morphological characteristics
The phase composition of the samples was primarily confirmed by XRD. As shown in Fig. 3a, peaks corresponding to the (111), (200), (220), and (311) planes are located at 20–80°, which can be indexed to the cubic structure of NiO (JCPDS card: 47-1049). No peaks ascribed to the aluminum compound were observed, probably because of the low doping amount. Comparison of the XRD peak intensity of pure NiO with that of Al-doped NiO clearly shows that the peak intensity of the doped sample is lower than that of pure NiO, which indicates that doping Al can reduce the crystallinity. Furthermore, the effect of Al doping on the phase structures of the samples was studied from the magnified (111) and (200) diffraction peaks, as shown in Fig. 3b. Clearly, the (111) and (200) diffraction peaks of sample S4 shift to the right compared with those of sample S1. According to Bragg's law,nλ = 2d![[thin space (1/6-em)]](https://www.rsc.org/images/entities/char_2009.gif) sin sin![[thin space (1/6-em)]](https://www.rsc.org/images/entities/char_2009.gif) θ θ | (2) |
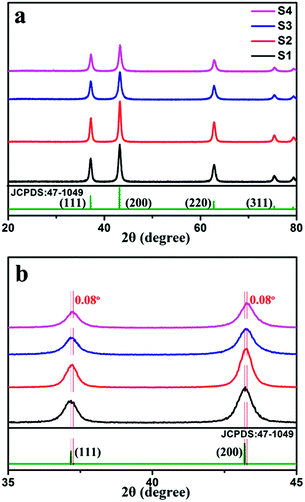 | ||
| Fig. 3 (a) XRD patterns of samples S1, S2, S3 and S4. (b) Comparison of (111) and (200) peaks from XRD patterns. | ||
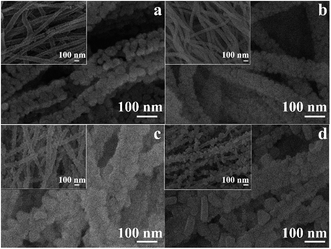
Morphology and uniformity play an important role in providing surface active sites for redox reactions, which directly affect the gas sensing performance. The SEM images of samples S1, S2, S3 and S4 are shown in Fig. 4a–d. Fig. 4a clearly shows uniform nanofibers with an average size of 100 nm. The inset of Fig. 4a clearly shows the architecture at low magnification. Large voids can be seen between the nanofibers, which provide pathways that enable the gas molecules to easily penetrate the whole membrane. Gas-accessible nanostructures are advantageous for enhancing the gas response and response kinetics. When adding Al element into NiO, the morphologies of the samples changed significantly with nanoparticles decorated on the nanofibers, as observed in Fig. 4c and d. It is noted that such structures can provide additional surface active sites for redox reactions. However, the morphology of sample S4 appears tighter than that of sample S1, probably because the Al doping impedes the growth of the nanoparticles.
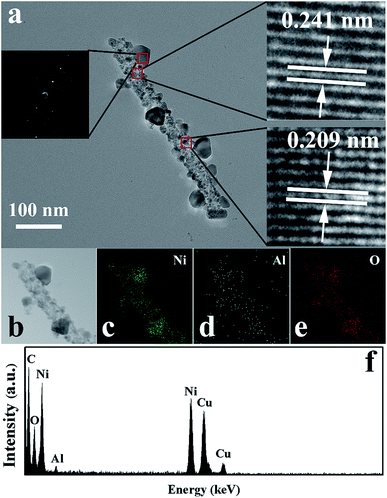
TEM, HRTEM, SAED, and EDS were performed to retrieve the detailed chemical and structural information for sample S4. From the TEM images (Fig. 5a), it can be observed that the nanofibers are constructed by many tiny nanoparticles and some larger monocrystalline structures decorated on the nanofibers. The right insets are HRTEM images obtained from the marked circles in Fig. 5a. In the HRTEM images, the lattice fringes can be clearly seen, indicating the highly crystalline nature of NiO. The fringe spacings of 0.241 nm and 0.209 nm were assigned to the (111) plane and (100) plane of the cubic NiO, respectively. Furthermore, EDS elemental mapping was performed on an individual nanofiber of sample S4, as shown in Fig. 5b–f. The results revealed that the nanostructures of sample S4 are composed of Ni, Al and O. Furthermore, the Al signal was visible in the whole nanofiber, indicating the uniform distribution of Al element in the entire nanostructure. This result confirmed that Al was successfully doped into NiO.
3.2. Gas sensing properties
The gas sensing properties of the sensors based on samples S1, S2, S3 and S4 were investigated. The optimal working temperature of the materials was determined by investigating the temperature-dependent sensing behavior in response to 200 ppm methanol from 225 °C to 375 °C. Fig. 6 clearly shows that the responses of the sensors varied with the operating temperature. Sensors S1 and S2 had an optimal operating temperature of 300 °C, while sensors S3 and S4 had optimal operating temperatures of 325 and 350 °C, respectively. It is seen that the sensor response increases significantly with the increase in temperature from 225 °C to the optimal operating temperature and becomes lower as the temperature increases further. When the temperature was relatively low, there was not enough energy complete the reaction between the oxygen species and VOCs. At the optimal operating temperatures, the target VOC molecular activity was higher and more oxygen species were adsorbed on the surface, which contributed to the enhancement in the sensing response. On further increasing the operating temperature, the gas adsorption ability could be restricted, resulting in a rapid decrease in the response. Sensor S3 shows the highest response toward 200 ppm methanol, with a maximum response of 10.4, which is about 5.7 times higher than that of sensor S1. As a result, 325 °C was selected as the optimum working temperature for the sensors in the subsequent gas testing processes. Furthermore, the results of methanol sensing properties of our sensors compared with those of chemical sensors based on other metal-oxide nanostructures34–38 are shown in Table 1. The gas response in this study is higher than those obtained in the studies mentioned above at a moderate operating temperature.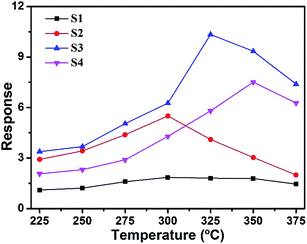 | ||
| Fig. 6 Responses of sensors S1, S2, S3 and S4 to 200 ppm methanol as function of operating temperature. | ||
| Materials | Operating temperature | Methanol concentration | Response | Response time | Recovery time | Ref. |
|---|---|---|---|---|---|---|
| CdS-doped SnO2 thick films | 200 °C | 5000 ppm | 70 | 90 s | 200 s | 34 |
| ZnO thin film | 275 °C | 500 ppm | 17 | 280 s | 135 s | 35 |
| flower-like In2O3 microrods | 300 °C | 100 ppm | 3 | 15 s | 20 s | 36 |
| ZnO nanorods | 300 °C | 100 ppm | 3.11 | 216 s | 405 s | 37 |
| CuO thin film | 350 °C | 500 ppm | 1.12 | 235 s | 225 s | 38 |
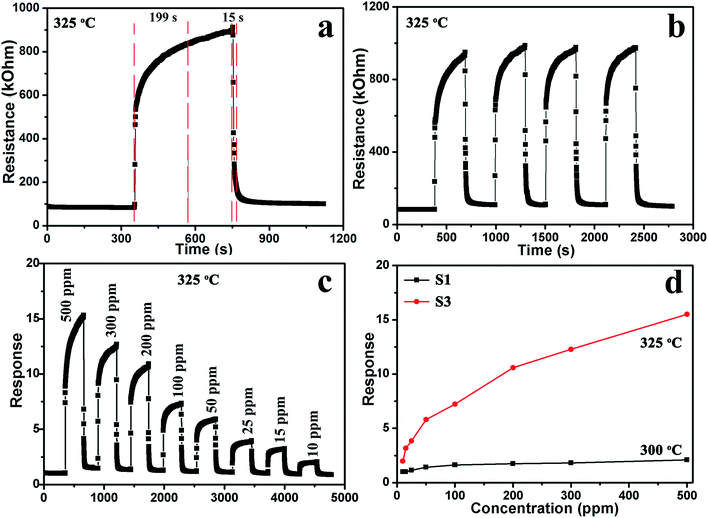
| Al-doped NiO nanotubes | 325 °C | 200 ppm | 10.4 | 199 s | 15 s | This work |
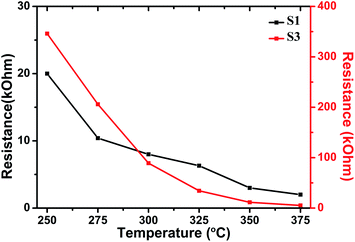
Fig. 7 shows the dependence of Ra for sensors S1 and S3 at the optimal operating temperature. It can be seen that the resistances decrease with the increase in operating temperature, which is an intrinsic characteristic of a semiconductor. Furthermore, the resistances increase with Al doping. The resistances of sensors S1 and S3 were 6.3 and 34.3 kΩ at 325 °C, respectively.
Fig. 8a displays the response and recovery curve for sensor S3 in 200 ppm methanol at 325 °C. The resistance of the sensor increased when 200 ppm methanol was injected, demonstrating the typical gas-sensing properties of a p-type semiconductor. Furthermore, according to the response and recovery curves, when methanol was introduced and extracted, the resistance of the sensors increased upon exposure to methanol within 199 s, and the resistance quickly recovered to its initial value after exposure to air within 15 s. Fig. 8b shows four reversible cycles of the response–recovery curves of sensor S3 for 200 ppm methanol. The curves demonstrate that the response has excellent stability and repeatability to methanol. The dynamic characteristics of sensor S3 were further investigated exposing it to different concentrations of methanol at 325 °C. It can be seen that the resistance changes rapidly upon exposure to methanol, as shown in Fig. 8c. The sensor responses to 10, 15, 25, 50, 100, 200, 300, and 500 ppm methanol were approximately 2.0, 3.1, 3.9, 5.9, 7.3, 10.4, 12.4 and 15.3, respectively. Fig. 8d shows the variation in the responses of sensors S1 and S3 as a function of the methanol concentration at the optimum working temperature. The response of sensor S1 to methanol rapidly increases below the concentration of 50 ppm. Then, the increasing trend slows down in the concentration range of 100–500 ppm, indicating that the sensor response is gradually saturating.
From the view of the practical applications, the selectivity and long-term stability are important parameters for sensors. As shown in Fig. 9a, the selectivity of sensor S3 was tested by measuring the response to 200 ppm of various gases. Six VOCs were tested, including methanol, ethanol, acetone, formaldehyde, benzene, and xylene. Sensor S3 exhibits the highest response to methanol among these tested gases, while the responses to other gases are lower. However, the responses of sensor S1 did not show any significant selectivity to any specific gas. Therefore, the selectivity of sensor S3 to methanol is enhanced. As displayed in Fig. 9b, the long-term stability experiment of sensor S3 to 200 ppm methanol was performed over a month. The response values slightly decreased from 10.4 to 8.7 after 30 days, confirming the good stability of the sensor.
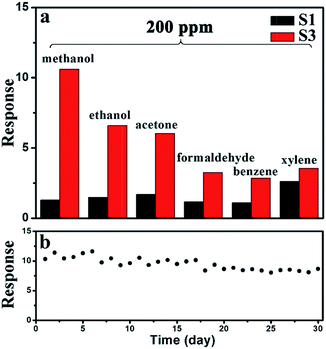 | ||
| Fig. 9 (a) Comparison of the responses of sensors S1 and S3 to 200 ppm of different gas. (b) Long-term stability of sensor S3. | ||
3.3. Sensing mechanism
Pure NiO and Al-doped NiO nanofibers show gas-sensing properties typical of p-type semiconductors. A widely accepted sensing mechanism of sensors based on a p-type MOS (metal oxide semiconductor) is the resistance change upon exposure to different target gases. In ambient air, oxygen molecules chemisorbed on the surface of a p-type MOS trap free electrons (e−) from the conduction band and form adsorbed oxygen species (O− and O2−). At the same time, the holes (h+) form a hole accumulation layer (HAL)39 close to the surfaces of p-type materials, and the resistance of the sensing materials decreases. When the gas sensors are exposed to methanol, ethanol, or other reducing gases, the adsorbed oxygen species react with these gas molecules (formula (3) and (4)). This causes the release of the electrons and recombination with the holes, which leads to an increase in resistance.| CH3OH + O−2 → HCOOH + H2O + e− | (3) |
| CH3OH + O− → HCHO + H2O + e− | (4) |
According to previous research by Lee et al.,32 the response of gas sensors based on p-type semiconductors can be written as follows:
 | (5) |
4. Conclusion
In summary, we have developed a simple one-step electrospun route combined with subsequent heat-treatment for the synthesis of novel Al-doped NiO nanofibers. The as-obtained Al-doped NiO samples were utilized in a sensor device and the gas-sensing properties were examined. The sensors demonstrated good dynamics, repeatability, and long-term stability. The good methanol sensing ability indicates that sensors based on Al-doped NiO nanofibers are promising as methanol sensors for air quality and environmental monitoring.Conflicts of interest
There are no conflicts to declare.Acknowledgements
This study was supported by the Fundamental Research Funds for National Nature Science Foundation of China (No. 61703348, 61604116, 61803289 and 61801400), China Postdoctoral Science Foundation (No. 2017M622942, 2017M610583 and 2017M623120), Chongqing Postdoctoral Science Foundation under Grant numbers XmT2018031, the Central Universities under Grant numbers XDJK2017C074, SWU116059, XDJK2018C021, JB151304 and XJS14070.References
- J. Chen, L. Xu, W. Li and X. Gou, Adv. Mater., 2005, 17, 582–586 CrossRef CAS.
- N. Yamazoe, Sens. Actuators, B, 1991, 5, 7–19 CrossRef CAS.
- N. Barsan, D. Koziej and U. Weimar, Sens. Actuators, B, 2007, 121, 18–35 CrossRef CAS.
- N. Yamazoe, G. Sakai and K. Shimanoe, Catal. Surv. Asia, 2003, 7, 63–75 CrossRef CAS.
- T. Hyodo, T. Hashimoto, T. Ueda, O. Nakagoe, K. Kamada, T. Sasahara, S. Tanabe and Y. Shimizu, Sens. Actuators, B, 2015, 220, 1091–1104 CrossRef CAS.
- T. Sasahara, H. Kato, A. Saito, M. Nishimura and M. Egashira, Sens. Actuators, B, 2007, 126, 536–543 CrossRef CAS.
- M. Manjula, B. Karthikeyan and D. Sastikumar, Opt. Lasers Eng., 2017, 95, 78–82 CrossRef.
- S. Devendiran and D. Sastikumar, Optic Laser. Technol., 2017, 89, 186–191 CrossRef CAS.
- W. Weppner, Sens. Actuators, B, 1987, 12, 107–119 CrossRef CAS.
- J. Lee, N. Choi, H. Lee, J. Kim, S. Y Lim, J. Y. Kwon, S. M. Lee, S. E. Moon, J. Jong and D. Yoo, Sens. Actuators, B, 2017, 248, 957–960 CrossRef CAS.
- D. Wei and A. Ivask, Anal. Chim. Acta, 2008, 607, 126–135 CrossRef CAS PubMed.
- P. Rai, S. Majhi, Y. Yu and J. Lee, RSC Adv., 2015, 5, 76229–76248 RSC.
- D. R. Miller, S. A. Akbar and P. A. Morris, Sens. Actuators, B, 2014, 204, 250–272 CrossRef CAS.
- H. Kim and J. Lee, Sens. Actuators, B, 2014, 192, 607–627 CrossRef CAS.
- J. Park and K. Kim, Sens. Actuators, B, 1999, 56, 50–58 CrossRef CAS.
- A. Kolmakov, D. O. Klenov, Y. Lilach, S. Stemmer and M. Moskovits, Nano Lett., 2005, 5, 667–673 CrossRef CAS PubMed.
- Q. Wan, Q. Li, Y. Chen, T. Wang, X. He, J. Li and C. Lin, Appl. Phys. Lett., 2004, 84, 3654–3656 CrossRef CAS.
- J. Xu, Q. Pan, Y. Shun and Z. Tian, Sens. Actuators, B, 2000, 66, 277–279 CrossRef CAS.
- C. Feng, X. Li, J. Ma, Y. Sun, C. Wang, P. Sun, J. Zhen and G. Lu, Sens. Actuators, B, 2015, 209, 622–629 CrossRef CAS.
- C. Feng, C. Wang, P. Cheng, X. Li, B. Wang, Y. Guan, J. Ma, H. Zhang, Y. Sun, P. Sun, J. Zheng and G. Lu, Sens. Actuators, B, 2015, 221, 434–442 CrossRef CAS.
- B. Li, Y. Xie, M. Jing, G. Rong, Y. Tang and G. Zhang, Langmuir, 2006, 22, 9380–9385 CrossRef CAS PubMed.
- A. Gurlo, N. Bârsan, M. Ivanovskaya, U. Weimar and W. Göpel, Sens. Actuators, B, 1998, 47, 92–99 CrossRef CAS.
- L. Wang, T. Fei, Z. Lou and T. Zhang, ACS Appl. Mater. Interfaces, 2011, 12, 4689–4694 CrossRef PubMed.
- Y. Wang, Y. Wang, J. Cao, F. Kong, H. Xia, J. Zhang, B. Zhu, S. Wang and S. Wu, Sens. Actuators, B, 2008, 131, 183–189 CrossRef CAS.
- C. Feng, C. Wang, H. Zhang, X. Li, C. Wang, P. Cheng, J. Ma, P. Sun, Y. Gao, H. Zhang, Y. Sun, J. Zheng and G. Lu, Sens. Actuators, B, 2015, 221, 1475–1482 CrossRef CAS.
- N. Cho, H. Woo, J. Lee and I. Kim, Chem. Commun., 2011, 47, 11300–11302 RSC.
- D. Jung, M. Han and G. S. Lee, Carbon, 2014, 78, 156–163 CrossRef CAS.
- G. Zhu, C. Xi, H. Xu, D. Zheng, Y. Liu, X. Xu and X. Shen, RSC Adv., 2012, 2, 4236–4241 RSC.
- N. G. Cho, I. S. Hwang, H. G. Kim, J. H. Lee and I. D. Kim, Sens. Actuators, B, 2011, 155, 366–371 CrossRef CAS.
- J. M. Choi, J. H. Byun and S. K. Sang, Sens. Actuators, B, 2016, 227, 149–156 CrossRef CAS.
- S. Park, S. Kim, G. Sun and C. Lee, Nanosci. Nanotechnol. Lett., 2015, 7, 713–717 CrossRef.
- H. Kim, K. Choi, K. Kim, C. Na and J. Lee, Sens. Actuators, B, 2012, 171–172, 1029–1037 CrossRef CAS.
- J. Wang, L. Wei, L. Zhang, J. Zhang, H. Wei, C. Jiang and Y. Zhang, J. Mater. Chem., 2012, 22, 20038–20047 RSC.
- L. Yadava, R. Verma and R. Dwivedi, Sens. Actuators, B, 2010, 144, 37–42 CrossRef CAS.
- P. Sahay and R. Nath, Sens. Actuators, B, 2008, 134, 654–659 CrossRef CAS.
- F. Huang, W. Yang, F. He and S. Liu, Sens. Actuators, B, 2016, 235, 86–93 CrossRef CAS.
- H. Ahn, J. H. Park, S. B. Kim, S. H. Jee, Y. S. Yoon and D. J. Kim, Electrochem. Solid State Lett., 2010, 13, J125–J128 CrossRef CAS.
- M. Parmar and K. Rajanna, Int. J. Smart Sens. Intell. Syst., 2011, 4, 710–725 CAS.
- L. Zhang, S. Wang and C. Lu, Anal. Chem., 2015, 87, 7313–7320 CrossRef CAS.
| This journal is © The Royal Society of Chemistry 2019 |

