
 Open Access Article
 This Open Access Article is licensed under a
 Creative Commons Attribution 3.0 Unported Licence
Morpho-molecular ex vivo detection and grading of non-muscle-invasive bladder cancer using forward imaging probe based multimodal optical coherence tomography and Raman spectroscopy†
Fabian
Placzek‡
 a,
Eliana
Cordero Bautista‡
b,
Simon
Kretschmer
c,
Lara M.
Wurster
a,
Florian
Knorr
b,
Gerardo
González-Cerdas
c,
Mikael T.
Erkkilä
a,
Patrick
Stein
c,
Çağlar
Ataman
c,
Gregers G.
Hermann
d,
Karin
Mogensen
d,
Thomas
Hasselager
e,
Peter E.
Andersen
f,
Hans
Zappe
c,
Jürgen
Popp
bg,
Wolfgang
Drexler
a,
Rainer A.
Leitgeb
a and
Iwan W.
Schie
*bh
a,
Eliana
Cordero Bautista‡
b,
Simon
Kretschmer
c,
Lara M.
Wurster
a,
Florian
Knorr
b,
Gerardo
González-Cerdas
c,
Mikael T.
Erkkilä
a,
Patrick
Stein
c,
Çağlar
Ataman
c,
Gregers G.
Hermann
d,
Karin
Mogensen
d,
Thomas
Hasselager
e,
Peter E.
Andersen
f,
Hans
Zappe
c,
Jürgen
Popp
bg,
Wolfgang
Drexler
a,
Rainer A.
Leitgeb
a and
Iwan W.
Schie
*bh
aCenter for Medical Physics and Biomedical Engineering, Medical University of Vienna, Waehringer Guertel 18-20, 4L, 1090 Vienna, Austria
bLeibniz Institute of Photonic Technology (Leibniz-IPHT), Albert-Einstein-Straße 9, Jena, Germany. E-mail: iwan.schie@leibniz-ipht.de
cGisela and Erwin Sick Chair of Micro-optics, Department of Microsystems Engineering, University of Freiburg, Freiburg, Germany
dDepartment of Urology, Copenhagen University, Herlev/Gentofte hospital, Borgmester Ib Juuls Vej 23A, DK-2730, Herlev, Copenhagen, Denmark
eDepartment of Pathology, Copenhagen University, Herlev/Gentofte hospital, Borgmester Ib Juuls Vej 23A, DK-2730, Herlev, Copenhagen, Denmark
fTechnical University of Denmark, Department of Health Technology (DTU Health Tech), Ørsteds Plads, Building 345C, DK-2800, Kgs. Lyngby, Denmark
gInstitute of Physical Chemistry, Friedrich Schiller University Jena, Helmholtzweg 4, 07743, Jena, Germany
hUniversity of Applied Sciences-Jena, Department of Medical Engineering and Biotechnology, Carl-Zeiss-Promenade 2, 07745, Jena, Germany
First published on 11th December 2019
Abstract
Non-muscle-invasive bladder cancer affects millions of people worldwide, resulting in significant discomfort to the patient and potential death. Today, cystoscopy is the gold standard for bladder cancer assessment, using white light endoscopy to detect tumor suspected lesion areas, followed by resection of these areas and subsequent histopathological evaluation. Not only does the pathological examination take days, but due to the invasive nature, the performed biopsy can result in significant harm to the patient. Nowadays, optical modalities, such as optical coherence tomography (OCT) and Raman spectroscopy (RS), have proven to detect cancer in real time and can provide more detailed clinical information of a lesion, e.g. its penetration depth (stage) and the differentiation of the cells (grade). In this paper, we present an ex vivo study performed with a combined piezoelectric tube-based OCT-probe and fiber optic RS-probe imaging system that allows large field-of-view imaging of bladder biopsies, using both modalities and co-registered visualization, detection and grading of cancerous bladder lesions. In the present study, 119 examined biopsies were characterized, showing that fiber-optic based OCT provides a sensitivity of 78% and a specificity of 69% for the detection of non-muscle-invasive bladder cancer, while RS, on the other hand, provides a sensitivity of 81% and a specificity of 61% for the grading of low- and high-grade tissues. Moreover, the study shows that a piezoelectric tube-based OCT probe can have significant endurance, suitable for future long-lasting in vivo applications. These results also indicate that combined OCT and RS fiber probe-based characterization offers an exciting possibility for label-free and morpho-chemical optical biopsies for bladder cancer diagnostics.
Introduction
There are currently 3.4 million people affected by bladder cancer worldwide,1 with 75% of the newly diagnosed cases being non-muscle-invasive bladder cancer (NMIBC) and thereby non-muscle-invasive disease.2 Among the different types of NMIBC, the five year recurrence rate is 20–80%.3 The risk of recurrence and repeated surveillance cystoscopy in the outpatient department (OPD), which is the standard procedure when suspicious lesions are detected, subsequently jeopardizes the health of the patient.4 The current gold standard in bladder cancer assessment is cystoscopy, which provides a visualization of the bladder mucosa by white light endoscopy (WL). Although the detection rate for muscle-invasive bladder cancer using WL is very high, 97–100%, the detection of NMIBC is still challenging.5 Significant efforts go into developments to remedy this situation.Along with the examination by WL, a biopsy is performed and the resected suspicious tissue is inspected by pathologists.6 This allows access to clinically relevant information on the stage and grade of a lesion. The tumor stage classifies the invasion depth into the bladder wall. The tumor grade, on the other hand, describes the level of differentiation from healthy cells.7 Histological diagnosis is defined in accordance with UICC's 2017 TNM classification8 and the 2016 WHO classification.9 There is a significant need to allow instant diagnosis during surveillance cystoscopy in the OPD, thus avoiding admittance to the operating theatre for diagnostic surgery.
In situ diagnostic procedures of stage and grade during surgery are currently not available, resulting in unnecessary tissue resection, which can cause significant negative effects on the patient's well-being. Photodynamic diagnosis (PDD), using hexylaminolevulinic acid as a photosensitizing compound for fluorescence guidance, is a promising approach, which may assist the presented optical diagnostic method.6,10 Moreover, PDD does not provide clinically relevant information on stage and grade for immediate treatment decision. Due to these current shortcomings for the onsite diagnosis of NMIBC, there is a significant need for real-time assessment of the tumor stage and grade during cystoscopy.
Autofluorescence and diffuse reflectance have also been applied in bladder biopsies, demonstrating the capability to differentiate tumor and healthy bladder tissue with high sensitivities and specificities, where significant changes of tryptophan and collagen at 340 nm and 390 nm emission peaks were reported.11,12 Nevertheless, in order to differentiate tumor grade in the bladder tissue, more biochemical information about the sample that can be associated with the main molecular changes related to tumor grading is needed.
In recent years, there have been extensive developments in optical technologies and their translation to clinical diagnostic applications, e.g. interference-based approaches, such as optical coherence tomography (OCT), and label-free molecular specific spectroscopy-based approaches, such as Raman spectroscopy (RS). OCT is widely used in ophthalmology to indicate anatomical changes in the retina by providing cross-sectional images in depth at micrometer resolution, allowing access to structural tissue information.13,14 Since the eye is optically easily accessible, the retina can be examined non-invasively using a laser beam. However, to acquire information from the internal organs, OCT has to be extended with an optical endoscope. Such endoscopic OCT-based imaging has been reported for the cardiovascular system, the gastrointestinal tract and the urinary tract.15–18 These implementations, however, only achieved B-scans and endoscopic volume images of the bladder tissue, which are paramount to characterize the tumor tissue, were not previously presented. A comprehensive overview on OCT methodology and applications is given elsewhere.19 While OCT can rapidly provide morphological information from different depths, it lacks chemical information on the underlying molecular composition.
Raman spectroscopy, on the other hand, is based on inelastic light scattering between a photon and a molecule, providing label-free information on the molecular composition of a sample. RS provides information on molecular changes at a single cell level,20–23 and has been extensively used for clinical tissue characterization.24–26 It has been broadly applied in numerous studies for the diagnosis of cardiovascular diseases,27 biochemical characterization of human cells28 and organs,29 including the discrimination of brain tumors30,31 and malignant breast tissues,32–34 and extensive research in cervical cancer,35–37 lung cancer,38 and colon,39 prostate40 and bladder cancers.41,42 RS has been readily implemented in fiber optic probes for a variety of pathologies of different organs.43
While each modality has intriguing capabilities, individually they can cover only a certain but complementary diagnostic aspect. As such, only a combination of both modalities can harvest the full diagnostic potential, and provide information on the invasiveness of the tumor, i.e. stage, by taking cross-sectional images of the bladder wall at a micrometer scale, using OCT, and obtain information about the grade by assessing the biochemical composition of the superficial tissue, using RS.44
Ko et al. reported on the first multimodal approach of combining OCT and RS to detect and characterize dental diseases.45 Ever since, multimodal optical coherence tomography and Raman spectroscopy (OCT-RS) has been reported for imaging ex vivo human breast tissue samples and in vivo wound healing,46ex vivo human retina,47in vivo and ex vivo skin,48–51ex vivo atherosclerotic plaque deposition52 and ex vivo rectal mucosa.53 Furthermore, Ashok et al. combined OCT and RS to increase the sensitivity and specificity of colon cancer detection.54 In this study, microscopy-based OCT achieved a sensitivity, specificity and accuracy of 78%, 74% and 75%, respectively. RS achieved 89% sensitivity, 77% specificity and 82% accuracy. Recently, Bovenkamp et al. showed the ability of microscopic OCT and RS to provide diagnostic information regarding stage and grade of bladder cancer. For differentiating the pT2 stage from the pTa stage, they reported a sensitivity, specificity and accuracy of 80%, 60% and 71%, respectively. Furthermore, the sensitivity of detecting high grade lesions with RS was 99%, whereas the specificity was 87%, indicating correct detection of low grade lesions.55
To use these techniques in vivo in the clinics, they need to be integrated into rigid or flexible cystoscopes to allow in situ assessment of the bladder wall. As a first step in this direction, we report on the development of a combined OCT-Raman system for stage and grade examination of bladder biopsies, based on fiber-optical probes. The combined system mimics the optical performance of an endoscopic probe combining OCT and RS. It gives insight into in vivo conditions and the expectable outcome with the first performance benchmarks. Moreover, it allows one to co-register morphological and molecular information of NMIBC, using fiber optical probes, and enables new opportunities to interpret the data, by the assessment of co-localized molecular and morphological signals. The developed system was used to characterize a total of 119 biopsies in an imaging fashion that mimics in vivo conditions, for the diagnostic evaluation for the detection of NMIBC, and for the grading of low- and high-grade tissues.
Materials and methods
Biopsy handling
The study was approved by the Ethical Committee at the Capital Region of Denmark, H-17015549, and a data processor agreement between the universities in Jena and Vienna and the Capital Region of Denmark was made (HGH-2018-038. I-suite nr. 6639). Prior to the operations, the patients gave their written informed consent to have biopsies for the study taken. All operations were performed according to the guidelines of the Urological Department at Herlev Hospital, Capital Region of Denmark and the experiments were performed in accordance with the above approvals obtained. For the experiments, 119 biopsies from 44 patients were obtained during resection of the bladder tumor in the operation theatre. Immediately after the procedure, the biopsies were moistened with a sodium chloride solution and delivered to the imaging laboratory within 15 minutes. In case a sample could not be examined within 20 minutes after removal, it was snap-frozen to −20 °C and imaged on the following 1–2 days. For examination on the OCT-RS setup, the biopsies were carefully placed on CaF2 glass slides and positioned on the translational stage (Fig. 1 and 2). After the combined analysis using OCT-RS, the biopsies were fixed and stained. The pathologist then staged and graded the biopsies based on the underlying histology. The histopathological results are summarized in Tables 1 and 2. The quantity of the extracted malignant biopsies reflects NMIBC samples. Since pTa and CIS are confined to the urothelium57 and pT1a has only invaded the superficial lamina propria, they are considered non-muscle-invasive bladder cancer58 and by that early stage.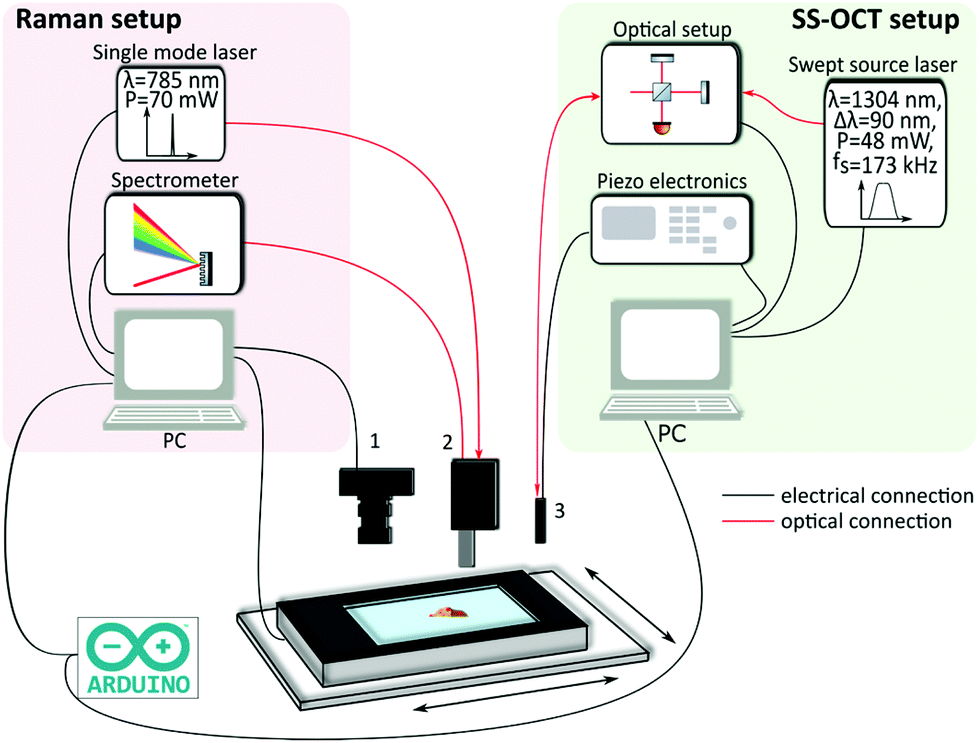 | ||
| Fig. 1 Combined multimodal imaging system. The Raman setup consists of a single mode laser, a spectrometer and a PC. Besides a bright field camera (1), the Arduino board is also connected to the Raman PC. The Raman probe (2) receives the excitation light from the laser and guides back the Raman signal to the spectrometer. The swept source OCT (SS-OCT) setup includes an akinetic laser source, the interferometric optical setup including the photodiodes, driving electronics for the endoscope and a PC. The OCT probe (3) is optically connected to the optical setup. Moreover, the OCT probe is electrically connected to the piezo amplifier. The communication is realized via an Arduino board, triggering the acquisition and the translation of the two-axis stage, which is connected to the Raman PC. | ||
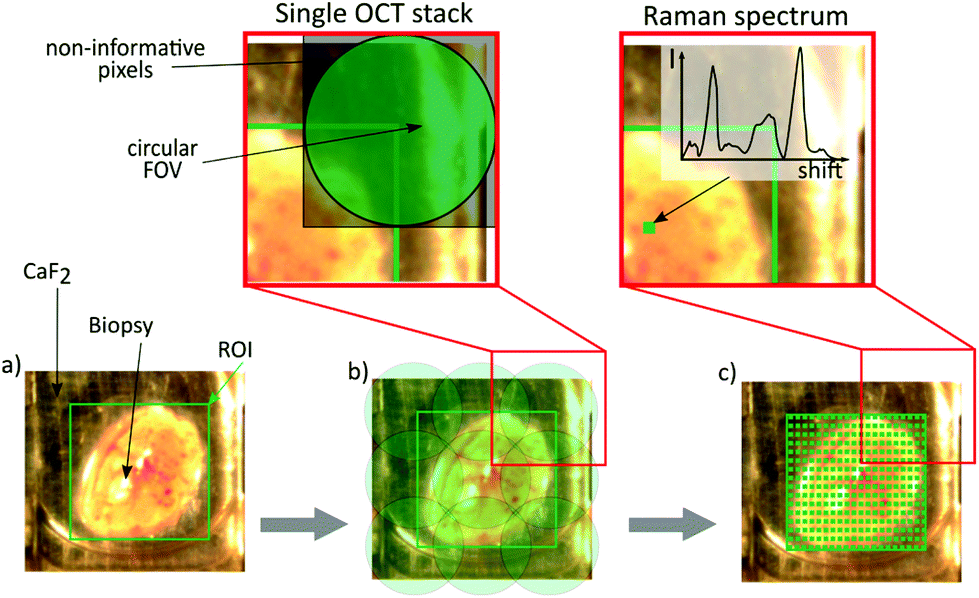 | ||
| Fig. 2 Image acquisition workflow. (a) A certain region of interest (ROI) is chosen out of the bright field image. Starting the acquisition leads to the translation underneath the OCT endoscope. (b) Bottom: The calculated number of scans is performed consecutively. (c) Bottom: The biopsy is translated to the Raman probe and the ROI is scanned, pixel by pixel, to achieve a Raman map. After choosing the ROI, the data acquisition is fully automated. (b) Top: Single OCT stack, which has a size of 500 × 500 pixels. It includes non-informative pixels due to the remapping described in OCT data acquisition. (c) Top: Single Raman point measurement, showing the acquired spectrum at this position. | ||
| Non-tumor | PUNLMP | Cancerous | Total |
|---|---|---|---|
| 66 (22) | 3 | 50 (22) | 116 (44) |
| Stage | Grade | |||
|---|---|---|---|---|
| CIS | pTa | pT1a | High | Low |
| 1 (1) | 48 (22) | 1 (1) | 12 (6) | 38 (19) |
Instrumentation
First, a region of interest on the biopsy was selected by using a bright field image acquired with a standard camera (DCC1645C, Thorlabs) (Fig. 2a). Based on the specific FOV covered by the OCT probe, the software calculated the required number of tiles in x and y for the OCT measurement. The number of points for the Raman acquisition was kept constant to 30 × 30 points. After the start of the data acquisition procedure, the biopsy was moved below the OCT probe, and an OCT stack was acquired. After the acquisition of the first tile was performed, the OCT software sent a trigger through the Arduino board, indicating that the OCT stack was acquired, and the Raman computer executed a command to translate the biopsy to the next location. This was repeated until the entire ROI on the biopsy was sampled. After all OCT frames were acquired, the biopsy was automatically moved below the Raman probe, followed by a scan of the identical ROI as in OCT. The acquisition time for each imaging modality depended on the biopsy size: for example, imaging a biopsy with a size of ∼4 mm2 took 1 minute for the acquisition of nine (3 × 3) OCT stacks and 13 minutes for 900 (30 × 30) Raman-point measurements. The goal of the study was to sample the entire biopsy to allow for a comprehensive characterization of the underlying morpho-molecular changes occurring in malignant tissues. For the measurements in an in vivo setting, the acquisition time for OCT imaging and single point Raman spectroscopy is less than 5 s each.
Data analysis
![[thin space (1/6-em)]](https://www.rsc.org/images/entities/char_2009.gif) 006 observations in total. The classification was carried out using a fine Gaussian support vector machine (SVM) with a 20% holdout validation.
006 observations in total. The classification was carried out using a fine Gaussian support vector machine (SVM) with a 20% holdout validation.
Classification model and cross-validation of Raman data
The classification was performed using a PLS-LDA algorithm, which combines partial least squares and linear discriminant analysis using a 5-fold cross-validation. A hierarchical approach to create and validate each model was adopted, where the first layer model system ML1 focusses on classifying between tumor and non-tumor, and the second layer model system ML2 uses the tumor predictions to differentiate low- and high-grade tumors (Fig. 3).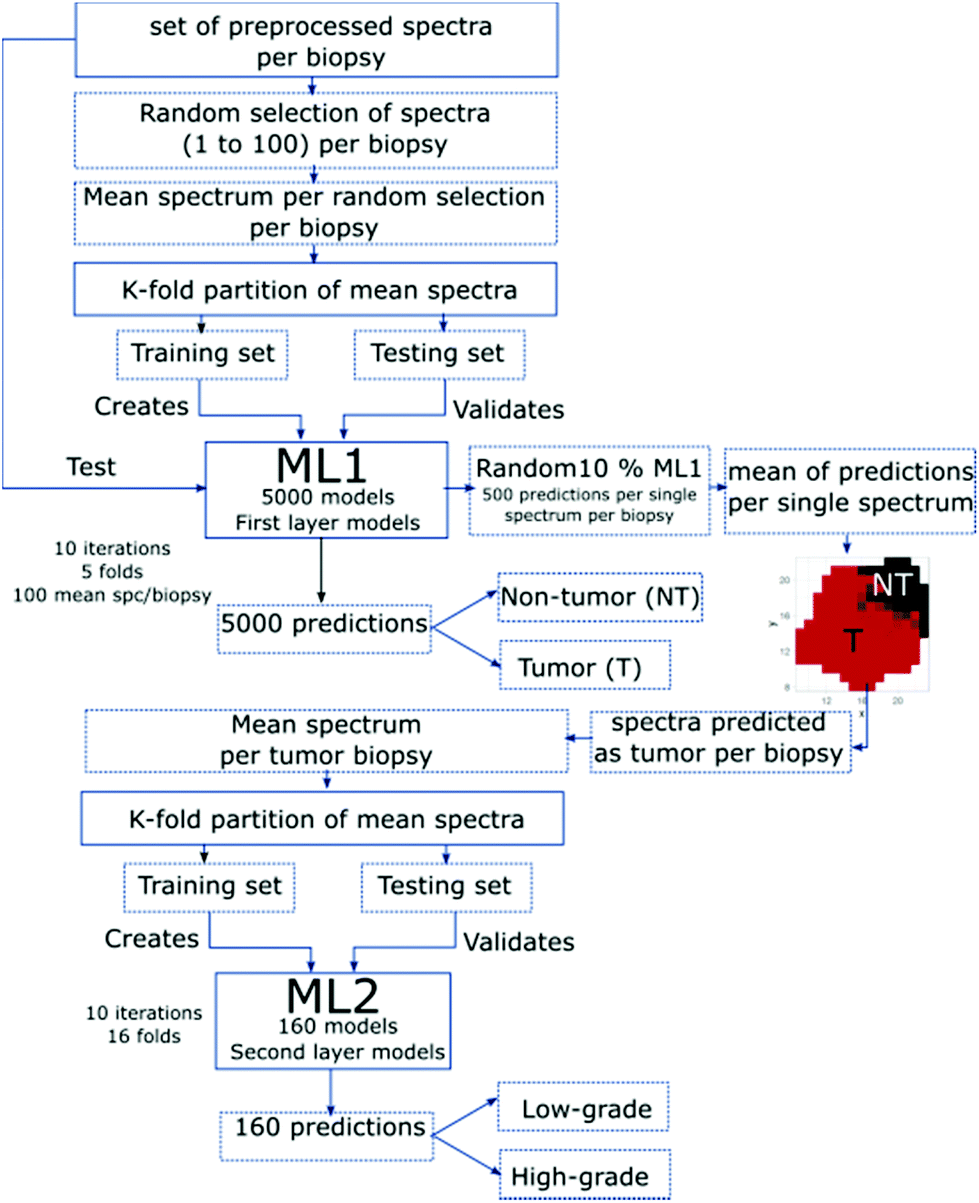 | ||
| Fig. 3 Flowchart of all main steps employed to create and validate the first- and second-layer model systems ML1 and ML2, respectively. | ||
The created models were validated by applying k-fold partitioning of the data, where each layer has a specific partition according to the existent data for each variable of classification. For the first classification layer (ML1), 10 iterations for each partitioning were performed. The generated ML1-models were validated by the test data. In order to test all spectra of each biopsy, 10% of the created models were selected randomly. For each spectral point, a mean of the predictions was calculated, and this prediction map per pixel is displayed in the flowchart (Fig. 3). The mean prediction maps were used to select the spectra predicted as tumor and non-tumor. The second layer classification model system (ML2) used the tumor-defined areas of the biopsies. A mean spectrum per biopsy was calculated for those areas. The resulting data was k-fold partitioned and a set of training and testing biopsies was selected. The ML2 was created with the training data set that results from 16-fold partitions and was validated with the testing biopsies; 10 iterations of 16 different partitions were employed to create and validate ML2 (Fig. 3). The described method has previously been reported in Cordero et al.67
Multivariate curve resolution alternating least squares (MCR-ALS) for collagen distribution of Raman data
Initially, the pure components for each biopsy were determined by using an orthogonal projection approach (OPA) algorithm. This function extracts the initial ‘pure’ components of the set of spectra based on spectral dissimilarity of the data set. It is important to note that the pure component spectra can contain contributions from other substances and can deviate to some degree to pure component spectra of the native substance. The OPA estimates the dispersion matrix of the mean spectrum of the data set: the higher the dissimilarity, the purer the component. The estimated pure components of tumor and non-tumor spectra were correlated to the literature.41 It was found that for non-tumor biopsies, there are most of the relevant bands of collagen 1 spectrum, which can be linked to the dominant presence of collagen in non-tumor spectra. All the non-tumor biopsies were used to find the collagen pure component, which was calculated by employing the OPA function, which provides the first estimation of pure components of the dataset. Afterwards, the mean standard deviation of the OPA pure collagen obtained from each biopsy was used to further calculate the MCR concentrations, where ALS complement the MCR function fitting the concentrations to improve the estimations of the pure components. The MCR-ALS algorithm used the extracted mean collagen pure component and consequently calculates the relative concentration at each measured location of each biopsy. The concentration matrix indicates how intense the presence of collagen in the biopsy is and was calculated for each biopsy.Results and discussion
Correlation of OCT to histopathological images
To visually compare the morphological information obtained from OCT with the histopathological information, OCT and the corresponding histopathology for two different biopsies are shown in Fig. 4. In the non-tumor case (Fig. 4a), the layered appearance of the bladder wall is visible by OCT. The thin dark top layer in the OCT image is correlated to the mucosa, delimiting the bladder from the inner lumen. The second bright layer corresponds to the connective tissue, also referred to as lamina propria. Besides nerves and blood vessels, the bright appearance in the OCT images indicates a strong scattering tissue constituent, such as collagen fibers. The deepest visible layer in the OCT image is the muscularis propria, the muscle layer. It has a clear demarcation from the lamina propria and appears rather dark. In Fig. 4b, the corresponding OCT and histopathological image of a pTa lesion is shown. Here, the thickened urothelium is clearly visible. Whereas the pTa staged tumor has not infiltrated the lamina propria, the demarcation between the urothelium and lamina propria is still intact.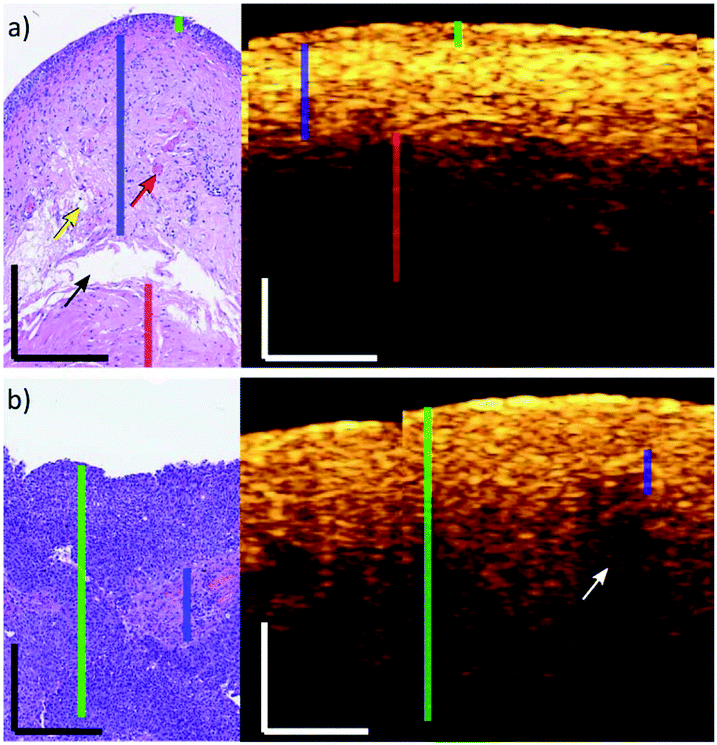 | ||
| Fig. 4 OCT image correlation to histopathological images. (a) Representative example of a non-tumor bladder wall. The green line indicates the mucosa/urothelium layer, the blue line shows the lamina propria and the red line is the muscularis layer. The red arrow points to a vessel, the yellow arrow indicates fat accumulation and the black arrow indicates mechanical rupture. (b) Representative example of a pTa low grade tumor bladder wall. Here, the mucosa/urothelium is thickened (green line). The white arrow indicates a region of less intensity, because the lamina propria (blue line) is highly scattering. The visible edge in (b) is a stitching artefact. The corresponding histopathological images are not co-localized to the OCT B-scans. The OCT insets are maximum projections of 10 B-scans. Scale bars: 250 μm. | ||
These correlations show the ability of the presented endoscopic OCT probe to identify early stage lesions due to morphological changes in the mucosa of the bladder wall. The used OCT probe design is thereby suitable to detect NMIBC. Even though some biopsies can be distinctly correlated, in general, the correlation between OCT and histopathological images is difficult and was not feasible for all biopsies. For example, the biopsy-collection procedure relies on forceps, which mechanically stresses the biopsy. Additionally, the biopsy can get twisted during transportation from the operation theatre to the OCT-RS setup. Furthermore, the fixation process for histopathological slicing includes formalin, which can cause the biopsy to shrink, inducing discrepancies in dimensions. For example, in renal and intestinal biopsies, shrinkage between 11% and 33% was reported, respectively.68,69 For quantitative classification of the OCT data, texture analysis was carried out.
Texture analysis of the OCT data
The classification was performed on 116 non-tumor and tumor biopsies. The stacks were labeled with histopathological results obtained for the biopsies and the results of the texture analysis are summarized in Table 3. Sensitivity indicates the correct detection of tumor in accordance with the histopathological result. An accuracy of 73.4% was achieved. Bovenkamp et al. focused on the differentiation of advanced tumor stages.55 In contrast, in this study, we concentrated on the detection of NMIBC lesions, as the number of available samples for pTa(1) was small, i.e. one single sample. We have, therefore, not separately included the two samples, staged as pT1a and CIS, in the texture analysis, since the statistical basis for a significant classification outcome is not given. Since the advanced stages of muscle-invasive bladder cancer are visually detectable, it is of higher clinical relevance to detect NMIBC by OCT. From the four texture features, the contrast texture property at 45, 90 and 135 degrees contributed the most (92%) to the differentiation between healthy and diseased tissues. While malignant tissues always showed lower contrast values, benign tissues showed a higher contrast. This is understandable, as malignant tissues are characterized by structural loss of the bladder wall anatomy as soon as cancer progresses. This observation confirms the preliminary results of Bovenkamp et al. on a larger study cohort. The results for accuracy are comparable to other publications using microscopes for OCT image acquisition and texture analysis for cancer classification.54,55 The deviation is primarily due to the use of a fiber-probe-based scanning approach, where compromises with respect to the optical performance are made. But on the other hand, there is clear evidence that the optical performance of the probe is sufficient for NMIBC. Furthermore, the remaining glass reflection artifacts from the substrate can additionally reduce the performance. This, however, should be of no concern for in vivo measurements. Nevertheless, the performance of the texture analysis was further compromised, because the classification of the histopathological results provides only a single label for the entire biopsy corresponding to the highest pathologic severity observed. The OCT images, on the other hand, are spatially resolved, and contain a variety of regions. For instance, a pTa staged biopsy may contain areas of healthy bladder wall, which does not influence the histopathological outcome. In contrast, the classification is sensitive to these transitions and the heterogeneity of the lesion within one particular biopsy. The sensitivity for pTa, for instance, increases to 90%, if two blinded experts, familiar with OCT images of the bladder wall, are classifying the OCT images. If the decision was inconclusive between the two experts, the pathologically more severe statement was taken to label the biopsy. The heterogeneity of the biopsy can be a significant factor that reduces the accuracy of the OCT texture analysis (see Fig. 7).| OCT (%) | RS – T/NT (%) | RS – HG/LG (%) | |
|---|---|---|---|
| Accuracy | 73.4 | 92 | 77 |
| Sensitivity | 78 | 95 | 81 |
| Specificity | 69 | 88 | 68 |
| Confidence interval | (72.9–73.9) | (92.2–92.6) | (73–81) |
Raman analysis
For Raman spectroscopy, a two-layer model system was created and validated to distinguish tumor from non-tumor tissues, followed by grading of tumor regions. The first model level differentiates tumor and non-tumor with an accuracy of 92%. As described in the first section, the two-layer model was created with a different set of spectra, summarized in the flowchart shown in Fig. 3. For the second modeling step ML2, which differentiates low-grade from high-grade, an accuracy of 77% was achieved. Fig. 5a shows the mean spectrum of all non-tumor (black) and low- (blue) and high-grade (red) tumor biopsies, in which the lipid and collagen bands are highlighted. The mean coefficient of the model system layer 1 (ML1) is shown in Fig. 5b. The same bands are also highlighted, illustrating the relation between negative coefficients and the spectral bands for collagen at 856 cm−1, 937 cm−1 and 1265 cm−1, which indicate the C–C vibrations and amide II of collagen,70 respectively. The collagen bands and the negative LDA coefficients show a clear relationship between the constituent and the non-tumor class. The marked lipid bands at 1300 cm−1, 1656 cm−1 and 2854 cm−1 correspond to the CH2 deformation, twist vibration, C![[double bond, length as m-dash]](https://www.rsc.org/images/entities/char_e001.gif) C and the symmetric stretching of lipids, respectively.70,71 As can be seen from the comparison, there is a relation between the main lipid bands, positive LDA coefficients, and the tumor class. These observations are consistent with previous findings,41,72 where non-tumor tissues are mainly characterized for having a dominant presence of collagen. The two-layer model (ML1 and ML2) performance is summarized in Table 3: ML2 can identify the true positive LG easily than the true negative HG, with an achieved sensitivity of 81% to differentiate low-grade tumour from high-grade tumor. The achieved specificity of 68% to differentiate the grading indicates that the models need more spectral information of the true negative HG in order to better distinguish the main differences between tumor grading. As Fig. 5a shows, low and high grade mean spectra have very little variations and more HG-biopsies are required to allow the models to classify properly between the two classes.
C and the symmetric stretching of lipids, respectively.70,71 As can be seen from the comparison, there is a relation between the main lipid bands, positive LDA coefficients, and the tumor class. These observations are consistent with previous findings,41,72 where non-tumor tissues are mainly characterized for having a dominant presence of collagen. The two-layer model (ML1 and ML2) performance is summarized in Table 3: ML2 can identify the true positive LG easily than the true negative HG, with an achieved sensitivity of 81% to differentiate low-grade tumour from high-grade tumor. The achieved specificity of 68% to differentiate the grading indicates that the models need more spectral information of the true negative HG in order to better distinguish the main differences between tumor grading. As Fig. 5a shows, low and high grade mean spectra have very little variations and more HG-biopsies are required to allow the models to classify properly between the two classes.
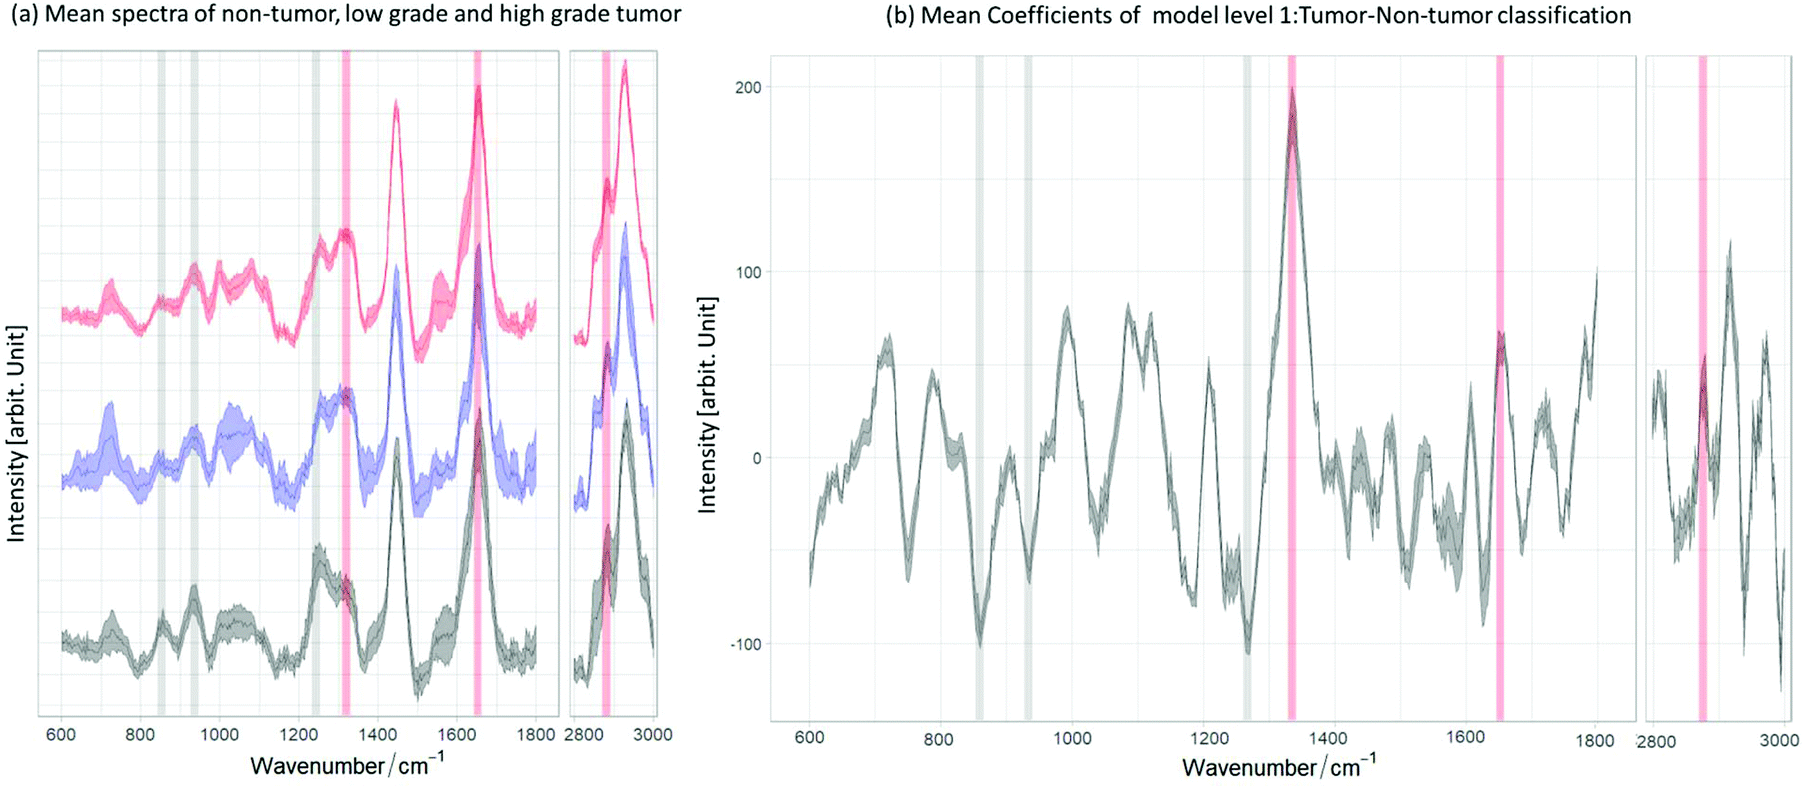 | ||
| Fig. 5 Relation between the mean and the mean coefficients of ML1. (a) Mean spectra of non-tumor (black) and low grade (blue) and high grade (red) tumor. (b) Mean coefficients of ML1 resulted from the tumor/non-tumor classification. The red bands are characteristic lipid bands and the grey bands are typical collagen bands. One can observe that the lipid bands are related to the positive coefficients for tumor and the collagen bands to the negative coefficients for non-tumor biopsies. | ||
Fig. 6a shows the mean and standard deviation spectra of the homogeneous non-tumor (black) and tumor (red) biopsy and the extracted MCR collagen component (green) from all non-tumor biopsies, as described in the previous sections. Fig. 6b displays the mapping of the mean prediction (left) and the collagen distribution (right), showing how the presence of collagen dominates in the biopsy that is predicted as a homogeneous non-tumor tissue. This is consistent with Fig. 6c, where the mapping of a heterogeneous non-tumor biopsy shows that the areas predicted as tumor (red areas) have less presence of collagen (darker green) in comparison with the areas predicted as non-tumor (black areas). In the same way, Fig. 6d and e show the mapping of mean prediction and collagen concentrations in homogeneous and heterogeneous tumor biopsies, respectively.
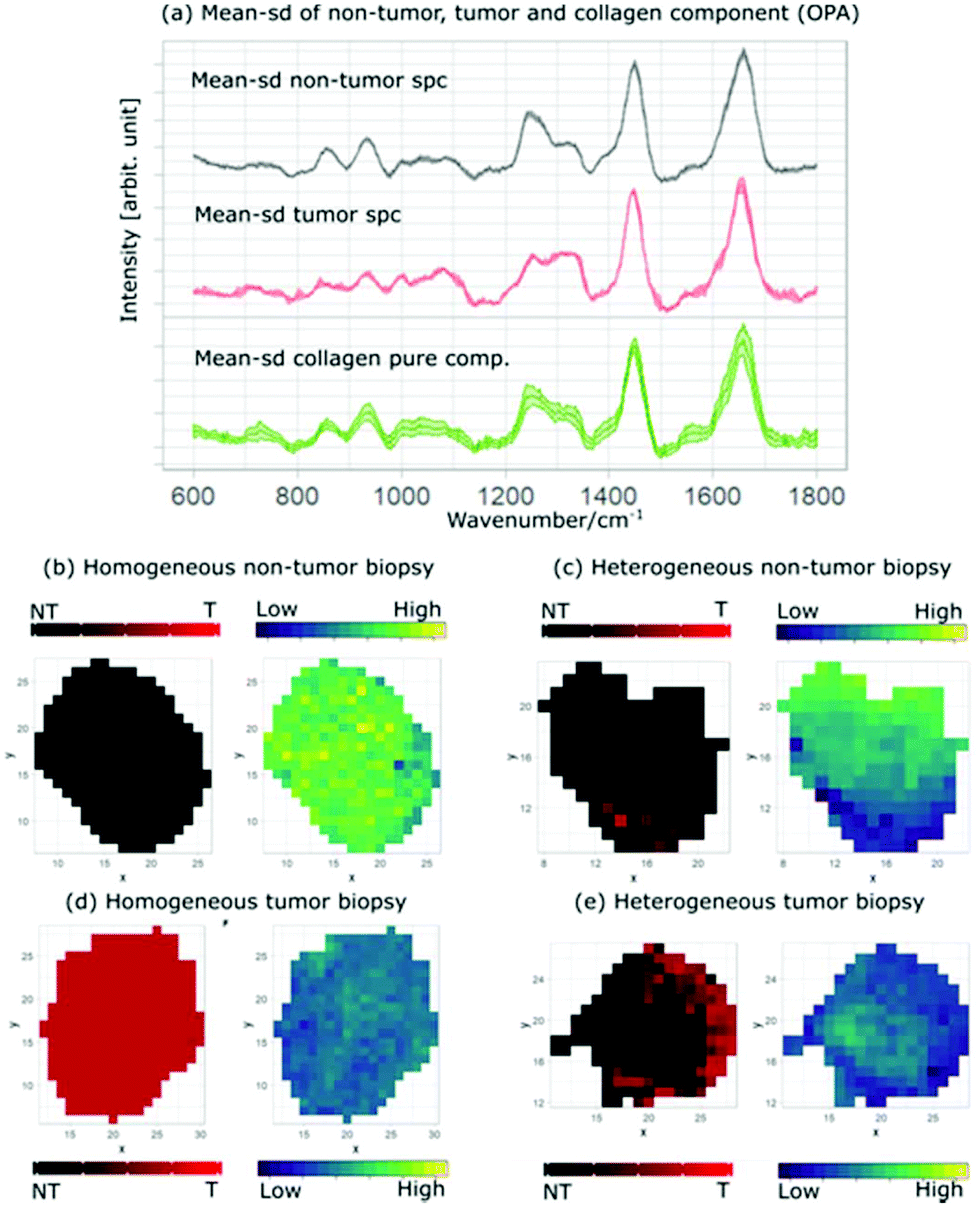 | ||
| Fig. 6 Mean-sd (standard deviation) spectra and the corresponding collagen pure component: (a) mean and standard deviation of non-tumor spectra of the homogeneous non-tumor biopsy (black), homogeneous tumor biopsy (red) and extracted pure collagen from non-tumor biopsies (green). Mean prediction and MCR collagen concentration for (b) homogeneous non-tumor, (c) heterogeneous non-tumor, (d) heterogeneous tumor and (e) heterogeneous tumor biopsies. The minimum collagen concentration value is 0.043 and the maximum value is 0.052. | ||
The homogeneous tumor biopsy shows a distinct difference when compared to the homogeneous non-tumor biopsy, where the dark colored area indicates a low presence of collagen. Similarly, the areas predicted as non-tumor in Fig. 6d are brighter than the areas predicted as tumor for the heterogeneous tumor tissue. This contrast is depicted easily by comparing the prediction and collagen distribution maps in Fig. 6. The black area of the prediction map (left) is non-tumor and is lighter colored in the collagen distribution map (right). The correlation between the prediction maps and the collagen distribution maps provides an insight into the relation between one of the main bladder tissue constituents and the tumor regions of the analyzed tissue.
OCT-Raman combination
The combination of RS and OCT opens a new means to better comprehend the essential basis of the data. Even though both modalities are based on different physical origins, i.e. OCT depends on the light scattering due to changes of the index of refraction in the tissue, and RS relies on the molecular vibrational bonds in the sample, both origins are inherently coupled. The collected imaging data of the two complementary modalities were acquired in a co-registered manner, offering the possibility to correlate molecular and morphological features from the same locations.The correlation was performed, first by stitching the OCT stacks and applying an in-house developed algorithm to compute the surface curvature of the biopsy, which allowed for the flattening of the surface. After the curvature correction, the mean of the biopsy in the z-dimension was calculated, and the obtained image was employed to compute a mask for locations belonging to the biopsy and locations outside the biopsy. The RS data were pre-treated as described in the Materials and methods section, and the mean prediction Raman map was employed to correlate the OCT and RS data. The RS mean prediction map was interpolated to account for the size difference between the Raman map and the OCT image. Furthermore, because the OCT scan covered more area than the RS map, the RS map was used as a mask for the OCT image. Transparency was applied to the RS map in order to provide visual information of both the OCT image and the Raman map.
Fig. 7 shows the transition of tumor to non-tumor area using the combined information of both modalities. To better visualize the data, images were displayed for both modalities indicating a healthy bladder wall structure within a cancerous lesion. An OCT cross-sectional and en-face image of a biopsy, which was histopathologically diagnosed as pTa low-grade tumor is shown in Fig. 7a. The overlaid Raman information of the tumor margin, where the red shade is the predicted tumor fraction and the black shade is the predicted non-tumor fraction as established by the ML1 model, is shown in Fig. 7b. The bright features of the lamina propria appear in the OCT image, which indicates a pronounced transition between the urothelium and the lamina propria in the healthy bladder wall and are well correlated to the regions that were predicted as non-tumor tissues by RS. To better visualize the information, cross-sectional images of the indicated regions marked by the colored lines are framed in green and yellow. The cross-sectional images are maximum projections of 10 scans around the indicated position. This combination of both modalities enables a better comprehension of the underlying signal origin and enables further localized pathological analysis of the biopsies with localized diagnosis to provide more detailed histopathological labels. This can lead to increased accuracy given by computer-assisted classification of tumor and non-tumor areas, providing a strong indication that the combination of optical label-free modalities can provide a comprehensive, localized diagnostic value.
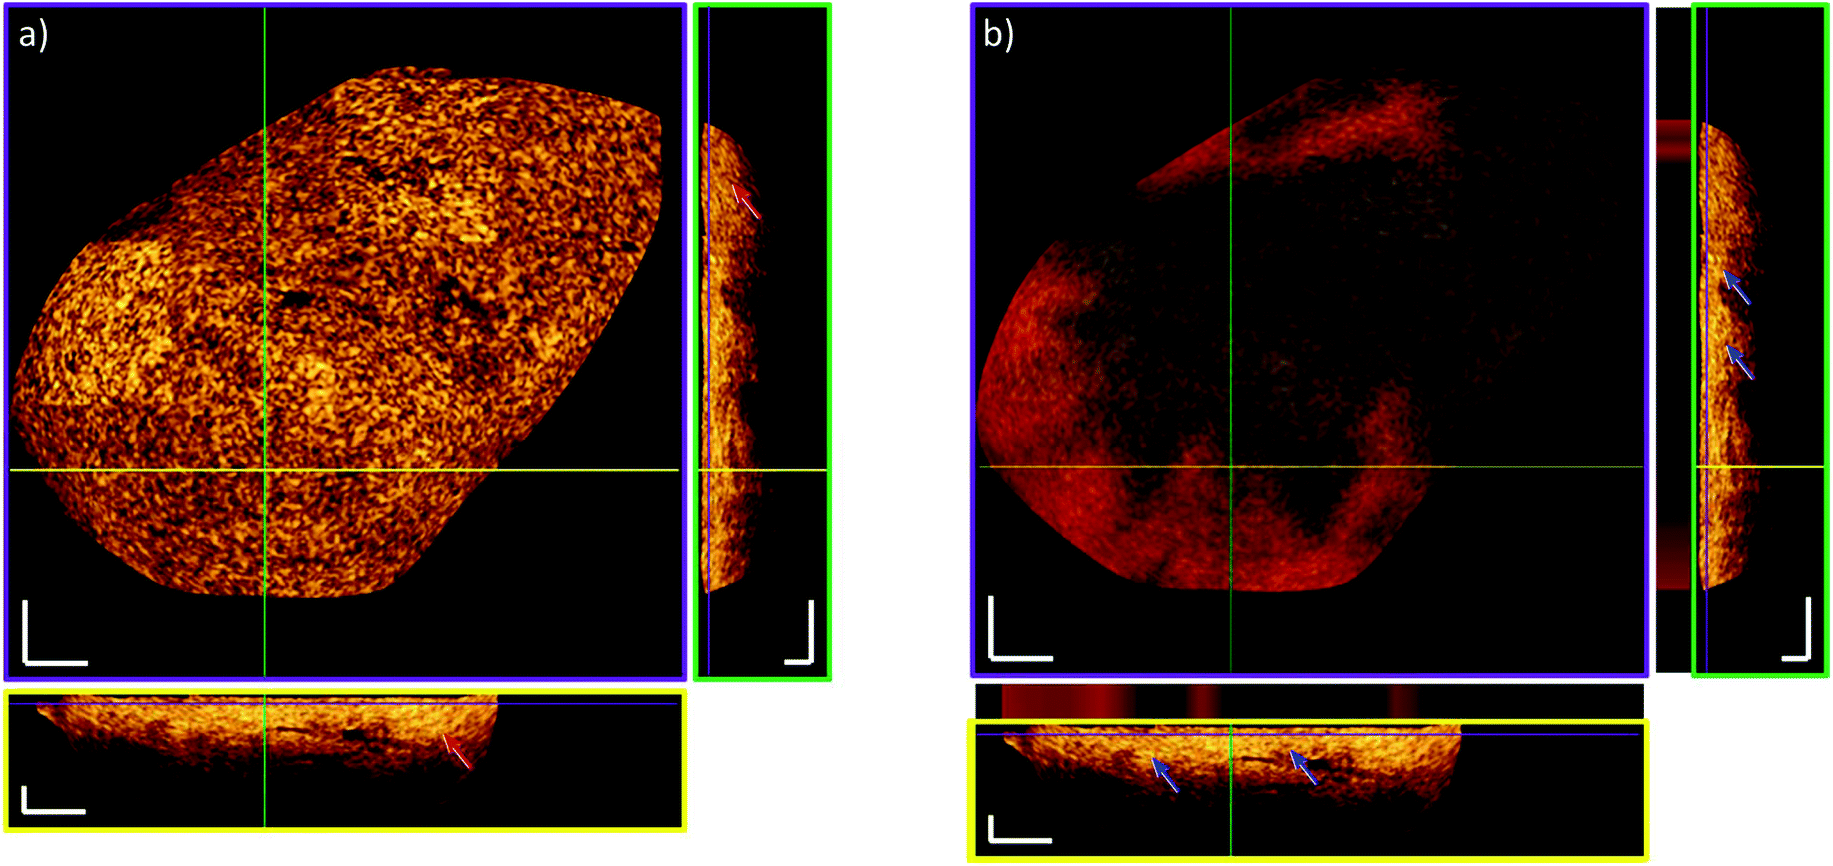 | ||
| Fig. 7 Heterogeneity of a pTa low grade labelled biopsy. (a) OCT scan: Red arrows indicate loss of transition between the urothelium and the lamina propria showing a pTa stage cancer. (b) OCT-RS combination: Model system ML1 highlights tumor (red) and non-tumor (black) areas and it is overlapped to the OCT image (en-face and B-scans). The blue arrows point to regions of present lamina propria. The lamina propria appears bright in the OCT image and RS predicts the non-tumor tissue (black color within the stripes above the B-scans). The purple framed image indicates the en-face image. Cross-sectional images are framed in green and yellow. Locations within the 3D stack are marked with colored lines. Cross-sectional images are maximum projections of 10 scans around the shown position. Scale bars: 250 μm. | ||
Although biopsy handling and the pathological examination, such as biopsy torsion or discrete biopsy labels, influence the performance, the achieved accuracies of 73% and 77% for OCT and RS, respectively, are promising for future in vivo tests, allowing the determination of the stage and grade simultaneously in vivo. Here, artefacts from sample handling will become completely negligible, additionally improving the accuracy.
Conclusions
In summary, we have demonstrated that fiber-probe based OCT and RS are suitable to provide clinically relevant information for detection and grading of NMIBC biopsies. Here, a forward looking, piezoelectric tube-based OCT probe is used for a comprehensive characterization of bladder cancer lesions for the first time, providing volumetric morphological information of entire biopsies. The presented OCT probe provides sufficiently high optical performance to determine small morphological structures in depth. Raman spectroscopy, on the other hand, demonstrates clear spectral differentiation of tumor and non-tumor, and low- and high-grade lesions in the bladder tissue based on the biomolecular composition. By developing an imaging platform that combines both modalities using forward-viewing fiber-optical probes, it was possible to acquire morphological volumetric images of biopsies and to create co-localized and co-registered hyperspectral molecular maps for the sample, providing comprehensive diagnostic information for the penetration and grade of bladder cancer at an early stage. By performing the study using fiber-optic probes and a large number of samples, it was possible to evaluate the relevant parameters of the probes for the in vivo application of OCT and RS. For example, it was possible to show that the piezoelectric tube-based OCT probe is mechanically stable to conduct a reproducible measurement of more than 100 biopsies with more than 1000 individual stack acquisitions over an extended period of time. Probe parameters, such as the outer dimension, meet the restrictions given by surgical instruments for in vivo applications, including additional sheathing for biocompatibility and safety. The parameter evaluation reveals adequate power levels and performance for visualization of the clinically relevant data for both modalities. The presented axial and lateral resolution for OCT and a sensitivity of 99 dB are sufficient. The FOV should be as big as possible, but a diameter of 1 mm is enough to identify and characterize relevant lesions. The excitation power of 70 mW and 11 mW used by RS and OCT, respectively, are well within the limit for maximum permissible exposure on skin and suitable for in vivo applications. The required acquisition times of 0.5 s and 2 s for RS and OCT, respectively, are suitable for interoperative handling by urologists during bladder examination. Comparing OCT and RS, one can see that OCT can acquire information from a larger FOV faster, allowing for the detection of cancerous lesions. RS, on the other hand, provides higher sensitivity, specificity and accuracy for differentiating tumor from non-tumor tissues, and additionally allows the grading of tumors. As such, OCT can be used as a red-flag technology and RS can be used to provide diagnostic information. Moreover, the results serve substantially as the next step towards in vivo testing of the OCT-RS combination. The presented findings pave the way for the development of multimodal, endoscopic probes enabling OCT and RS to supply the clinicians with clinically important, localized information in real time, which is until now only accessible after histopathological examination.Conflicts of interest
There are no conflicts to declare.Acknowledgements
This project has received funding from the European Union project MIB (Horizon 2020, grant agreement No 667933) and the European Union's Horizon 2020 research and innovation program under the Marie Skłodowska-Curie grant agreement No 721766, FBI.References
- T. Vos, C. Allen, M. Arora, R. M. Barber, Z. A. Bhutta and A. Brown, et al. , Lancet, 2016, 388, 1545–1602 CrossRef.
- M. Burger, J. W. F. Catto, G. Dalbagni, H. B. Grossman, H. Herr, P. Karakiewicz, W. Kassouf, L. A. Kiemeney, C. La Vecchia, S. Shariat and Y. Lotan, Eur. Urol., 2013, 63, 234–241 CrossRef PubMed.
- B. W. G. van Rhijn, M. Burger, Y. Lotan, E. Solsona, C. G. Stief, R. J. Sylvester, J. A. Witjes and A. R. Zlotta, Eur. Urol., 2009, 56, 430–442 CrossRef PubMed.
- R. Madeb, D. Golijanin, J. Knopf and E. M. Messing, Expert Rev. Anticancer Ther., 2007, 7, 981–987 CrossRef PubMed.
- J. Schmidbauer, F. Witjes, N. Schmeller, R. Donat, M. Susani and M. Marberger and, Members Of The Hexvix PCB301/01 Study Group, J. Urol., 2004, 171, 135–138 CrossRef PubMed.
- M. Babjuk, A. Böhle, M. Burger, O. Capoun, D. Cohen, E. M. Compérat, V. Hernández, E. Kaasinen, J. Palou, M. Rouprêt, B. W. G. van Rhijn, S. F. Shariat, V. Soukup, R. J. Sylvester and R. Zigeuner, Eur. Urol., 2017, 71, 447–461 CrossRef PubMed.
- C. J. Down, R. Nair and R. Thurairaja, Surgery, 2016, 34, 532–539 Search PubMed.
- J. D. Brierley, M. K. Gospodarowicz and C. Wittekind, TNM Classification of Malignant Tumours, John Wiley & Sons, 8th edn, 2016, pp. 204–208 Search PubMed.
- P. A. Humphrey, H. Moch, A. L. Cubilla, T. M. Ulbright and V. E. Reuter, Eur. Urol., 2016, 70, 106–119 CrossRef PubMed.
- I. Kausch, M. Sommerauer, F. Montorsi, A. Stenzl, D. Jacqmin, P. Jichlinski, D. Jocham, A. Ziegler and R. Vonthein, Eur. Urol., 2010, 57, 595–606 CrossRef PubMed.
- W. Zheng, W. Lau, C. Cheng, K. C. Soo and M. Olivo, Int. J. Cancer, 2003, 104, 477–481 CrossRef CAS PubMed.
- E. Pery, W. C. P. M. Blondel, S. Tindel, M. Ghribi, A. Leroux and F. Guillemin, IEEE Trans. Biomed. Eng., 2014, 61, 207–216 Search PubMed.
- D. Huang, E. Swanson, C. Lin, J. Schuman, W. Stinson, W. Chang, M. Hee, T. Flotte, K. Gregory and C. Puliafito, et al. , Science, 1991, 254, 1178 CrossRef CAS PubMed.
- W. Drexler and J. Fujimoto, Prog. Retinal Eye Res., 2008, 27, 45–88 CrossRef PubMed.
- G. J. Tearney, S. A. Boppart, B. E. Bouma, M. E. Brezinski, N. J. Weissman, J. F. Southern and J. G. Fujimoto, Opt. Lett., 1996, 21, 543–545 CrossRef CAS PubMed.
- T. Xie, H. Xie, G. K. Fedder and Y. Pan, Appl. Opt., 2003, 42, 6422–6426 CrossRef PubMed.
- M. J. Gora, J. S. Sauk, R. W. Carruth, K. A. Gallagher, M. J. Suter, N. S. Nishioka, L. E. Kava, M. Rosenberg, B. E. Bouma and G. J. Tearney, Nat. Med., 2013, 19, 238–240 CrossRef CAS PubMed.
- E. Zagaynova, N. Gladkova, N. Shakhova, G. Gelikonov and V. Gelikonov, J. Biophotonics, 2008, 1, 114–128 CrossRef CAS PubMed.
- Optical coherence tomography: technology and applications, ed. W. Drexler and J. G. Fujimoto, Springer, Cham, 2nd edn, 2015 Search PubMed.
- I. W. Schie and T. Huser, Appl. Spectrosc., 2013, 67, 813–828 CrossRef CAS PubMed.
- C. Krafft, in Encyclopedia of Biophysics, ed. G. C. K. Roberts, Springer Berlin Heidelberg, Berlin, Heidelberg, 2013, pp. 2178–2185 Search PubMed.
- A. De Luca, K. Dholakia and M. Mazilu, Sensors, 2015, 15, 13680–13704 CrossRef CAS PubMed.
- I. W. Schie and J. W. Chan, J. Raman Spectrosc., 2016, 47, 384–390 CrossRef CAS.
- T. C. Bakker Schut, R. Wolthuis, P. J. Caspers and G. J. Puppels, J. Raman Spectrosc., 2002, 33, 580–585 CrossRef CAS.
- A. Beljebbar, O. Bouché, M. D. Diébold, P. J. Guillou, J. P. Palot, D. Eudes and M. Manfait, Crit. Rev. Oncol. Hematol., 2009, 72, 255–264 CrossRef CAS PubMed.
- L. F. C. S. Carvalho, M. S. Nogueira, L. P. M. Neto, T. T. Bhattacharjee and A. A. Martin, Biomed. Opt. Express, 2017, 8, 5218 CrossRef CAS PubMed.
- A. Chaichi, A. Prasad and M. R. Gartia, Biosensors, 2018, 8, 107 CrossRef CAS PubMed.
- R. Smith, K. L. Wright and L. Ashton, Analyst, 2016, 141, 3590–3600 RSC.
- P. Chen, A. Shen, X. Zhou and J. Hu, Anal. Methods, 2011, 3, 1257–1269 RSC.
- N. Bergner, T. Bocklitz, B. F. M. Romeike, R. Reichart, R. Kalff, C. Krafft and J. Popp, Chemom. Intell. Lab. Syst., 2012, 117, 224–232 CrossRef CAS.
- M. Ji, D. A. Orringer, C. W. Freudiger, S. Ramkissoon, X. Liu, D. Lau, A. J. Golby, I. Norton, M. Hayashi, N. Y. R. Agar, G. S. Young, C. Spino, S. Santagata, S. Camelo-Piragua, K. L. Ligon, O. Sagher and X. S. Xie, Sci. Transl. Med., 2013, 5, 201ra119–201ra119 Search PubMed.
- B. Brożek-Płuska, I. Placek, K. Kurczewski, Z. Morawiec, M. Tazbir and H. Abramczyk, J. Mol. Liq., 2008, 141, 145–148 CrossRef.
- H. Abramczyk, B. Brozek-Pluska, J. Surmacki, J. Jablonska-Gajewicz and R. Kordek, Prog. Biophys. Mol. Biol., 2012, 108, 74–81 CrossRef CAS PubMed.
- K. Deng, C. Zhu, X. Ma, H. Jia, Z. Wei, Y. Xiao and J. Xu, PLoS One, 2016, 11, e0159860 CrossRef PubMed.
- S. Duraipandian, W. Zheng, J. Ng, J. J. H. Low, A. Ilancheran and Z. Huang, Anal. Chem., 2012, 84, 5913–5919 CrossRef CAS PubMed.
- S. Duraipandian, W. Zheng, J. Ng, J. J. H. Low, A. Ilancheran and Z. Huang, in Integrated fingerprint and high wavenumber confocal Raman spectroscopy for in vivo diagnosis of cervical precancer, ed. A. Mahadevan-Jansen, T. Vo-Dinh and W. S. Grundfest, San Francisco, California, USA, 2013, p. 85720Z Search PubMed.
- C. M. O’Brien, E. Vargis, C. Slaughter, A. P. Rudin, J. L. Herington, K. A. Bennett, J. Reese and A. Mahadevan-Jansen, in Characterization of human cervical remodeling throughout pregnancy using in vivo Raman spectroscopy, ed. B. Choi, N. Kollias, H. Zeng, H. W. Kang, B. J. F. Wong, J. F. Ilgner, A. Nuttal, C.-P. Richter, M. C. Skala, M. W. Dewhirst, G. J. Tearney, K. W. Gregory, L. Marcu, A. Mandelis and M. D. Morris, San Francisco, California, United States, 2015, p. 93032F Search PubMed.
- Z. Huang, A. McWilliams, H. Lui, D. I. McLean, S. Lam and H. Zeng, Int. J. Cancer, 2003, 107, 1047–1052 CrossRef CAS PubMed.
- M. S. Bergholt, W. Zheng, K. Lin, J. Wang, H. Xu, J. Ren, K. Y. Ho, M. Teh, K. G. Yeoh and Z. Huang, Anal. Chem., 2015, 87, 960–966 CrossRef CAS PubMed.
- S. Devpura, J. S. Thakur, F. H. Sarkar, W. A. Sakr, V. M. Naik and R. Naik, Vib. Spectrosc., 2010, 53, 227–232 CrossRef CAS.
- N. Stone, M. C. Hart Prieto, P. Crow, J. Uff and A. W. Ritchie, Anal. Bioanal. Chem., 2007, 387, 1657–1668 CrossRef CAS PubMed.
- H. Chen, X. Li, N. Broderick, Y. Liu, Y. Zhou, J. Han and W. Xu, J. Biophotonics, 2018, 11, e201800016 CrossRef PubMed.
- E. Cordero, J. Biomed. Opt., 2018, 23, 1 Search PubMed.
- L. T. Kerr, K. Domijan, I. Cullen and B. M. Hennelly, Photonics Lasers Med., 2014, 3, 193–224 Search PubMed.
- A. C.-T. Ko, L.-P. Choo-Smith, M. Hewko, L. Leonardi, M. G. Sowa, C. C. S. Dong, P. Williams and B. Cleghorn, J. Biomed. Opt., 2005, 10, 031118 CrossRef PubMed.
- C. A. Patil, N. Bosschaart, M. D. Keller, T. G. van Leeuwen and A. Mahadevan-Jansen, Opt. Lett., 2008, 33, 1135 CrossRef PubMed.
- J. W. Evans, R. J. Zawadzki, R. Liu, J. W. Chan, S. M. Lane and J. S. Werner, J. Biophotonics, 2009, 2, 398–406 CrossRef CAS PubMed.
- K. Egodage, S. Dochow, T. Bocklitz, O. Chernavskaia, C. Matthaeus, M. Schmitt and J. Popp, J. Biomed. Photonics Eng., 2015, 169–177 CrossRef.
- M. Mazurenka, L. Behrendt, M. Meinhardt-Wollweber, U. Morgner and B. Roth, Rev. Sci. Instrum., 2017, 88, 105103 CrossRef CAS PubMed.
- A. Varkentin, M. Mazurenka, E. Blumenröther, L. Behrendt, S. Emmert, U. Morgner, M. Meinhardt-Wollweber, M. Rahlves and B. Roth, J. Biophotonics, 2018, 11, e201700288 CrossRef PubMed.
- L. P. Rangaraju, G. Kunapuli, D. Every, O. D. Ayala, P. Ganapathy and A. Mahadevan-Jansen, Burns, 2019, 45, 659–670 CrossRef PubMed.
- K. Egodage, K. Egodage, C. Matthäus, C. Matthäus, S. Dochow, S. Dochow, I. W. Schie, I. W. Schie, C. Härdtner, I. Hilgendorf, J. Popp and J. Popp, Chin. Opt. Lett., 2017, 15, 090008 CrossRef.
- A. L. Presnell, O. Chuchuen, M. G. Simons, J. R. Maher and D. F. Katz, Drug Delivery Transl. Res., 2018, 8, 843–852 CrossRef CAS PubMed.
- P. C. Ashok, B. B. Praveen, N. Bellini, A. Riches, K. Dholakia and C. S. Herrington, Biomed. Opt. Express, 2013, 4, 2179 CrossRef PubMed.
- D. Bovenkamp, R. Sentosa, E. Rank, M. Erkkilä, F. Placzek, J. Püls, W. Drexler, R. Leitgeb, N. Garstka, S. Shariat, C. Stiebing, I. Schie, J. Popp, M. Andreana and A. Unterhuber, Appl. Sci., 2018, 8, 2371 CrossRef CAS.
- T. D. Jones and L. Cheng, J. Urol., 2006, 175, 1995–2003 CrossRef PubMed.
- S. P. Lerner, A. C. Goh, N. J. Tresser and S. S. Shen, Urology, 2008, 72, 133–137 CrossRef PubMed.
- S. P. Lerner, M. P. Schoenberg and C. N. Sternberg, Bladder Cancer: Diagnosis and Clinical Management, Wiley-Blackwell, 2015 Search PubMed.
- M. Bonesi, M. P. Minneman, J. Ensher, B. Zabihian, H. Sattmann, P. Boschert, E. Hoover, R. A. Leitgeb, M. Crawford and W. Drexler, Opt. Express, 2014, 22, 2632 CrossRef CAS PubMed.
- Z. Chen, M. Liu, M. Minneman, L. Ginner, E. Hoover, H. Sattmann, M. Bonesi, W. Drexler and R. A. Leitgeb, Biomed. Opt. Express, 2016, 7, 3032–3048 CrossRef CAS PubMed.
- L. M. Wurster, R. N. Shah, F. Placzek, S. Kretschmer, M. Niederleithner, L. Ginner, J. Ensher, M. P. Minneman, E. E. Hoover, H. Zappe, W. Drexler, R. A. Leitgeb and Ç. Ataman, J. Biophotonics, 2019, 12, e201800382 CrossRef PubMed.
- S. Vilches, S. Kretschmer, Ç. Ataman and H. Zappe, J. Micromech. Microeng., 2017, 27, 105015 CrossRef.
- K. W. Gossage, T. S. Tkaczyk, J. J. Rodriguez and J. K. Barton, J. Biomed. Opt., 2003, 8, 570 CrossRef PubMed.
- M. Bhattacharjee, P. C. Ashok, K. D. Rao, S. K. Majumder, Y. Verma and P. K. Gupta, J. Innovative Opt. Health Sci., 2011, 04, 59–66 CrossRef.
- O. Ryabchykov, T. Bocklitz, A. Ramoji, U. Neugebauer, M. Foerster, C. Kroegel, M. Bauer, M. Kiehntopf and J. Popp, Chemom. Intell. Lab. Syst., 2016, 155, 1–6 CrossRef CAS.
- E. Cordero, F. Korinth, C. Stiebing, C. Krafft, I. Schie and J. Popp, Sensors, 2017, 17, 1724 CrossRef PubMed.
- E. Cordero, J. Rüger, D. Marti, A. S. Mondol, T. Hasselager, K. Mogensen, G. G. Hermann, J. Popp and I. W. Schie, J. Biophotonics., 2019, e201960025 Search PubMed.
- T. Tran, C. P. Sundaram, C. D. Bahler, J. N. Eble, D. J. Grignon, M. F. Monn, N. B. Simper and L. Cheng, J. Cancer, 2015, 6, 759–766 CrossRef PubMed.
- B. S. Clarke, T. A. Banks and L. Findji, Can. J. Vet. Res., 2014, 78, 46–49 Search PubMed.
- Z. Movasaghi, S. Rehman and I. U. Rehman, Appl. Spectrosc. Rev., 2007, 42, 493–541 CrossRef CAS.
- K. Czamara, K. Majzner, M. Z. Pacia, K. Kochan, A. Kaczor and M. Baranska, J. Raman Spectrosc., 2015, 46, 4–20 CrossRef CAS.
- B. W. D. de Jong, T. C. Bakker Schut, K. Maquelin, T. van der Kwast, C. H. Bangma, D.-J. Kok and G. J. Puppels, Anal. Chem., 2006, 78, 7761–7769 CrossRef CAS PubMed.
Footnotes |
| † Electronic supplementary information (ESI) available. See DOI: 10.1039/c9an01911a |
| ‡ These authors contributed equally to this work. |
| This journal is © The Royal Society of Chemistry 2020 |