A chip-based potentiometric sensor for a Zika virus diagnostic using 3D surface molecular imprinting†
Vincent
Ricotta
 *a,
Yingjie
Yu
a,
Nicholas
Clayton
a,
Ya-Chen
Chuang
a,
Yantian
Wang
a,
Steffen
Mueller
b,
Kalle
Levon
c,
Marcia
Simon
d and
Miriam
Rafailovich
*a
aDepartment of Materials Science and Engineering, SUNY at Stony Brook, Stony Brook, NY 11794, USA. E-mail: Vincent.Ricotta35@gmail.com; Miriam.Rafailovich@stonybrook.edu
bCodagenix Inc., Farmingdale, NY 11735, USA
cDepartment of Chemical and Biological Sciences, Polytechnic Institute of NYU, Brooklyn, NY 11201, USA
dDepartment of Oral Biology and Pathology, SUNY at Stony Brook, Stony Brook, NY 11794, USA
First published on 10th June 2019
Abstract
The latest Zika virus (ZIKV) pandemic caused great international concern from explosively proliferating throughout the Americas. Currently, there is no vaccine to prevent Zika virus infection and available tests rely on antibodies or RNA. Unfortunately, antibody-based detection systems can result in false positive results and RNA-based detection systems are costly, time-consuming, and impractical for testing in remote regions. In this study, a potential point-of-care (POC) diagnostic system was developed using a chip-based potentiometric sensor to detect Zika virus using a 3D molecular imprinting technique. This chip-based potentiometric sensor system was able to detect 10−1 PFU mL−1 ZIKV in a buffered solution under 20 minutes without any sample manipulation. This sensor was tested against Dengue virus at clinical viral loads and showed no sign of cross-reactivity. When tested against human saliva samples containing clinical viral loads, this sensor was able to detect 10 PFU mL−1 ZIKV among the pool of bio-macromolecules. The high sensitivity and high selectivity demonstrated here proved that this lab-on-a-chip diagnostic has the potential to become a POC detection system for rapid and accurate screening of flaviviruses.
1 Introduction
The emerging Zika virus (ZIKV) epidemic is a public health threat of international concern that is rapidly spreading throughout tropical and subtropical Americas.1,2 ZIKV was first discovered in 1947 after isolating it from the serum of a caged pyrexial rhesus monkey in the Zika forest of Uganda.3 The first documented case of a human infected with ZIKV was published in 1954.4 In the succeeding decades, documented cases of human infection were relatively rare. ZIKV started to acquire global awareness following the first major ZIKV outbreak that occurred in Southeast Asia in 2007 and subsequently in 2013.5,6 In 2015, the ZIKV outbreak was documented in Brazil before explosively proliferating in the Americas creating a pandemic.7Today with international air travel, the virus is rapidly spreading with cases already reported in the US, especially in regions where mosquitoes can survive year-round. ZIKV is a member of the mosquito-borne virus family Flaviviridae and genus flavivirus, which also includes Dengue virus (DENV), Japanese encephalitis virus (JEV), tick-borne encephalitis virus (TBEV), West Nile virus (WNV), and yellow fever virus (YFV).7,8 This mosquito-borne arbovirus is primarily transmitted through the bite from the infected Aedes mosquito species.1,7–11 Unfortunately, ZIKV transmission is also possible through perinatal transmission, sexual contact, blood transfusion, and physical contact.12–19 Not only are the modes of ZIKV transmission complex, but also some of the symptoms associated with ZIKV infection have caused major concern.13
The majority of human ZIKV infection cases come across as asymptomatic; therefore subjects may not even know that they are infected. If present, the symptoms associated with ZIKV infection in adults are fairly mild, mimic those related to other flavivirus and influenza infections, and hence are frequently misdiagnosed.20–23 Following the bite of an infected mosquito, there is an incubation period of 3 to 12 days and then clinical manifestation in symptomatic cases persists for 2 to 7 days.24,25 However, ZIKV became a major health concern subsequently after being linked to the steep increase in the documented cases of prenatal microcephaly, the Guillain–Barré syndrome (GBS), and other severe neurological birth defects in neonates in the Americas following the recent ZIKV outbreak.26–30 Consequently, ZIKV infection has rapidly spread from a few cases first reported in Micronesia in 2007 to thousands of cases today across several continents.31 In response to the ZIKV crisis, the World Health Organization (WHO) declared ZIKV as a public health emergency of international concern (PHEIC) in 2016 and called for fast-tracked development of ZIKV diagnostics.28,32 Fortunately, the peak of the recent ZIKV outbreak occurred in 2016 and since then there has been a drastic reduction in the reported cases of ZIKV infection in the Americas.33,34 Even though the ZIKV pandemic is on the decline, there is still a demand for rapid diagnostics with regard to the recent ZIKV outbreak being linked to prenatal microcephaly and GBS.
Currently there is no licensed ZIKV vaccine available and rapid, early diagnosis of ZIKV infection is difficult. ZIKV can be detected in many body fluids, including plasma, serum, urine, saliva, and semen.35–41 Typical viremia found in a symptomatic patient with ZIKV infection ranges from 103 to 106 plaque forming units (PFU) mL−1.42 The complexity associated with ZIKV infection is significantly increased due to the prolonged potential for sexual transmission of ZIKV.38 Since plasma and serum assay collections are invasive and subjects may not wish to provide a urine or semen sample, saliva testing for ZIKV infection would be more favored. ZIKV RNA detection is significantly higher in saliva than in serum even within the first 5 days of the symptom onset, while yielding comparable results to those of urine in the acute-phase and late stage of ZIKV infection.38,40 In general, detection of ZIKV infection should be performed by testing saliva samples since it is noninvasive and yields high viral loads.
Due to the urgency of the situation and lack of an acceptable point-of-care (POC) diagnostic, the FDA initially issued an Emergency Use Authorization (EUA) for suspected ZIKV infected patients to be screened with antibody-based detection methods.13,36,43,44 However, diagnosing ZIKV infection from the detection of antibodies can give rise to major uncertainties due to high cross-reactivity to antibodies against other flaviviruses, mostly DENV. This is especially the case when the ZIKV infected subject has a history of infection and/or vaccination against other flaviviruses.36 As a result of the high serological cross-reactivity with other flaviviruses via antibody-based detection, the FDA then issued an EUA for ZIKV patients to be screened with reverse-transcription polymerase chain reaction (RT-PCR).42,43 In contrast to the conventional RT-PCR, real-time RT-PCR (rRT-PCR) assays with specific sets of primers were developed in order to increase the sensitivity and selectivity in the detection of different ZIKV strains.36,40,45 rRT-PCR is currently the method of choice when it comes to detecting human ZIKV infection; yet the low viremia associated with ZIKV and the necessity to amplify the RNA before testing drastically slow the process down. It may take up to 3 hours minimum to complete an rRT-PCR if you include the time needed to extract, purify, and then amplify the ZIKV RNA from the collected sample. Furthermore, ZIKV is endemic to a majority of regions that are associated with large populations living in poverty and have health care centers incapable of performing ELISA or rRT-PCR due to the lack of financial sources or technical expertise. There are several reports claiming the development of a potential POC diagnostic that has the ability to replace ELISA and rRT-PCR in the detection of human ZIKV infection. The potential POC diagnostic tests may have a desirable limit of detection (LOD) value compared to that of rRT-PCR (Table 1); yet they all involve some form of an elaborate step or reagent that may not be easily accessible and durable in remote locations.46–52 A desirable POC diagnostic test would be a detection system that does not require any manipulation of the sample to be tested. Therefore, there is an urgent need for an accurate and feasible POC diagnostic for ZIKV infection that can be utilized anywhere, even in remote regions with limited resources.
| Detection method/device | Limit of detection (PFU mL−1) | Diagnostic test time (min) |
|---|---|---|
| a This time does not include the time needed to extract the RNA or run an agarose gel. b This time includes the time needed to extract, purify, and then amplify the RNA. c This report was based on the detection of synthetic ZIKV oligonucleotides. (a) Faye et al. (2008)42; (b) Faye et al. (2013)45; (c) Lanciotti et al. (2008)36; (d) Pardee et al. (2016)49; (e) Tian et al. (2016)50; (f) Song et al. (2016)51; and (g) Kurosaki et al. (2017)52. | ||
| Conventional reverse-transcription polymerase chain reaction (RT-PCR) (a) | 337 | 80a |
| Real-time reverse-transcription polymerase chain reaction (rRT-PCR) (b,c) | 0.05–1.86 | 180b |
| Programmable biosensors combined with nucleic acid sequence-based amplification (NASBA) (d) | 3.4 × 10⁴ | < 180 |
| Loop-mediated isothermal amplification (LAMP)-based optomagnetic biosensors paired with AC susceptometry (e) | 1.2 | 27c |
| Portable chemically heated reverse-transcription loop-mediated isothermal amplification (RT-LAMP) (f) | 50–100 | < 40 |
| Portable battery-powered reverse-transcription loop-mediated isothermal amplification (RT-LAMP) (g) | 0.7–15 | 15 |
We propose that our molecular imprinting (MI) detection system can be utilized as a POC diagnostic to detect relatively low levels of ZIKV. Chip-based biosensing methods are a promising technique for detecting analytes and make wireless transmission of test results possible for remote regions.51,53–60 These devices provide results quickly, are relatively inexpensive, portable, and have the capability of being integrated into smart responsive biomedical systems.59 This MI technique was first introduced in 2003 when octadecyltrichlorosilane (OTS) self-assembled monolayers (SAM) and chiral templates were co-adsorbed on indium-tin oxide (ITO) electrodes to detect amino acids. Not only did these sensors display high sensitivity and selectivity, but also determined the chirality of the amino acids.61 Unfortunately, the hydrophobic nature of OTS limited these sensors to detect analytes capable of dissolving in non-polar solvents. Also, these sensors were only able to detect molecules that had similar dimensions to those of the OTS SAM. When replacing the backbone of the imprinting SAM with hydrophilic moieties, such as hydroxyl-terminated alkanethiols, larger bio-macromolecules can be detected. In contrast to the model of detecting solely molecules with similar dimensions to the SAM,61 entire proteins can be recognized through the addition of hydrogen bonding and van der Waals interactions.53,54,62 A 3D surface MI model was later proposed which demonstrated that the efficiency and sensitivity of a MI biosensor depended on not only the size of the analyte relative to the SAM thickness, but also the size of the analyte relative to the surface roughness of the SAM substrate. This model clearly illustrated that the substrate surface morphology forms a niche surrounding the analyte while the SAM adsorbs around the analyte in a 3D fashion.59 This potentiometric MI detection system has the potential to replace ELISA and rRT-PCR as a rapid POC diagnostic.58 A 3.8 Å resolution cryo-electron microscopy image recently revealed that ZIKV has a similar structure (radius of 24.5 nm) to that of other flaviviruses, except for the few repeating glycosylated envelop proteins protruding from the surface that make it unique from other flaviviruses and even among other strains of ZIKV.63–65 By matching the surface roughness of our electrode with the dimensions of ZIKV, we can successfully detect ZIKV with high sensitivity and selectivity against other flaviviruses. Using this technique would allow the detection of ZIKV in the presence of other bio-macromolecules present in various types of body fluids. In this study, a real-time and label-free sensing method was developed with the potential to become an accurate, rapid POC diagnostic for ZIKV that would require minimal technical expertise or sample manipulation.
2 Materials and methods
2.1 Materials
11-Mercapto-1-undecanol (SH-(CH2)11-OH; 97% referred to as “thiol” hereafter), potassium ferrocyanide (K4[Fe(CN6)]; ≥ 98.5%), potassium ferricyanide (K3[Fe(CN6)]; ≥ 99%), sodium chloride (NaCl; ACS reagent, ≥ 99%), potassium chloride (KCl; ≥ 99%), Tween 20, and acetone (HPLC Plus, ≥ 99.9%) were all purchased from Sigma-Aldrich. DENV type 2 strain 16681 and ZIKV strain PRVABC59 were obtained from Codagenix Inc. Dimethyl sulfoxide (DMSO; certified ACS) was purchased from Fisher Scientific and adhesive polytetrafluoroethylene (PTFE) tape (S-14538) was purchased from ULINE. Silicon wafers, (100) orientation, were purchased from Wafer World, Inc. with a 100 mm diameter. Ag/AgCl reference electrodes (MW-2030 and MF-2052), a coiled Pt wire auxiliary electrode (MW-1033), and a 15 mL electrochemical glass cell vial (MF-1084) were purchased from BASi. Dulbecco's phosphate buffered saline (1× dPBS), without calcium chloride or magnesium chloride, was purchased from Life Technologies. Human saliva was collected by the institutional IRB-approved human subject research protocol (IRB 1212002). Informed consent was obtained from all human subjects prior to collecting saliva samples. Deionized water (DI H2O) was prepared in-house using a MilliporeSigma Direct-Q 3 UV-R water purification system at 23.0 ± 1.0 MΩ cm. Ethyl alcohol (200 proof) was purchased from Pharmco-AAPER.2.2 Gold chip fabrication
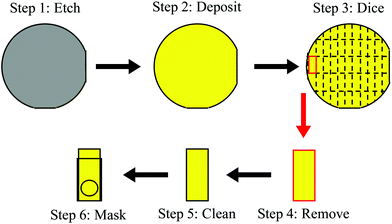
All fabrication of the titanium/gold chips used in this work was performed in a class 1000 and class 100 cleanroom space at the Advanced Science Research Center NanoFabrication Facility of the Graduate Center at the City University of New York. First, the 100 mm diameter single crystal (100) silicon wafers were cleaned by isotropic etching via vapor hydrofluoric acid (HF) for 180 seconds using an SPTS Primaxx Vapor HF Etcher. The cleaned wafers were then loaded in an electron-beam physical evaporator (AJA Orion 8E Evaporator System). The wafers were affixed to a loading chuck using Kapton tape and then purged with nitrogen gas prior to placing in the evaporator loading chamber. Under high vacuum (<9 × 10⁻⁸ Torr), the adhesion layer of titanium was deposited at a rate of 0.05 ± 0.01 nm s−1 to reach a final thickness of 3.00 ± 0.05 nm. The gold layer was deposited over the titanium layer initially at a rate of 0.01 nm s−1 and then gradually increased to 0.20 ± 0.02 nm s−1 to reach a final thickness of 50.00 ± 0.20 nm. Using an Ultron UH114 tape mounter, the titanium/gold-coated wafers were mounted to dicing tape and a metal frame to be used with a dicing saw. The titanium–gold coated side of the wafers was affixed to the dicing tape in order to prevent damage to the deposited films during manipulation and transportation. A Disco DAD3320 dicing saw was used to dice 8 × 20 mm sections into the 100 mm diameter wafers. An Ultron Systems UV curing system was used to cure the dicing tape on the diced wafer for 30 seconds. The diced 8 × 20 mm chips were removed from the dicing tape and soaked in acetone for at least 10 minutes to dissolve any residue from the dicing tape. The chips were then rinsed with DI H2O, absolute ethanol, and again with DI H2O. A 6 mm diameter hole was made in the PTFE tape using a single-hole punch and the tape was then wrapped around the cleaned chip. The PTFE tape acted as a mask for the chip by exposing only the 6 mm diameter hole as the working area of the electrode and exposing sufficient gold (2–4 mm) on the opposite end to connect to the potentiometer. Prior to the MI process, this 2–4 mm exposed gold area on the chip was covered with additional PTFE tape. Following the MI and washing process, this additional PTFE tape on the 2–4 mm exposed gold area was removed. Having the same working area for each MI chip allowed for electrochemical responses from different chips to be quantitatively compared. This complete fabrication is illustrated in Fig. 1 and was carried out by depositing films on either the “smooth” polished side of the silicon wafers or the “rough” unpolished side of the silicon wafer. Chromium/gold (10 nm/100 nm) coatings on single crystal (100) silicon wafers were also prepared.58 Aside from the initial quality control testing of the gold chips (ESI†), the titanium/gold chips were primarily used in this work.2.3 MI process
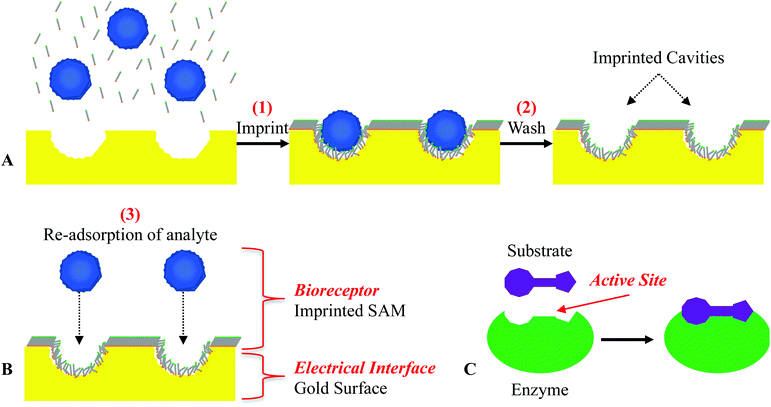
To prepare the thiol-only SAM on the chips, different concentrations of thiol/DMSO and 1× dPBS were prepared. After optimizing the concentration of thiol/DMSO (ESI†), a final thiol concentration of 100 μM was used for the MI process. To prepare the MI (thiol co-adsorbed with ZIKV or DENV) SAM on the chips, different concentrations of ZIKV or DENV were diluted in 1× dPBS and mixed with thiol/DMSO. The virus and thiol solutions were prepared as follows: the targeted virus was diluted in 1× dPBS at various concentrations, ranging from 104 to 107 PFU mL−1, and the thiols were dissolved in DMSO. The 2 solutions were mixed (19/1 [v/v], respectively for 1× dPBS/DMSO) and continuously stirred for at least 10 minutes with a magnetic stirrer and stir bar at 300–500 rpm. The masked 8 × 20 mm chips were rinsed with DI H2O immediately before being soaked in 2 mL of the mixed imprinting solution inside a closed 20 mL scintillation vial for 2.5 hours. After optimizing the washing steps (ESI†), the imprinted chips were rinsed with DI H2O and then soaked in 10 mL of 3 M NaCl in a closed 20 mL scintillation vial at 37 °C while being gently agitated on a top rocking platform overnight (16–20 hours). The washed chips were rinsed with DI H2O and then soaked in 10 mL DI H2O in a closed 20 mL scintillation vial at 37 °C while being gently agitated on a top rocking platform for 30 minutes. The washed MI chips were stored in the vial of DI H2O until being tested, which occurred within 10 hours.This MI technique using hydroxyl-terminated alkanethiols involves: (1) imprinting, which is the co-adsorption of the target bio-macromolecule and hydroxyl-terminated alkanethiols on a gold-coated chip; (2) washing, where the “imprinted” bio-macromolecules are removed from the gold-coated chip leaving behind imprinted cavities specific to the size and conformation of the “imprinted” bio-macromolecules; and (3) re-adsorption of the analyte, which behaves like an enzyme–substrate complex by only re-adsorbing the same type of bio-macromolecule that the sensors were imprinted with (Fig. 2). As the target bio-macromolecule re-adsorbs to the imprinted cavity, the surface potential of the gold-coated sensor decreases and can be measured in real-time potentiometrically.58,59 The re-usability, stability, and storage of this MI biosensor had been previously examined against the detection of carcinoembryonic antigen (CEA). We demonstrated that this MI biosensor was able to provide stable and significant potentiometric responses after a total of 3 detection/wash cycles of CEA molecules in the crystalline lock-and-key complexes and 1 detection/wash cycle after being stored up to 96 hours.58
2.4 Electrochemical measurements
A potentiometer (Lawson Laboratories, Model EMF16) was used to analyze the re-adsorption of the target virus on the MI chips. A 3-electrode system was used (ESI†); 1 Ag/AgCl electrode as the reference electrode, 1 Ag/AgCl electrode as the common ground electrode, and 1 MI chip as the working electrode. The 3 electrodes were all placed in a 10 mL beaker with 8 mL 1× dPBS continuously stirred with a magnetic stirrer and stir bar at 300–500 rpm. A known amount of the analyte was pipetted into the detection system in 5-minute intervals after allowing the system to come to equilibrium (10–20 minutes) while the open circuit potential (OCP) was recorded in real-time using the L-EMF DAQ software. This detection system was also used to measure the OCP response of adsorption of either thiol/DMSO solutions (ESI†) or virus solutions on bare chips and the OCP response of ZIKV adsorption on thiol-only SAM chips.Cyclic voltammetry (CV) and electrochemical impedance spectroscopy (EIS) measurements were performed using a Bio-Logic Science Instruments SP-200 potentiostat with the corresponding EC-Lab V11.10 software. A 3-electrode system was used: 1 Ag/AgCl electrode as the reference electrode, 1 coiled Pt wire auxiliary electrode as the counter electrode, and 1 gold chip (throughout all steps of the MI process) as the working electrode. The 3 electrodes were all placed in the 15 mL electrochemical glass cell vial with 15 mL of a KCl solution (0.1 M) containing [Fe(CN)6]4−/[Fe(CN)6]3− (2 mM each). CV analyses were performed at a scan rate of 100 mV s−1 and EIS analyses were performed with an amplitude of 5 mV and a frequency range of 0.1–100![[thin space (1/6-em)]](https://www.rsc.org/images/entities/char_2009.gif) 000 Hz.
000 Hz.
3 Results and discussion
3.1 Chip surface characterization
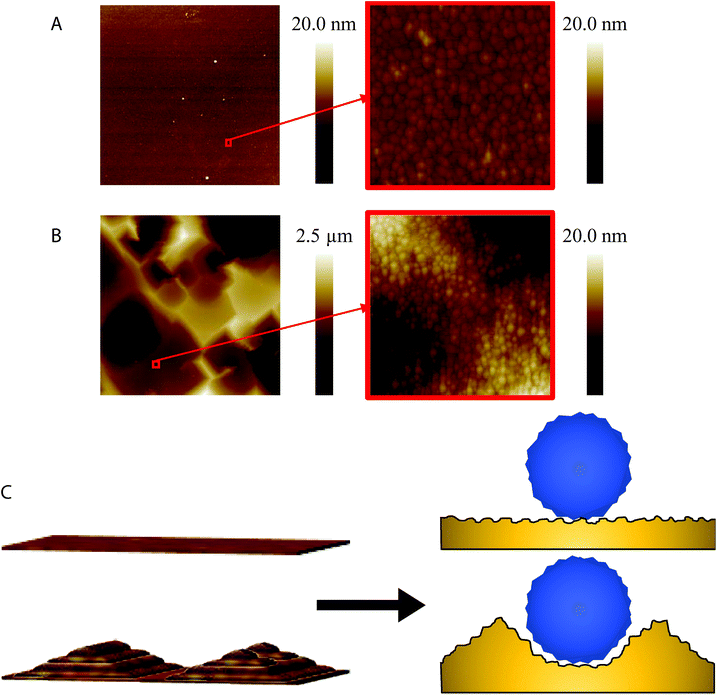
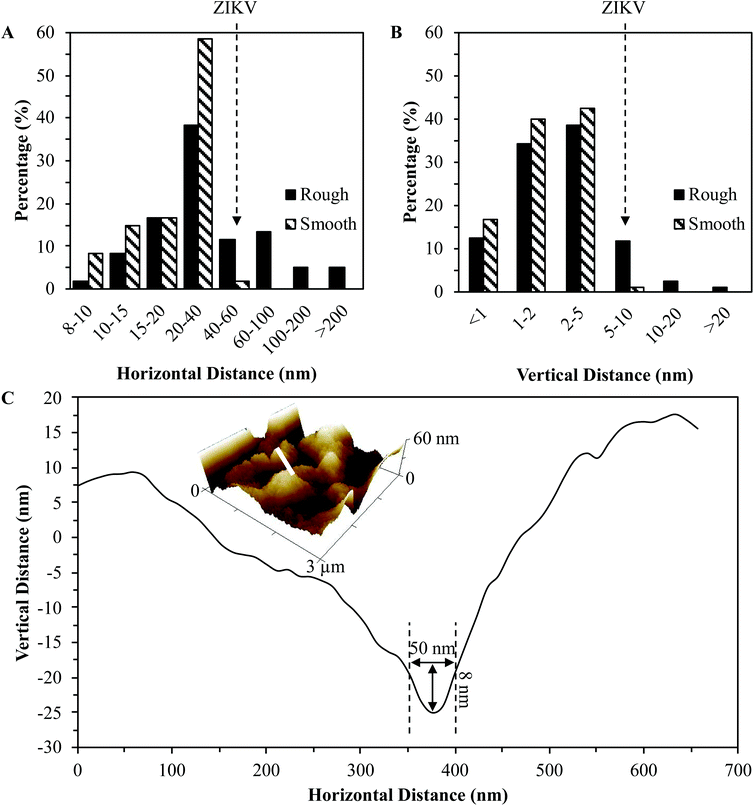
The chip surface topography was characterized via atomic force microscopy (AFM). Fig. 3(A) and (B) display the 2D view of the AFM topographical scans of the bare smooth and rough gold chips. The root mean square roughness (Rq) of the smooth chips was equivalent in the 1 μm2 and 30 μm2 scan sizes at 1.31 ± 0.55 nm. The proposed 3D surface MI model demonstrated the need to match the chip surface roughness with the size of the targeted analyte.59 Knowing that ZIKV virions have a diameter of 49 nm and the alkanethiol SAM ranges from 1 to 3 nm in height,62,65 using chips with an Rq of 1.31 ± 0.55 nm would not be sufficient for this 3D surface MI model. As emphasized in Fig. 3(C), a substrate surface with an Rq of less than 2 nm with a 3 nm tall SAM adsorbed to it would not be able to form a niche surrounding an analyte almost 50 nm in diameter. Chips with a multi-scale roughness can be easily obtained using the natural roughness of silicon wafers. For instance, at 30 μm2 scan sizes the rough chips produced an Rq of 403.83 ± 30.82 nm due to the large facets present on the bare unpolished silicon wafer surface. At 1 μm2 scan sizes the rough chips produced an Rq of 16.40 ± 18.36 nm. This clearly exhibits the multi-scale roughness yielded when fabricating the rough gold chips, in which a 3D surface MI model becomes more accessible for ZIKV.The distributions of both horizontal (peak-to-peak) and vertical (peak-to-valley) length scales for the roughness of the smooth and rough chips are plotted in Fig. 4(A) and (B). Using the Nanoscope Analysis software, random dissection of the 1 μm2 scans of the smooth and rough chips was carried out with a total of 20 dissection processes for 3 chips each. The percentage of horizontal peak-to-peak distances greater than 40 nm was <2% and 35% for the smooth and rough chips, respectively. The percentage of vertical peak-to-valley distances greater than 5 nm was <1% and 15% for the smooth and rough chips, respectively. These values clearly show that the surface roughness of the rough chips is more likely to form niches surrounding ZIKV than the smooth chips while the SAM adsorbs around the virions in a 3D fashion. This is emphasized in Fig. 4(C) which shows a plot of the 2D cross-section of a 3 μm2 scan size of a rough chip. The marked zone on the plot displays a valley on the chip surface that would fit at least 8 nm of the 49 nm diameter ZIKV virion. Although this does not engulf the entire virion, it will be able to form a lock-and-key complex capable of detecting roughly 16% of the repeating surface protrusions of the flaviviruses.
3.2 Background OCP response of analyte adsorption
Before measuring the re-adsorption of ZIKV on a MI chip, it was essential to determine whether or not there would be any background signal in the OCP response. First, the OCP responses from ZIKV and DENV adsorption on bare rough and smooth chips were recorded (Fig. 5). Serial dilutions of ZIKV (2.4 × 10⁻¹ to 5.3 × 10⁶ PFU mL−1) and DENV (0.3 × 10⁻¹ to 2.7 × 10⁴ PFU mL−1) were pipetted into the detection system and individually tested against 3 rough and 3 smooth bare chips. The average –ΔOCP response for all of the conditions fluctuated and did not surpass 4 mV. This minute change in surface charging proves that the alkanethiol SAM is vital for the MI process with potentiometric biosensors. Even if the surface roughness of the gold chips can form niches surrounding the flaviviruses, there is no significant change in the OCP without a lock-and-key complex present. It has been reported that –OH adsorption is weak and lacks electrochemical activity with polycrystalline gold.66 Since the envelope protein of ZIKV and DENV is covered with glycosylated protrusions, these abundant –OH groups among the glycans acted as a barrier preventing the virions from adsorbing to the bare gold chips.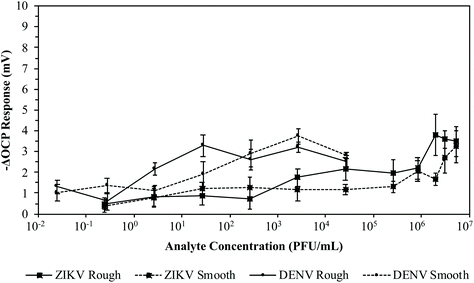 | ||
| Fig. 5 Average potentiometric response of viruses on bare gold surfaces. Serial dilutions of ZIKV and DENV were individually added to the detection system using bare rough and smooth gold chips. | ||
If the lock-and-key complexes of this 3D ZIKV MI detection system depended on the potential hydrogen bonding between the ZIKV virions and the thiol SAM, it was necessary to determine if there was any interaction of the virions with a thiol-only SAM covered chip. If there was a potentiometric response from the ZIKV virions forming hydrogen bonds with the hydroxyl-terminals of the thiols adsorbed on a gold chip without the lock-and-key complexes formed from the MI process, then that would translate to a chip-based detection system with unspecific binding. Therefore, the OCP response from ZIKV adsorption on rough chips with thiol-only SAM was recorded (Fig. 6). Serial dilutions of ZIKV (0.1 × 10⁻¹ to 1.2 × 10⁶ PFU mL−1) were pipetted into the detection system and individually tested against 3 rough chips that were imprinted with a thiol-only SAM. Again, the average –ΔOCP response fluctuated and did not surpass 4 mV. Hydrogen bonding is likely to occur among the ZIKV virions interacting with the thiols adsorbed to a gold chip. However, the adsorbed thiols form SAM crystalline structures that would prevent extensive hydrogen bonding. Only when a targeted analyte re-adsorbs to the lock-and-key complex within the crystalline SAM should there be a large potentiometric response due to extensive macromolecular hydrogen bonding. These results demonstrated that there would be no significant background signals for the ZIKV MI process. If defects and exposed gold are present on the SAM of ZIKV MI chips or if the chips are improperly imprinted, there would be no significant OCP response.
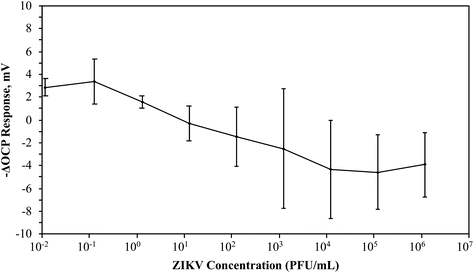 | ||
| Fig. 6 Average potentiometric response of ZIKV on the gold chip with alkanethiol SAM. The OCP response of serial dilutions of ZIKV was measured on a gold chip saturated with an alkanethiol SAM. | ||
3.3 Electrochemical analysis of the ZIKV MI process
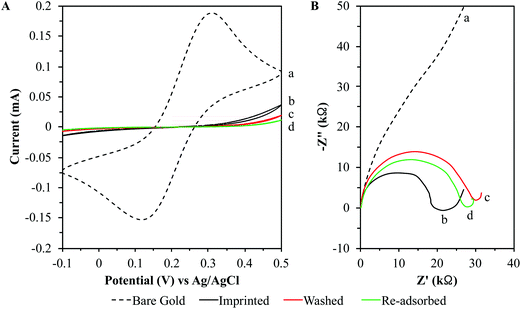
The electrochemical analyses involving CV and EIS have been shown to be extremely useful in monitoring the thiol SAM formation on the gold chips (ESI†). These analyses have previously been used to monitor the MI process for carcinoembryonic antigen (CEA).58 Using these electrochemical analyses to monitor the MI process for ZIKV would verify the success of the 3D MI process for ZIKV detection. Therefore, rough gold chips were imprinted with ZIKV at 104 PFU mL−1 for 2.5 hours. The MI chips were soaked in 3 M NaCl overnight to wash off the imprinted virions and then soaked in DI H2O for 30 minutes. The washed ZIKV MI chips were then reintroduced to ZIKV by pipetting serial dilutions of ZIKV from 1.1 × 10⁻² to 5.5 × 10³ PFU mL−1 into the detection system. This MI process was monitored by CV and EIS throughout all steps: (1) bare gold chips before imprinting, (2) after imprinting chips with ZIKV, (3) after washing imprinted chips, and (4) after chip re-adsorption of ZIKV at 5.5 × 10³ PFU mL−1 (Fig. 7).The results from the CV analysis display that the bare chips allow excellent electron transfer between the gold surface of the chips and the redox active metal ions. After imprinting, these redox peaks disappeared due to the barrier layer of the SAM co-adsorbing with the ZIKV virions resulting in a decreased electron transfer rate. This barrier layer prevented the redox active metal ions from interacting with the gold surface of the chips, thus impeding the reversible redox reaction. It is important to note that the anodic and cathodic peaks did not reappear once the MI chips were washed. This supports the theory that the thiols form a SAM that saturates the gold chip surface completely. Since the bio-macromolecules interact with the hydroxyl-terminated thiols through weak hydrogen bonding and van der Waals interactions, the thiols co-adsorb with the ZIKV on the gold surface. As the surface roughness of the chip forms a niche surrounding the analyte, the SAM adsorbs around the analyte in a 3D fashion. Since the redox peaks did not reappear after washing of the imprinted virions, it is confirmed that the ZIKV virions do not bond directly to the gold surface. If the virions adsorbed directly to the gold surface, there would be exposed gold within the SAM allowing the ferricyanide system to yield redox peaks in the CV scan after washing the adsorbed virions off the chips. These CV analyses support the claims that the ferricyanide system only exhibits a reversible redox reaction when exposed to the gold surface of these chips and this gold surface becomes completely covered by the crystalline SAM lock-and-key complexes following the MI process.
The results from the EIS analysis show that the bare chips yielded a mass diffusion-limited electron transfer process. After imprinting, this linear line converts to a well-defined semi-circle correlating with a largely increased charge transfer resistance (Rct). However, the Rct significantly increased after washing and removing the imprinted ZIKV virions. The Rct decreased after re-adsorption of the ZIKV but was still greater than that of the MI chips prior to washing. These data clearly show that the formation of the SAM on the MI chips drastically increases the resistivity compared to that of bare chips. The change in the Rct from the chips after imprinting with ZIKV, removal of the ZIKV virions, and then re-adsorption of the ZIKV virions undoubtedly supports the molecularly wired admittance mechanism. In that sense the thiol SAM barrier acts as an insulator blocking the current flow and the adsorbed ZIKV virions act as conductive wires that facilitate current flow from the solution through the SAM to contact the gold chip surface. The more the adsorbed ZIKV virions present on the MI chips, the more the wires there are to facilitate the current flow from the solution to chip surface. Therefore, the MI chips became more resistant after removing the imprinted ZIKV virions and the Rct began to decrease as the virions re-adsorbed to the MI chips from increasing conductivity.67
Biological molecules were prone to be exposed to lower voltages than non-biological molecules since the structures of biological molecules are easily denatured.67 In the CV analyses, a scan rate of 100 mV s−1 was used to monitor the interaction of the redox active metal ions with the amount of gold surface exposed on the chips. This clarified how the crystalline SAM lock-and-key complexes form on the MI chips. In the EIS analyses, a lower load of 5 mV was applied at various frequencies to showcase how the co-adsorbed ZIKV virions follow the molecularly wired admittance mechanism,67 thereby demonstrating that as the ZIKV virions re-adsorbed to the MI chips, the resistivity of the chips decreased as well.
3.4 LOD of ZIKV MI chips
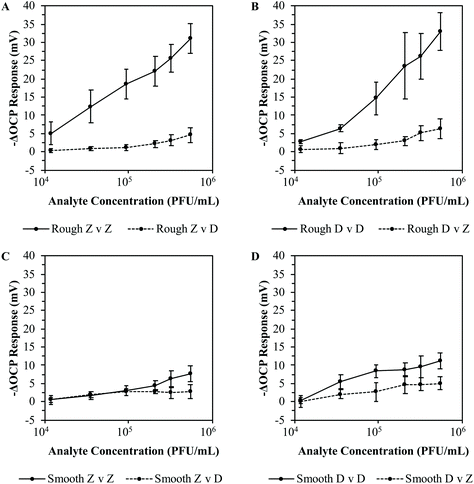
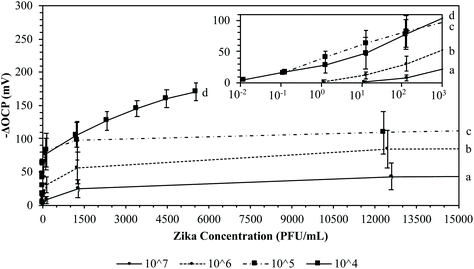
In order to claim to be a successful potentiometric biosensor for the detection of ZIKV infection, the MI chip must be highly sensitive and specific to ZIKV re-adsorption. Rough and smooth gold chips were imprinted with either ZIKV or DENV at 106 PFU mL−1 for 2.5 hours and soaked in 3 M NaCl overnight to wash off the imprinted virions. The washed MI chips were then reintroduced to the targeted virus by pipetting serial dilutions of either ZIKV or DENV from 1.2 × 10⁴ to 5.5 × 10⁵ PFU mL−1 into the detection system for a total of 3 times each for both the rough and smooth surfaces. Additional washed MI chips were cross-tested by pipetting serial dilutions of the opposite virus from 1.2 × 10⁴ to 5.5 × 10⁵ PFU mL−1 into the detection system for a total of 3 times each for both the rough and smooth surfaces. The average –ΔOCP responses for these MI chips are plotted in Fig. 8. When the ZIKV MI chips were reintroduced to ZIKV at 5.5 × 10⁵ PFU mL−1, the rough and smooth chips yielded average –ΔOCP responses of 31.05 ± 3.97 mV and 7.68 ± 2.24 mV, respectively. For cross-testing the ZIKV MI chips with DENV at 5.5 × 10⁵ PFU mL−1, the rough and smooth chips yielded average –ΔOCP responses of 4.60 ± 2.08 mV and 2.83 ± 1.88 mV, respectively. Similarly, reintroducing the DENV MI rough and smooth chips to DENV at 5.5 × 10⁵ PFU mL−1 yielded average –ΔOCP responses of 32.95 ± 5.05 mV and 11.21 ± 2.21 mV, respectively. For cross-testing the DENV MI chips with ZIKV at 5.5 × 10⁵ PFU mL−1, the rough and smooth chips yielded average –ΔOCP responses of 6.30 ± 2.78 mV and 5.07 ± 1.74 mV, respectively. When cross-testing either the ZIKV or DENV MI rough chips, the average –ΔOCP responses were more than 5-fold lower than that of the average –ΔOCP responses from targeted virus re-adsorption. These results clearly exhibit that this MI process can be a successful POC diagnostic for flaviviruses. These MI rough chips exhibited high selectivity when imprinted with either ZIKV or DENV by being able to distinguish flaviviruses of similar size when introduced to viral loads equal to or greater than clinical values.42,68 On the other hand, the average –ΔOCP of the MI smooth chips against the target virus was about 3-fold lower than that of the MI rough chips. Also, cross-testing either the ZIKV or DENV MI smooth chips yielded average –ΔOCP responses that were about 3-fold lower than that of the average –ΔOCP responses from targeted virus re-adsorption. This difference in average –ΔOCP responses regarding the roughness of the MI chip surface supports the 3D MI model for ZIKV. Since the rough gold chips have a greater Rq and have the ability to form niches surrounding the ZIKV or DENV during the MI process, they are able to produce larger voltage responses than the MI smooth chips when re-adsorbing the targeted virus. Since the envelope proteins of ZIKV and DENV differ in glycosylated amino acid sites, they have different structures from the glycans protruding on the surface even though the virions may have similar dimensions. By demonstrating high selectivity after cross-testing the ZIKV and DENV MI chips, the potential of the 3D MI model is greatly enhanced with the ability to form crystalline lock-and-key complexes specific to the conformation of amino acids on the surface protein of flaviviruses. Unfortunately, imprinting at too high a concentration may lead to lock-and-key complexes of multiple virions instead of a single virion.Following the optimization of the thiol concentration needed and the washing technique for the ZIKV MI process (ESI†), the concentration of ZIKV needed to imprint the chips became the primary focus. Calculating the LOD for the ZIKV MI process can determine how competitive this technique is against rRT-PCR or the aforementioned POC diagnostic systems. Rough gold chips were imprinted with ZIKV at 10-fold serial dilutions ranging from 104 to 107 PFU mL−1 for 2.5 hours. A total of 4 chips were imprinted for each concentration. The MI chips were soaked in 3 M NaCl overnight to wash off the imprinted virions and then soaked in DI H2O for 30 minutes. The washed ZIKV MI chips were then reintroduced to ZIKV by pipetting serial dilutions of ZIKV from 0.1 × 10⁻¹ to 5.5 × 10⁶ PFU mL−1 into the detection system. The average –ΔOCP responses for these MI chips are plotted in Fig. 9. When the ZIKV MI chips were reintroduced to ZIKV at 105 PFU mL−1, the MI chips yielded average –ΔOCP responses of 67.49 ± 20.26 mV and 104.44 ± 26.45 mV when imprinted at 107 PFU mL−1 and 106 PFU mL−1, respectively. When the ZIKV MI chips were reintroduced to ZIKV at 103 PFU mL−1, the MI chips yielded average –ΔOCP responses of 24.32 ± 13.40 mV, 55.94 ± 23.80 mV, 97.51 ± 29.08, and 105.77 ± 18.92 mV when imprinted at 107 PFU mL−1, 106 PFU mL−1, 105 PFU mL−1, and 104 PFU mL−1, respectively. When the ZIKV MI chips were reintroduced to ZIKV at 101 PFU mL−1, the MI chips yielded average –ΔOCP responses of 0.86 ± 1.71 mV, 12.09 ± 4.99 mV, 63.94 ± 19.48, and 47.70 ± 25.16 mV when imprinted at 107 PFU mL−1, 106 PFU mL−1, 105 PFU mL−1, and 104 PFU mL−1, respectively. These results clearly show that there is a Gaussian distribution for the concentration of ZIKV used in the MI process. This supports the previously made claim that imprinting at a very high concentration can lead to lock-and-key complexes of multiple virions aggregated together instead of creating an imprint cavity specific to a single virion. As the ZIKV imprinting concentration decreased, the LOD decreased for the ZIKV MI chips. Having a lower LOD improves the ability of the MI chips to detect ZIKV from samples at lower levels. When the ZIKV MI chips were reintroduced to ZIKV at 10−1 PFU mL−1, the MI chips yielded average –ΔOCP responses of 15.55 ± 1.36 mV and 16.61 ± 3.10 mV when imprinted at 105 PFU mL−1 and104 PFU mL−1, respectively. With the ability to detect ZIKV as low as 10−1 PFU mL−1, the MI system became competitive with rRT-PCR and LAMP-based POC diagnostic systems.36,45,50–52
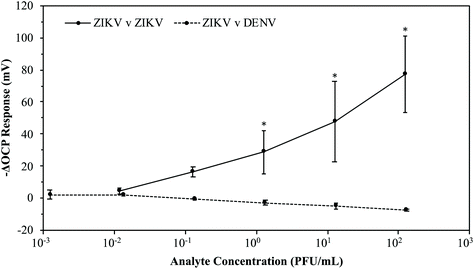
With a fully optimized ZIKV MI chip process, the next step was to determine the ability of these chips to distinguish virions of ZIKV from DENV. 8 rough gold chips were imprinted with ZIKV at 104 PFU mL−1 for 2.5 hours. The MI chips were soaked in 3 M NaCl overnight to wash off the imprinted virions and then soaked in DI H2O for 30 minutes. 4 of the washed ZIKV MI chips were then reintroduced to ZIKV by pipetting serial dilutions of ZIKV from 1.1 × 10⁻² to 1.2 × 10² PFU mL−1 into the detection system. The remaining 4 washed ZIKV MI chips were cross-tested with DENV by pipetting serial dilutions of DENV from 1.2 × 10⁻³ to 1.3 × 10² PFU mL−1 into the detection system. The average –ΔOCP responses for these MI chips are plotted in Fig. 10. When the ZIKV MI chips were reintroduced to ZIKV at 1.2 × 10² PFU mL−1, the MI chips yielded an average –ΔOCP response of 77.28 ± 23.98 mV. When the ZIKV MI chips were introduced to DENV at 1.3 × 10² PFU mL−1, the MI chips yielded an average –ΔOCP response of −7.15 ± 0.69 mV. These results verify that the 3D ZIKV MI detection system has the capability to detect ZIKV from samples at low viral loads (LOD < 10−1 PFU mL−1) while differentiating ZIKV virions from those of other flaviviruses.
3.5 Potential POC ZIKV diagnostic
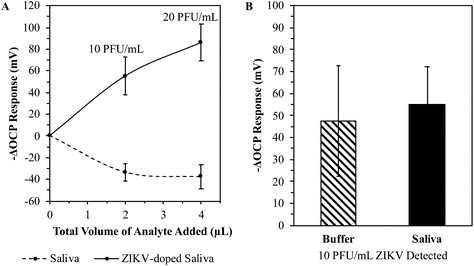
The correct recipe of thiol to ZIKV concentrations and the washing technique have all been determined for this 3D MI process. However, the aforementioned data are obtained from testing the ZIKV MI chips against purified ZIKV in a buffered solution. In order to verify if this method has the potential to become a POC ZIKV diagnostic, it was tested with samples similar to what could be tested in the field. Since saliva yields relatively high viral loads of ZIKV and is a noninvasive body fluid to test, saliva samples were chosen to test against the ZIKV MI chips.35–41 The chips were still imprinted with ZIKV diluted in the 1× dPBS buffer. It was essential to imprint the chips with a purified bio-macromolecule in order to guarantee that the imprinted cavities or lock-and-key complexes were true to the targeted analyte. If the MI chips were imprinted with ZIKV from a heterogenous solution, it would be extremely difficult to determine what is co-adsorbing on the gold surface within the thiol SAM. Thus, any potentiometric response from re-adsorption on MI chips imprinted with ZIKV from heterogenous solutions would yield uninterpretable data since it would be impossible to determine what exactly is re-adsorbed if the target of the imprinted cavities is unknown. However, imprinting chips with a purified target should provide the ability to detect target analytes even from heterogenous solutions based on the lock-and-key complex mechanism of this 3D MI process.Human saliva is known to contain huge amounts of electrolytes, enzymes, proteins, bacteria, and cells.69 Therefore, saliva was the perfect tool to test how accurate the proposed lock-and-key complexes of the 3D MI process were in distinguishing the targeted analyte within a pool of mixed bio-macromolecules. 6 rough chips were imprinted with ZIKV at 104 PFU mL−1 for 2.5 hours. The MI chips were soaked in 3 M NaCl overnight to wash off the imprinted virions and then soaked in DI H2O for 30 minutes. Human saliva was collected from a single volunteer, with no known history of ZIKV infection through an IRB-approved protocol. The collected saliva was kept in its natural state in order to test the precision of the lock-and-key complexes on the MI chips. 3 of the washed ZIKV MI chips were introduced to pure saliva by pipetting aliquots of saliva into the detection system. In order to test the selectivity of this 3D MI detection system, the collected saliva was doped with ZIKV with a final concentration of 4 × 10⁴ PFU mL−1 to match a clinical viral load of ZIKV in saliva.35 The remaining washed ZIKV MI chips were then reintroduced to ZIKV by pipetting aliquots of the 4 × 10⁴ PFU mL−1 ZIKV-doped saliva into the detection system. The average potentiometric responses of the ZIKV MI chips tested against saliva and ZIKV-doped saliva are plotted in Fig. 11(A). When the ZIKV MI chips were introduced to the analytes at a total volume of 2 μL added into the detection system after providing 20 minutes for the detection system to equilibrate, the MI chips yielded an average –ΔOCP response of −33.18 ± 8.02 mV and 55.09 ± 17.35 mV from pure saliva and ZIKV-doped saliva, respectively, after 5 additional minutes of assay time. After adding a total volume of 4 μL of the analytes into the detection system, the MI chips yielded an average –ΔOCP response of −37.28 ± 11.13 mV and 85.93 ± 16.87 mV from pure saliva and ZIKV-doped saliva, respectively, after another additional 5 minutes of assay time. The real-time potentiometric testing of pure saliva and ZIKV-doped saliva against the ZIKV MI chips is displayed in the ESI.†
When a target analyte re-adsorbs to a MI chip, the surface of the MI chip becomes more negative in potential due to the increase in electrical conductivity at the MI chip surface. This was supported by the EIS data when the adsorbed ZIKV virions behaved like molecular wires.67 After the first 2 μL aliquot of saliva was pipetted into the detection system, there was an increase in the OCP greater than 30 mV. As mentioned before, saliva contains a large number of bio-macromolecules which are all charged species. Therefore, ions are added into the medium of the detection system thereby increasing the electrical conductivity of the medium. After the first 2 μL aliquot of ZIKV-doped saliva was pipetted into the detection system, there was a decrease in the OCP greater than 55 mV. Here, ions are added to the working electrode thereby increasing the electrical conductivity of the MI chip. The OCP is the measurement of the surface potential difference between the working electrode and the medium, which are inversely proportional to each other. Thus, the determination of when a target analyte re-adsorbs to the MI chip becomes easy.
A practical POC ZIKV diagnostic would require a minimal sample size which is then rapidly screened to provide a diagnosis on infection in real-time. These results clearly demonstrate that the proposed lock-and-key complexes of the 3D ZIKV MI process are accurate and precise in distinguishing the targeted analyte in a pool of mixed bio-macromolecules at small volumes. The 2 μL aliquots of the ZIKV-doped saliva added into the detection system equated to 10 PFU mL−1 of ZIKV, which is well within the LOD of the ZIKV MI process testing purified ZIKV in a buffered solution (<10−1 PFU mL−1). Fig. 11(B) demonstrates the ability of the ZIKV MI chip to be calibrated to determine the viral load of a tested sample. At a detection level of 10 PFU mL−1 ZIKV, the 55.09 ± 17.35 mV OCP response from testing ZIKV-doped saliva falls within the 47.70 ± 25.16 mV OCP response from ZIKV re-adsorption in buffer. This verifies that the potentiometric response is true to the re-adsorption of the targeted analyte, even when mixed in a pool of other bio-macromolecules. Therefore, the ZIKV MI detection system has proven its potential to become a POC ZIKV diagnostic system.
4 Conclusion
After optimizing the fabrication of these potentiometric sensors, the 3D ZIKV MI process has demonstrated that it is capable of distinguishing viruses of similar size with high sensitivity and it has the potential to become a POC ZIKV diagnostic system. Electrochemical analyses supported the 3D model of the substrate surface morphology forming niches surrounding the analyte while the SAM adsorbs around the analyte in all directions. The strong sulfur–gold covalent bonds allow the thiol SAM to remain intact as the adsorbed ZIKV virions are easily removed from their weak hydrogen bonds and van der Waals interactions with the hydroxyl-terminals of the thiols. The washed 3D ZIKV MI chips yielded lock-and-key complexes highly specific and highly sensitive to ZIKV. The MI chips exhibited the ability to distinguish ZIKV against DENV in buffered solutions and were able to effectively detect ZIKV among a pool of bio-macromolecules in human saliva. Testing against ZIKV in buffered solution revealed a LOD of less than 10−1 PFU mL−1 for the ZIKV MI chips, correlating with a sample with a concentration of 100 PFU mL−1 ZIKV after taking the dilution factor into account. This LOD matches those of rRT-PCR and LAMP-based POC diagnostics but can be accomplished in a fraction of time without any sample manipulation or elaborate recipe. Testing against ZIKV-doped saliva demonstrated the ability to detect ZIKV at 10 PFU mL−1 mixed within a pool of different bio-macromolecules normally present in human saliva, corresponding to a sample with a normal clinical viral load of 4 × 10⁴ PFU mL−1 ZIKV after taking the dilution factor into account. Samples can be collected and then directly added to the 3D ZIKV MI detection system yielding a potentiometric response immediately. The large potentiometric responses are due to extensive macromolecular hydrogen bonding and van der Waals interactions between the re-adsorbed ZIKV virions and the thiol SAM within the imprinted cavities, or lock-and-key complexes. The conformation of the flavivirus glycosylation sites has proven to dictate the formation of the crystalline SAM complexes. This detection system gives rise to the potential for rapid noninvasive screening of persons who may have been infected with ZIKV. Currently, the 3D ZIKV MI detection system needs 10–20 minutes to equilibrate the OCP response before adding any sample to it. This time is needed since the volume of the buffer used in the detection system is 8 mL and must be continuously stirred to ensure that an added sample size of 2–100 μL is adequately mixed in the buffer to be properly detected and analyzed. Stirring a solution while measuring the OCP gives rise to a longer time needed to equilibrate since the ions in the medium are moving at a fast pace. If the detection system is brought down to the micro-scale, the buffer would not have to be stirred while adding the sample thereby drastically reducing the time needed for the OCP response to equilibrate before testing samples. The potentiometer itself can be simplified by being interfaced with a smart device that can be programmed to digitally display real-time readings. Doing so would allow this 3D ZIKV MI detection system to become portable to be used in remote locations with little technical expertise. Therefore, this system clearly has the potential to become a POC ZIKV diagnostic test after miniaturizing the entire detection system and making the system portable.Conflicts of interest
There are no conflicts to declare.Acknowledgements
We gratefully acknowledge the support of the National Science Foundation (NSF grant INSPIRE#1344267). This work was performed in part at the Advanced Science Research Center NanoFabrication Facility of the Graduate Center at the City University of New York. We would also like to acknowledge the Advanced Energy Research and Technology Center for access to the ThINC facility at Stony Brook University.References
- C. F. J. Ayres, Lancet Infect. Dis., 2016, 16, 278–279 CrossRef PubMed.
- L. Zammarchi, D. Tappe, C. Fortuna, M. E. Remoli, S. Günther, G. Venturi, A. Bartoloni and J. Schmidt-Chanasit, Eurosurveillance, 2015, 20, 21153 Search PubMed.
- G. W. A. Dick, S. F. Kitchen and A. J. Haddow, Trans. R. Soc. Trop. Med. Hyg., 1952, 46, 509–520 CrossRef CAS PubMed.
- F. N. MacNamara, Trans. R. Soc. Trop. Med. Hyg., 1954, 48, 139–145 CrossRef CAS PubMed.
- M. R. Duffy, T.-H. Chen, W. T. Hancock, A. M. Powers, J. L. Kool, R. S. Lanciotti, M. Pretrick, M. Marfel, S. Holzbauer, C. Dubray, L. Guillaumot, A. Griggs, M. Bel, A. J. Lambert, J. Laven, O. Kosoy, A. Panella, B. J. Biggerstaff, M. Fischer and E. B. Hayes, N. Engl. J. Med., 2009, 360, 2536–2543 CrossRef CAS PubMed.
- V.-M. Cao-Lormeau, C. Roche, A. Teissier, E. Robin, A.-L. Berry, H.-P. Mallet, A. A. Sall and D. Musso, Emerg. Infect. Dis., 2014, 20, 1085–1086 Search PubMed.
- H. M. Lazear and M. S. Diamond, J. Virol., 2016, 90, 4864–4875 CrossRef CAS PubMed.
- G. Kuno, G.-J. J. Chang, K. R. Tsuchiya, N. Karabatsos and C. B. Cropp, J. Virol., 1998, 72, 73–83 CAS.
- M. I. Li, P. S. J. Wong, L. C. Ng and C. H. Tan, PLoS Negl. Trop. Dis., 2012, 6, e1792 CrossRef PubMed.
- P.-S. J. Wong, M.-z. I. Li, C.-S. Chong, L.-C. Ng and C.-H. Tan, PLoS Negl. Trop. Dis., 2013, 7, e2348 CrossRef PubMed.
- L. R. Petersen, D. J. Jamieson, A. M. Powers and M. A. Honein, N. Engl. J. Med., 2016, 374, 1552–1563 CrossRef CAS PubMed.
- M. Besnard, S. Lastère, A. Teissier, V. M. Cao-Lormeau and D. Musso, Eurosurveillance, 2014, 19, 20751 Search PubMed.
- A. Sharma and S. K. Lal, Front. Microbiol., 2017, 8 Search PubMed.
- B. D. Foy, K. C. Kobylinski, J. L. C. Foy, B. J. Blitvich, A. T. d. Rosa, A. D. Haddow, R. S. Lanciotti and R. B. Tesh, Emerg. Infect. Dis., 2011, 17, 880–882 CrossRef PubMed.
- S. L. Hills, K. Russell, M. Hennessey, C. Williams, A. M. Oster, M. Fischer and P. Mead, Morbidity and Mortality Weekly Report, 2016, vol. 65, pp. 215–216 Search PubMed.
- K. Russell, S. L. Hills, A. M. Oster, C. C. Porse, G. Danyluk, M. Cone, R. Brooks, S. Scotland, E. Schiffman, C. Fredette, J. L. White, K. Ellingson, A. Hubbard, A. Cohn, M. Fischer, P. Mead, A. M. Powers and J. T. Brooks, Clin. Infect. Dis., 2017, 64, 211–213 CrossRef PubMed.
- A. Davidson, S. Slavinski, K. Komoto, J. Rakeman and D. Weiss, Morbidity and Mortality Weekly Report, 2016, vol. 65, pp. 716–717 Search PubMed.
- L. Schnirring, Brazil confirms blood-transfusion Zika; PAHO calls for global support, http://www.cidrap.umn.edu/news-perspective/2016/02/brazil-confirms-blood-transfusion-zika-paho-calls-global-support, (accessed May 29, 2018).
- S. Swaminathan, R. Schlaberg, J. Lewis, K. E. Hanson and M. R. Couturier, N. Engl. J. Med., 2016, 375, 1907–1909 CrossRef PubMed.
- G. Marano, S. Pupella, S. Vaglio, G. M. Liumbruno and G. Grazzini, Blood Transfus., 2016, 14, 95–100 Search PubMed.
- A. Shah and A. Kumar, Neurotox. Res., 2016, 30, 131–134 CrossRef PubMed.
- R. Buathong, L. Hermann, B. Thaisomboonsuk, W. Rutvisuttinunt, C. Klungthong, P. Chinnawirotpisan, W. Manasatienkij, A. Nisalak, S. Fernandez, I.-K. Yoon, P. Akrasewi and T. Plipat, Am. J. Trop. Med. Hyg., 2015, 93, 380–383 CrossRef PubMed.
- M. Basarab, C. Bowman, E. J. Aarons and I. Cropley, Br. Med. J., 2016, 352 Search PubMed.
- V. Sikka, V. Chattu, R. Popli, S. Galwankar, D. Kelkar, S. Sawicki, S. Stawicki and T. Papadimos, J. Global Infect. Dis., 2016, 8, 3–15 CrossRef PubMed.
- K. Korzeniewski, D. Juszczak and E. Zwolińska, Zika—another threat on the epidemiological map of the world, 2016, vol. 67, pp. 31–37 Search PubMed.
- J. Mlakar, M. Korva, N. Tul, M. Popović, M. Poljšak-Prijatelj, J. Mraz, M. Kolenc, K. Resman Rus, T. Vesnaver Vipotnik, V. Fabjan Vodušek, A. Vizjak, J. Pižem, M. Petrovec and T. Avšič Županc, N. Engl. J. Med., 2016, 374, 951–958 CrossRef CAS PubMed.
- V. M. Cao-Lormeau, A. Blake, S. Mons, S. Lastere, C. Roche, J. Vanhomwegen, T. Dub, L. Baudouin, A. Teissier, P. Larre, A. L. Vial, C. Decam, V. Choumet, S. K. Halstead, H. J. Willison, L. Musset, J. C. Manuguerra, P. Despres, E. Fournier, H. P. Mallet, D. Musso, A. Fontanet, J. Neil and F. Ghawché, Lancet, 2016, 387, 1531–1539 CrossRef CAS.
- WHO, WHO statement on the first meeting of the International Health Regulations (2005) (IHR 2005) Emergency Committee on Zika virus and observed increase in neurological disorders and neonatal malformations, http://www.who.int/en/news-room/detail/01–02–2016-who-statement-on-the-first-meeting-of-the-international-health-regulations-(2005)-(ihr-2005)-emergency-committee-on-zika-virus-and-observed-increase-in-neurological-disorders-and-neonatal-malformations, (accessed May 29, 2018).
- CDC, Facts about Microcephaly, https://www.cdc.gov/ncbddd/birthdefects/microcephaly.html, (accessed May 31, 2018).
- CDC, Zika and Guillain-Barré Syndrome, https://www.cdc.gov/zika/healtheffects/gbs-qa.html, (accessed May 31, 2018).
- PAHO, Zika cases and congenital syndrome associated with Zika virus reported by countries and territories in the Americas, 2015–2018 Cumulative cases, https://www.paho.org/hq/index.php?option=com_docman&task=doc_view&Itemid=270&gid=43297&lang=en, (accessed May 29, 2018).
- WHO, WHO to fast-track availability of diagnostics for Zika virus, http://www.who.int/medicines/news/fast_track_diagnostics_zika/en/, (accessed May 29, 2018).
- PAHO, Regional Zika Epidemiological Update (Americas), August 25, 2017 Search PubMed, https://www.paho.org/hq/index.php?option=com_content&view=article&id=11599%3Aregional-zika-epidemiological-update-americas&catid=8424%3Acontents&Itemid=41691&lang=en, (accessed May 29, 2018).
- CDC, Cumulative Zika Virus Disease Case Counts in the United States, 2015–2018, https://www.cdc.gov/zika/reporting/case-counts.html, (accessed May 29, 2018).
- L. Barzon, M. Pacenti, A. Berto, A. Sinigaglia, E. Franchin, E. Lavezzo, P. Brugnaro and G. Palù, Eurosurveillance, 2016, 21 Search PubMed.
- R. S. Lanciotti, O. L. Kosoy, J. J. Laven, J. O. Velez, A. J. Lambert, A. J. Johnson, S. M. Stanfield and M. R. Duffy, Emerg. Infect. Dis., 2008, 14, 1232–1239 CrossRef CAS PubMed.
- A.-C. Gourinat, O. O'Connor, E. Calvez, C. Goarant and M. Dupont-Rouzeyrol, Emerg. Infect. Dis., 2015, 21, 84–86 CrossRef CAS PubMed.
- E. Nicastri, C. Castilletti, G. Liuzzi, M. Iannetta, M. R. Capobianchi and G. Ippolito, Eurosurveillance, 2016, 21, 30314 CrossRef PubMed.
- M. Didier, R. Claudine, R. Emilie, N. Tuxuan, T. Anita and C.-L. Van-Mai, Emerg. Infect. Dis. J., 2015, 21, 359 CrossRef PubMed.
- A. M. Bingham, M. Cone, V. Mock, L. Heberlein-Larson, D. Stanek, C. Blackmore and A. Likos, Morbidity and Mortality Weekly Report, 2016, p. 65 Search PubMed.
- B. Atkinson, P. Hearn, B. Afrough, S. Lumley, D. Carter, E. J. Aarons, A. J. Simpson, T. J. Brooks and R. Hewson, Emerg. Infect. Dis. J., 2016, 22, 940 CrossRef CAS PubMed.
- O. Faye, O. Faye, A. Dupressoir, M. Weidmann, M. Ndiaye and A. Alpha Sall, J. Clin. Virol., 2008, 43, 96–101 CrossRef CAS PubMed.
- FDA, Zika Virus EUA Information, https://www.fda.gov/EmergencyPreparedness/Counterterrorism/MedicalCountermeasures/MCMLegalRegulatoryandPolicyFramework/ucm182568.htm#zika, (accessed May 29, 2018).
- I. B. Rabe, J. E. Staples, J. Villanueva, K. B. Hummel, J. A. Johnson, L. Rose, S. Hills, A. Wasley, M. Fischer and A. M. Powers, Morbidity and Mortality Weekly Report, 2016, p. 65 Search PubMed.
- O. Faye, O. Faye, D. Diallo, M. Diallo, M. Weidmann and A. A. Sall, Virol. J., 2013, 10, 311 CrossRef PubMed.
- Q. Jiang, J. Chandar Yatin, S. Cao, D. Kharasch Evan, S. Singamaneni and J. Morrissey Jeremiah, Adv. Biosyst., 2017, 1, 1700096 CrossRef.
- F. Bedin, L. Boulet, E. Voilin, G. Theillet, A. Rubens and C. Rozand, J. Med. Virol., 2017, 89, 1520–1527 CrossRef CAS PubMed.
- M. Séverine, B. Rachida, L. Bhety, E. Valérie, B. Laetitia, K. Mirdad and R. Dominique, Emerg. Infect. Dis. J., 2016, 22, 1691 CrossRef PubMed.
- K. Pardee, A. A. Green, M. K. Takahashi, D. Braff, G. Lambert, J. W. Lee, T. Ferrante, D. Ma, N. Donghia, M. Fan, N. M. Daringer, I. Bosch, D. M. Dudley, D. H. O'Connor, L. Gehrke and J. J. Collins, Cell, 2016, 165, 1255–1266 CrossRef CAS PubMed.
- B. Tian, Z. Qiu, J. Ma, T. Z. G. de la Torre, C. Johansson, P. Svedlindh and M. Strömberg, Biosens. Bioelectron., 2016, 86, 420–425 CrossRef CAS PubMed.
- J. Song, M. G. Mauk, B. A. Hackett, S. Cherry, H. H. Bau and C. Liu, Anal. Chem., 2016, 88, 7289–7294 CrossRef CAS PubMed.
- Y. Kurosaki, D. B. G. Martins, M. Kimura, A. D. S. Catena, M. A. C. S. M. Borba, S. D. S. Mattos, H. Abe, R. Yoshikawa, J. L. D. L. Filho and J. Yasuda, Sci. Rep., 2017, 7, 13503 CrossRef PubMed.
- Y. Wang, Y. Zhou, J. Sokolov, B. Rigas, K. Levon and M. Rafailovich, Biosens. Bioelectron., 2008, 24, 162–166 CrossRef CAS PubMed.
- Y. Wang, Z. Zhang, V. Jain, J. Yi, S. Mueller, J. Sokolov, Z. Liu, K. Levon, B. Rigas and M. H. Rafailovich, Sens. Actuators, B, 2010, 146, 381–387 CrossRef CAS.
- A. Mathur, S. Blais, C. M. V. Goparaju, T. Neubert, H. Pass and K. Levon, PLoS One, 2013, 8, e57681 CrossRef CAS PubMed.
- Q. Zhang, A. Prabhu, A. San, J. F. Al-Sharab and K. Levon, Biosens. Bioelectron., 2015, 72, 100–106 CrossRef CAS PubMed.
- M. Kaisti, Q. Zhang, A. Prabhu, A. Lehmusvuori, A. Rahman and K. Levon, IEEE Trans. Electron Devices, 2015, 62, 2628–2635 Search PubMed.
- Y. Yu, Q. Zhang, J. Buscaglia, C.-C. Chang, Y. Liu, Z. Yang, Y. Guo, Y. Wang, K. Levon and M. Rafailovich, Analyst, 2016, 141, 4424–4431 RSC.
- Y. Yu, Q. Zhang, C.-C. Chang, Y. Liu, Z. Yang, Y. Guo, Y. Wang, D. K. Galanakis, K. Levon and M. Rafailovich, Analyst, 2016, 141, 5607–5617 RSC.
- Y. Wang, Y. Yu, J. Sokolov, K. Levon and M. Rafailovich, Curr. Trends Polym. Sci., 2018, 18, 1–14 CrossRef.
- Y. Zhou, B. Yu and K. Levon, Chem. Mater., 2003, 15, 2774–2779 CrossRef CAS.
- J. C. Love, L. A. Estroff, J. K. Kriebel, R. G. Nuzzo and G. M. Whitesides, Chem. Rev., 2005, 105, 1103–1170 CrossRef CAS PubMed.
- W. Zhang, P. R. Chipman, J. Corver, P. R. Johnson, Y. Zhang, S. Mukhopadhyay, T. S. Baker, J. H. Strauss, M. G. Rossmann and R. J. Kuhn, Nature Struct. Biol., 2003, 10, 907–912 CrossRef CAS PubMed.
- ViralZone, Flavivirus, https://viralzone.expasy.org/24?outline=all_by_species, (accessed May 31, 2018).
- D. Sirohi, Z. Chen, L. Sun, T. Klose, T. C. Pierson, M. G. Rossmann and R. J. Kuhn, Science, 2016, 352, 467 CrossRef CAS PubMed.
- L. Y. Chen, X. Y. Lang, T. Fujita and M. W. Chen, Scr. Mater., 2011, 65, 17–20 CrossRef CAS.
- E. P. Randviir and C. E. Banks, Anal. Methods, 2013, 5, 1098–1115 RSC.
- S. I. de la Cruz-Hernández, H. Flores-Aguilar, S. González-Mateos, I. López-Martinez, C. Alpuche-Aranda, J. E. Ludert and R. M. del Angel, Am. J. Trop. Med. Hyg., 2013, 88, 446–454 CrossRef PubMed.
- M. Tiwari, J. Nat. Sci., Biol. Med., 2011, 2, 53–58 CrossRef PubMed.
Footnote |
| † Electronic supplementary information (ESI) available. See DOI: 10.1039/c9an00580c |
| This journal is © The Royal Society of Chemistry 2019 |

