Tin oxide nanoparticles modified by copper as novel catalysts for the luminol–H2O2 based chemiluminescence system†
Christina
Vakh
 *,
Aleksei
Pochivalov
,
Anastasiia
Podurets
,
Natalia
Bobrysheva
,
Olga
Osmolovskaya
and
Andrey
Bulatov
Institute of Chemistry, Saint-Petersburg University, St.Petersburg State University, SPbSU, SPbU, 7/9 Universitetskayanab., St. Petersburg, 199034 Russia. E-mail: k.vakh@spbu.ru; kristina-fulmes@mail.ru
First published on 7th November 2018
Abstract
In this study, SnO2 nanoparticles modified by copper were found to greatly enhance the chemiluminescence intensity of the luminol–H2O2 system for the first time. The developed approach was applied for the determination of H2O2 as a proof-of-concept example.
Nanotechnology has received great attention in all areas of chemistry. Chemiluminescence (CL) is not an exception. Usually, nanoparticles (NPs) are used in CL reactions as catalysts, reductants or luminophores for the determination of target analytes in different samples or for sample screening.1 Application of NPs in CL can be considered as a novel contribution to the evolution of CL analysis aiming to improve the sensitivity and expand the scope of its applications. Most frequently, owing to their unique redox catalytic properties, metal-based NPs (metal oxide nanoparticles) are used as catalysts in liquid-phase reactions for amplified CL emission.2 Thus, different NPs, such as Fe2O3,3 ZnO,4 Co3O4,5 CoFe2O4,6 and CuO,7 as well as metal–organic frameworks,8,9 have been applied to CL reactions.
In this study, we established that tin oxide (SnO2) NPs modified by copper can greatly enhance the CL intensity of the luminol–H2O2 system. Obviously, this feature can open up new opportunities for CL analysis because the luminol–H2O2 system is widely used for the sensitive determination of various analytes.10 To the best of our knowledge, this phenomenon has not been presented in the literature. To demonstrate the efficiency of the suggested approach, the strategy was applied to determine H2O2 as a proof-of-concept analyte in cosmetic products using an automated CL system.
Usually, in CL reactions H2O2 takes part as an oxidant, which decomposes to reactive oxygen species. Fenton or Fenton-like reactions, as the most popular H2O2 related systems, have gained considerable attention.11 The luminol–H2O2 system can be considered as a Fenton-like reaction in which transition metal ions are implemented to catalyze the CL reaction and evoke strong and intensive CL emission because when metal ions are combined with H2O2 it results in free radical formation, which is involved in the process of luminol oxidation.12
To improve and intensify the interaction between copper and H2O2 in the present research composite NPs with a high specific surface area (SSA) based on a 5 nm SnO2 core with a copper hydroxide and oxide amorphous shell were used. It is known that in alkaline medium H2O2 forms radicals by redox mechanisms. Thus, the effects of Cu0-, CuI- and CuII-based NPs on the luminol–H2O2 CL system were studied.
Synthesis of the SnO2 core with an average diameter of 5 nm was obtained by precipitation method (ESI Fig. 1,† step I) using 2 mL of 1 mol L−1 SnCl4 and 5 mL of 6 mol L−1 NH4OH as the initial reagents. The obtained SnO2 NPs were separated by centrifugation, washed three times with distilled water and used for the synthesis of core–shell NPs.
To obtain the copper hydroxide-based shell (ESI Fig. 1,† step II A) by precipitation method, 330 mg of CuCl2·2H2O (CuII-based NPs), 195 mg of CuCl (CuI-based NPs) and 330 mg of CuCl2·2H2O and 300 mg of NaBH4 (Cu0-based NPs) were added in a round flask equipped with pH meter, thermal sensor and magnetic stirrer, and the pH of the reaction medium was adjusted to 7 using 6 mol L−1 NH4OH.
To obtain the copper oxide-based shell (ESI Fig. 1,† step II B) by polyol method, 165 mg of CuCl2·2H2O, 100 mL of ethylene glycol and 200 mg of NaOH were added under inert gas flow in a round flask equipped with a thermal sensor and an overhead stirrer. The obtained NPs were separated when the temperature of the reaction mixture was 150 °C for CuII-based NPs, 175 °C for CuI-based NPs and 190 °C for Cu0-based NPs.
The NPs composition and structure were confirmed by X-ray diffraction (XRD, Bruker D2 Phaser) (ESI Fig. 2†) and X-ray photoelectron spectroscopy (XPS, Thermo Fisher Scientific Escalab 250Xi) (ESI Fig. 3†). According to transmission electron microscopy (TEM, JEOLS JEM 107) images (ESI Fig. 4†) and SSA (surface area analyzer Micromeritics ASAP-2020MP) values (250–300 m2 g−1), all NPs had average diameters of less than 10 nm.
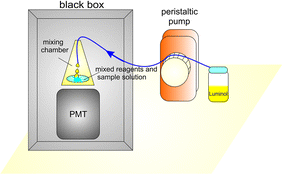
For CL analysis, a lab-made automated CL system (Fig. 1) was used. The system consisted of a lab-made CL detector and IsmatecReglo Digital MS peristaltic pump (Ismatec, Germany) ensuring a reverse flow (0.1 to 10 mL min−1) with a silicone pumping tube (1.02 mm in i.d.) for the injection of luminol solution into the CL detector. The CL detector consisted of a cone-shaped polypropylene mixing chamber (10 mm in i.d. and 35 mm in height) with the inlet in the top and total volume of 1 mL. The mixing chamber was placed in front of a photomultiplier tube (PMT). The CL signal produced in the mixing chamber was collected with the PMT and recorded by a compatible personal computer with analytical software. The Hamamatsu H11900 PMT (Hamamatsu Photonics, Japan) was utilized for the CL measurement. The CL detector was placed inside a black box to exclude flashing. The CL measurements were performed as follows.
In the first step, 80 μL of 1.0 × 10⁻⁴ mol L−1 H2O2 solution and 80 μL of 100 mg L−1 of NPs aqueous suspension were manually placed into the mixing chamber using a micro-pipet. After that, the mixing chamber was inserted in front of the CL detector. In the second step, the solution of 0.2 × 10⁻³ mol L−1 luminol was injected into the mixing chamber using the peristaltic pump for 2 s at a flow rate of 10 mL min−1. Simultaneously, the measurement of the CL signal was performed during 100 s. After that, the mixture was manually delivered to waste and the mixing chamber was washed with water. It was established that all prepared NPs enhanced the CL intensity of the luminol–H2O2 system. Meanwhile, the highest analytical signal and lowest RSD was observed for the SnO2 with Cu(I) oxide shell (SnO2@Cu2O) obtained by polyol method (Table 1). This phenomenon can be explained by the possible “free radical mechanism” including the following steps: (1) decomposition of H2O2 on the high specific surface area of the SnO2@Cu2O NPs resulting in the oxidation of Cu2O to CuO and generation of ˙OH radicals; (2) stabilization of the generated ˙OH radicals on the surface of the NPs; (3) oxidation of H2O2 and luminol by ˙OH radicals, which results in the generation of ˙O2− radicals and luminol radicals, respectively; (4) further reaction of the luminol radical and O2˙− radical generates the excited state 3-aminophthalate, which is the luminophore enhanced CL of the system. Thus, the radical formation is caused by the ox-red processes, wherein H2O2 can be an oxidizing or reducing agent. We assume that Cu(I) can participate in both processes as opposed to Cu(0) (only reducing agent) and Cu(II) (only oxidizing agent), resulting in better catalytic properties.
| Method of NPs synthesis | Structure | CL intensity | RSD, % |
|---|---|---|---|
| Precipitation method | SnO2@Cu(OH)2 | 0.23 | 15 |
| SnO2@CuOH | 0.23 | 18 | |
| SnO2@Cu | 0.34 | 12 | |
| Polyol method | SnO2@CuO | 1.5 | 12 |
| SnO2@Cu | 2.3 | 15 | |
| SnO2@Cu2O | 2.5 | 10 | |
In order to verify the “free radical mechanism”, the effects of the ˙O2− and ˙OH quenchers were studied according to the literature.13,14 Superoxide dismutase as the potential ˙O2− quencher and methanol, tert-butanol and n-butanol as the potential ˙OH quenchers were separately introduced into the luminol–H2O2–SnO2@Cu2O system. The results (ESI Fig. 5†) demonstrated that the CL intensity was significantly inhibited by all quenchers studied. Thus, the catalytic oxidation of luminol by H2O2 in the presence of the SnO2@Cu2O NPs involved both ˙OH and ˙O2− free radicals.
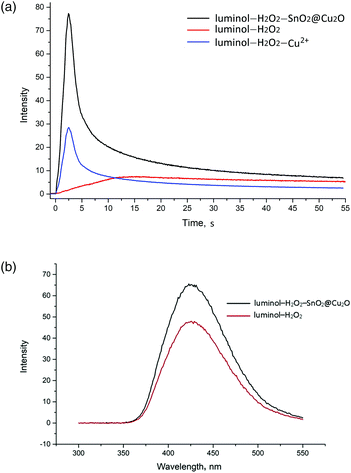
A model system was firstly employed to show the catalytic properties of SnO2@Cu2O towards the luminol–H2O2 system in alkaline medium (pH 11.0). As can be seen, the oxidation of luminol by H2O2 emits weak CL, which is significantly enhanced when the SnO2@Cu2O NPs are added (Fig. 2A). Moreover, the catalytic properties of the SnO2@Cu2O NPs and Cu2+ ions were compared under the same conditions. Previously, the concentration of Cu2+ ions after CL reaction in the presence of SnO2@Cu2O NPs was determined by electrothermal atomization-atomic absorption spectroscopy (Shimadzu Model AA-7000 atomic absorption spectrometer). The estimated concentration of Cu2+ ions was introduced in the luminol–H2O2 system whithout the NPs. It was shown (Fig. 2A) that the CL intensity for the SnO2@Cu2O NPs was higher than that for Cu2+ ions.
The fluorescence spectra (RF-5301 PC spectrofluorometer, Shimadzu, Japan) obtained for both the luminol–H2O2 and luminol–H2O2–SnO2@Cu2O systems have the same emission maximum at 425 nm, indicating that the luminophore for the CL system was still the excited-state 3-aminophthalate anions. The addition of SnO2@Cu2O did not generate a new luminophore for this CL system (Fig. 2B).
Recently, the Cu2O NPs (nanocubes) were found to enhance the CL intensity of the luminol–H2O2 system.15 It was shown that the CL intensity of the luminol–H2O2 system in the presence of the Cu2O NPs was gradually increased and saturation of CL was observed after 20 min, which might be owing to the completion of the Cu2O to CuO reaction. Unlike the Cu2O NPs (nanocubes), the SnO2@Cu2O NPs provided peak shaped analytical signal and the CL intensity reached its maximum in less than 10 s.
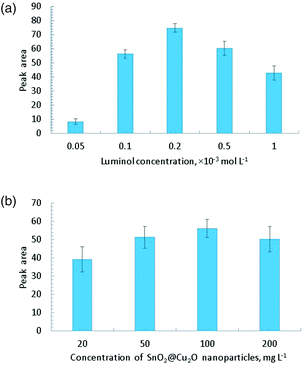
The catalytic property of SnO2@Cu2O was applied for the determination of H2O2 in hair clarifiers and mouthwash. Before the CL analysis, the reaction conditions for the luminol–H2O2–SnO2@Cu2O NPs CL system were optimized. The results demonstrated that the favorable conditions were 0.2 × 10⁻³ mol L−1 of luminol in 0.1 mol L−1 NaOH/NaHCO3 (pH 11.0) solution (Fig. 3A) and 100 mg L−1 of SnO2@Cu2O NPs (Fig. 3B). As can be seen in Fig. 3A, the maximum analytical signal was observed with the concentration of luminol at 0.2 × 10⁻³ mol L−1. At the higher concentrations, a quenching effect occurred. The same effect was found for SnO2@Cu2O concentration optimization. Low amounts of NPs led to a low analytical signal, but a high concentration caused a quenching effect.
 | ||
| Fig. 3 (A) Effect of luminol concentration (CNPs = 100 mg L−1, CH2O2 = 0.01 mol L−1). (B) Effect of SnO2@Cu2O concentration (Cluminol = 0.2 mmol L−1, CH2O2 = 0.01 mol L−1). | ||
The double log calibration curve for the analyte was linear in the range 2–400 μmol L−1 (I = 1.655 × C − 0.006), where I is the peak area and C is the concentration of H2O2 in μmol L−1. The LOD was calculated as three standard deviations (3s) and was assessed as 0.7 μmol L−1. The RSD values (n = 5) were 5% and 8% for 2 × 10⁻⁶ mol L−1 and 4 × 10⁻⁴ mol L−1 of H2O2, respectively. The proposed method was applied for the analysis of one mouthwash and two hair clarifier samples. The results were compared with the results obtained by fluorescence method16 (Table 2). For the recovery test, spiked hair clarifier and mouthwash samples were used.
| Sample | Labelled, % | Added, % | Found, % | t-test | F-test | Recovery, % | |
|---|---|---|---|---|---|---|---|
| Developed method | Reference method | ||||||
| Sample 1 | 0 | 0.064 ± 0.005 | 0.067 ± 0.005 | 1.37 | 1.52 | ||
| mouthwash | no | 0.5 | 0.597 ± 0.038 | 0.571 ± 0.023 | 2.51 | 2.67 | 106 |
| Sample 2 | 0 | 3.04 ± 0.20 | 2.97 ± 0.05 | 1.52 | 14.90 | ||
| hair clarifier | 3 | 2.0 | 4.96 ± 0.19 | 5.07 ± 0.11 | 2.23 | 3.02 | 96 |
| Sample 3 | 0 | 9.14 ± 0.18 | 9.03 ± 0.16 | 2.01 | 1.26 | ||
| hair clarifier | 9 | 5.0 | 14.53 ± 0.31 | 14.69 ± 0.53 | 0.57 | 15.18 | 108 |
The accuracy of the developed method was proven by Student's t-test. The paired t-test shows that the H2O2 contents found using the developed procedure were insignificantly different from those obtained by fluorescence method at the 95% confidence level. In addition, analytical results obtained for the samples using the developed method and reference method were compared using the F-test. F-values ≤19 indicate an insignificant difference in precision between both methods at the 95% confidence level. The recoveries obtained for each of the samples were within the 96–107% range, which is considered acceptable for this type of samples.
In conclusion, it was found that SnO2 NPs modified by copper greatly enhanced the CL intensity of the luminol–H2O2 system. The unique activity of SnO2@Cu2O NPs was used for the simple and sensitive detection of H2O2 in cosmetic products. The proposed luminol–H2O2–SnO2@Cu2O NPs CL system has the following advantages: (1) SnO2@Cu2O NPs can easily form a stable suspension in the aqueous phase, resulting in reproducible H2O2 detection results (RSD = 10%); (2) compared with the conventional luminol–H2O2 system the SnO2@Cu2O NPs increased the CL intensity more than 15 times; (3) the SnO2@Cu2O NPs can be easily prepared, and the NPs are cheap and readily available. Moreover, compared to Cu2O NPs (nanocubes) the SnO2@Cu2O NPs provided faster CL, resulting in high throughput CL analysis.
Conflicts of interest
There are no conflicts to declare.Acknowledgements
Christina Vakh thanks the Russian Foundation for Basic Research (research projects no. 16-33-60137 mol_a_dk). Scientific research was performed at the Center for chemical analysis and materials research, Centre for Physical Methods of Surface Investigation, Centre for Optical and Laser Materials Research, Centre for X-ray Diffraction Studies, and the Educational Resource Center of the Research Park.Notes and references
- D. L. Giokas, A. G. Vlessidis, G. Z. Tsogas and N. P. Evmiridis, TrAC, Trends Anal. Chem., 2010, 29, 1113–1126 CrossRef CAS.
- Y. Su, Y. Xie, X. Hou and Y. Lv, Appl. Spectrosc. Rev., 2014, 49, 201–232 CrossRef CAS.
- T. M. Triantis, K. Papadopoulos, E. Yannakopoulou, D. Dimotikali, J. Hrbáč and R. Zbořil, Chem. Eng. J., 2008, 144, 483–488 CrossRef CAS.
- P. Biparva, S. M. Abedirad and S. Y. Kazemi, Talanta, 2014, 130, 116–121 CrossRef CAS PubMed.
- J. X. Xie and Y. M. Huang, Anal. Methods, 2011, 3, 1149–1155 RSC.
- S. H. He, W. B. Shi, X. D. Zhang, J. A. Li and Y. M. Huang, Talanta, 2010, 82, 377–383 CrossRef CAS PubMed.
- A. Khataee, M. Iranifam, M. Fathinia and M. Nikravesh, Spectrochim. Acta, Part A, 2015, 134, 210–217 CrossRef CAS PubMed.
- Q. Zhu, Y. Chen, W. Wang, H. Zhang, C. Ren, H. Chen and X. Chen, Sens. Actuators, B, 2015, 210, 500–507 CrossRef CAS.
- Q. Zhu, D. Dong, X. Zheng, H. Song, X. Zhao, H. Chen and X. Chen, RSC Adv., 2016, 6, 25047–25055 RSC.
- I. I. Timofeeva, Ch. S. Vakh, A. V. Bulatov and P. J. Worsfold, Talanta, 2018, 179, 246–270 CrossRef CAS PubMed.
- T. Hallaj, M. Amjadi, Z. Song and R. Bagheri, Microchim. Acta, 2018, 185, 67 CrossRef PubMed.
- S. Koronkiewicz and S. Kalinowski, Talanta, 2015, 133, 112–119 CrossRef CAS PubMed.
- X. Li, L. Sun, A. Ge and Y. Guo, Chem. Commun., 2011, 47, 947–949 RSC.
- S. Bi, H. Zhou and S. Zhang, Chem. Commun., 2009, 5567–5569 RSC.
- K. Kaviyarasan, S. Anandana, R. V. Mangalaraja, T. Sivasankar and M. Ashokkumar, Ultrason. Sonochem., 2016, 29, 388–393 CrossRef CAS PubMed.
- M. E. Abbas, W Luo, L Zhu, J Zou and H Tang, Food Chem., 2010, 120, 327–331 CrossRef CAS.
Footnote |
| † Electronic supplementary information (ESI) available: Characterization of the developed nanoparticles. See DOI: 10.1039/c8an01868e |
| This journal is © The Royal Society of Chemistry 2019 |


