A conjugated carbon-dot–tyrosinase bioprobe for highly selective and sensitive detection of dopamine†
Zhongdi
Tang
ab,
Kai
Jiang
a,
Shan
Sun
a,
Sihua
Qian
a,
Yuhui
Wang
 *a and
Hengwei
Lin
 *a
*a
aKey Laboratory of Graphene Technologies and Applications of Zhejiang Province, Ningbo Institute of Materials Technology & Engineering, Chinese Academy of Sciences, Ningbo 315201, P. R. China. E-mail: wangyuhui@nimte.ac.cn; linhengwei@nimte.ac.cn
bNano Science and Technology Institute, University of Science and Technology of China, Suzhou 215123, P. R. China
First published on 19th October 2018
Abstract
In this work, a bioprobe for the detection of dopamine was designed and fabricated through covalently linking fluorescent carbon dots (CDs) and tyrosinase (TYR). The bioprobe (named CDs–TYR) can catalyze oxidation of dopamine and produce dopaquinone, and consequently the fluorescence of the CDs was quenched due to an efficient electron transfer mechanism from excited CDs to dopaquinone. The fluorescence intensity of CDs decreased in a dopamine-concentration-dependent manner, which built the foundation of dopamine quantification. The bioprobe provided a wide linear range from 0.1 to 6.0 μM for dopamine sensing. Additionally, excellent selectivity of the bioprobe to dopamine was achieved because of the specific catalytic character of the conjugated TYR. Furthermore, the bioprobe was successfully employed for the detection of dopamine in spiked human serum. To the best of our knowledge, this is the first example of the construction of a bioprobe through conjugating CDs and an enzyme. This work would open new opportunities to develop CD-based photoinduced electron transfer bioprobes for other analytes via linking typical enzymes onto CDs.
Introduction
Enzymes are kinds of macromolecular biological catalysts that can quickly convert substrates into different molecules by lowering the activation energy, playing significant roles in many physiological processes. However, enzymes usually involve some inherent drawbacks such as instability and inactivation. Immobilization of enzymes onto nanomaterials offers an effective method for enhancing enzymatic performance, which is mainly attributed to the large surface-to-volume ratio of nanomaterials and the avoidance of protein unfolding and turbulence.1 Besides, owing to their unique characters (e.g., high catalytic efficiency and good specificity towards substrates), enzymes have been popularly immobilized or modified on the surfaces of electrodes, mesoporous materials and inorganic phosphors to build electrochemical/optical sensors, photocatalysts and cancer therapy platforms.2Due to the merits of sensitive and noninvasive detection by fluorescence (FL) spectrometry, many fluorescent probes based on the integration of nano-phosphors and enzymes have attracted increasing attention.3 For instance, Wu et al. reported a glucose oxidase (GOx) conjugated Mn-doped ZnS Quantum Dot (QD) probe for glucose detection in biological fluids;4 Zhang's group developed a hydrogen peroxide sensor based on horseradish peroxidase functionalized gold nanoclusters;5 Zhang et al. devised two probes for tyrosine and uric acid detection in serum samples through tyrosinase (TYR) and uricase modified upconversion phosphors (UCPs).6 Unfortunately, the above probes still suffer from some native limitations, such as low FL quantum yields of gold nanoclusters and UCPs,7 potential toxicity from heavy metals and chemical instability of QDs.8 Therefore, a real need for the development of FL probes built by the combination of enzymes and new types of phosphors still remains.
Fluorescent carbon dots (CDs), a new class of carbon-based inorganic phosphors, have attracted much attention in many fields such as sensing, bioimaging, catalysis, nanomedicine and optoelectronic devices due to their fascinating merits (e.g., easy preparation, tunable FL emission, low cost, and high physical and chemical stabilities).9 In particular, good biocompatibility and high resistibility to photobleaching of CDs make them highly appropriate for the construction of fluorescent probes.10
Inspired by the above information, herein, a bioprobe has been constructed through covalently integrating CDs and an enzyme (i.e. TYR) for the first time. Moreover, the bioprobe was further applied for the detection of dopamine, an important organic chemical of the catecholamine families that plays several important roles in humans’ movement, emotion, cognition and neuroendocrine regulation.11 Owing to the superior optical properties of CDs and the specific/efficient catalytic performance of TYR, the bioprobe exhibits good photostability, excellent selectivity and relatively high sensitivity towards dopamine. Finally, the proposed bioprobe has been demonstrated to be applied for dopamine sensing in human serum samples.
Experimental
Reagents and apparatus
Citric acid, ethylenediamine (EDA), N-hydroxysulfosuccinimide sodium salt (Sulfo-NHS), N-(3-dimethylaminopropyl)-N′-ethylcarbodiimide hydrochloride (EDC·HCl), dopamine hydrochloride (DA), glutathione (GSH), L-tyrosine (L-Tyr), glutamic acid (Glu), and ATP were purchased from Aladdin Chemistry Co., Ltd (Shanghai, China). 2-Morpholinoethanesulfonic acid (MES) was provided by Tokyo Chemical Industry Co., Ltd. Tyrosinase (TYR) was obtained from Shanghai Yuanye Biological Technology Co., Ltd (Shanghai, China). The other compounds were obtained from Sinopharm Chemical Reagent Co., Ltd (Shanghai, China). All chemicals were of analytical reagent grade and used without further purification. Human serum samples were provided by Ningbo Medical Center Lihuili Eastern Hospital. Deionized (DI) water was used throughout this study.The sizes and morphologies of CDs and CDs–TYR were characterized by transmission electron microscopy (TEM) (Tecnai F20) operated at 200 kV. Fourier transform-infrared (FT-IR) spectroscopy of the CDs was performed on a Nicolet 6700 spectrometer (Thermo Fisher, America) using the KBr pellet technique. UV–Vis absorption spectra were recorded on a PERSEE T10CS UV–Vis spectrophotometer (Beijing, China). Fluorescence emission and excitation spectra were measured with a Hitachi F-4600 spectrophotometer (Hitachi, Japan). The fluorescence lifetime measurements were performed on a Fluorolog 3-11 (HORIBA, Jobin Yvon Inc.). The absolute fluorescence quantum yield of the CDs and CDs–TYR was determined using a Fluoromax-4 measurement system (HORIBA, Jobin Yvon. Inc.). Thermogravimetric analysis (TGA) was carried out on a PerkinElmer Pyris Diamond TG/DTA instrument under an air flow of 200 mL min−1 at a heating rate of 10 °C min−1 from room temperature to 800 °C. Circular dichroism spectra were recorded on a Chirascan-plus circular dichroism spectrometer (Applied Photophysics, UK). Centrifugation was carried out using a Z36HK centrifuge (Hermle, Germany).
Synthesis of CDs
CDs were synthesized according to a previous report.12 In brief, 1.39 g EDA and 2.0 g CA were dissolved in 10 mL water. Then, the mixture was subjected to a microwave reaction (750 W for 3 min). After cooling down to room temperature naturally, the as-prepared rufous colloid was added into 10 mL water, and dispersed through ultrasonication. Thereafter, the mixture was centrifuged (10![[thin space (1/6-em)]](https://www.rsc.org/images/entities/char_2009.gif) 000 rpm, 10 min) and filtered through a 0.22 μm membrane to remove large particles. Subsequently, the brown liquid was dialyzed through a dialysis membrane (2000 MWCO) for three days. Then, the fluid was concentrated by rotary evaporation and further dried in a vacuum oven. Finally, a tan powder, i.e. CDs, was harvested.
000 rpm, 10 min) and filtered through a 0.22 μm membrane to remove large particles. Subsequently, the brown liquid was dialyzed through a dialysis membrane (2000 MWCO) for three days. Then, the fluid was concentrated by rotary evaporation and further dried in a vacuum oven. Finally, a tan powder, i.e. CDs, was harvested.
Conjugation between CDs and TYR
The conjugation of TYR with CDs was carried out through amide condensation between the carboxyl of CDs and the primary amine of TYR according to the frequently used EDC/NHS strategy.13 Briefly, CDs (10 mg), EDC (20 mg) and NHS (10 mg) were mixed and stirred in MES buffer (0.1 M, pH 6.0) to activate the carboxyl of CDs. After 30 min reaction at room temperature, the pH value of the solution was adjusted to 7.4 using diluted NaOH solution (0.1 mM). Then, TYR (10 mg) was added into the above solution, and incubated for 3 h at room temperature. Subsequently, the mixture was separated by ultrafiltration (Millipore, 30 kDa, 6000 rpm, 10 min) three times. The upper filtrate i.e. the CD–TYR bioprobe was collected, and diluted with 2.0 mL water as a stock solution (3.0 mg mL−1). Finally, the obtained product was kept at 4 °C for the following fluorescence assays.Detection of DA by the bioprobe
For the sensing of DA, diverse amounts of DA were added into the bioprobe (15 μg mL−1) in PB buffer (10 mM, pH 6.8). After the mixture was incubated for 3 h at 37 °C, FL emission spectra of the samples were recorded using a FL spectrometer with an excitation at 350 nm. To evaluate the specificity of the bioprobe, different inspected species including metal ions, small molecules and proteins were added into the solution of the bioprobe in place of DA using identical experimental procedures. For detection in the serum matrix, a newly collected serum sample from volunteers was 50-fold diluted with PB buffer (10 mM, pH 6.8). Then, a standard addition of DA in the spiked serum was performed with the identical process as in the buffer. The emission intensities at 465 nm were monitored for quantitative analysis.Ethical statement
All the human serum samples were obtained from Ningbo Medical Center Lihuili Eastern Hospital, and only applied for the scientific research under the permission of the Medical Ethics Committee. Informed consent was obtained from all volunteers before being enrolled in the study.Results and discussion
Principle and design of the CD–TYR bioprobe
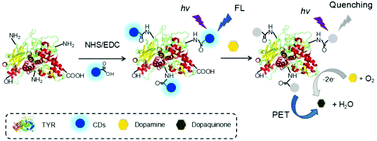
As shown in Scheme 1, fluorescent CDs with excellent photophysical properties were selected as the fluorophores. The obtained CDs exhibited abundant hydrophilic groups, e.g. carboxyl group, which can be activated by classical EDC/NHS conjugate technology and facilely modified with TYR. In the presence of DA, a catalytic reaction was launched via the TYR of the bioprobe, and the FL of the bioprobe was obviously quenched by the resulting catalysate, i.e. dopaquinone (electron acceptor), through a photoinduced electron transfer mechanism,14 which formed the basis of the DA detection. This bioprobe fully utilized the merits of CDs and the enzyme, which showed high sensitivity and excellent selectivity towards DA. Therefore, the bioprobe is attempted to be applied for DA sensing in biological fluids, such as human serum.Characterization of the CDs
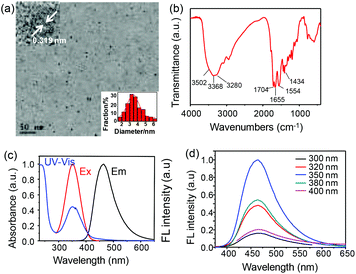
To realize the above design, CDs were firstly prepared through a typical hydrothermal method using citric acid and EDA as precursors. The size, morphology, surface state and photophysical properties were characterized, respectively. As shown in the TEM image (Fig. 1a), the harvested CDs exhibited good monodispersity, a uniform spherical morphology and narrow size distribution with an average diameter of ca. 3.7 nm (inset of Fig. 1a). Moreover, the CDs were crystalline with a clear lattice spacing of 0.319 nm (inset of Fig. 1a), which was consistent with the [002] facet of graphene.15 In Fig. 1b, the FT-IR spectrum of CDs presents the typical absorption of hydrophilic carboxyl (1704 and 3502 cm−1), amine (3368, 3280 and 1554 cm−1) and amide groups (1655 cm−1). The UV–Vis, FL excitation and optimal emission spectra of the CDs are shown in Fig. 1c. The UV–Vis absorption bands at 236 and 350 nm correspond to π–π* and n–π* transitions, respectively, which is in accordance with the FL excitation spectrum. Fig. 1d shows the FL emission spectra of the CDs at different excitation wavelengths varying from 300 to 400 nm. The CDs exhibited an excitation-independent FL emission property with the emission maximum at 465 nm, which is usually attributed to the surface state/defect induced emission.16 Moreover, the absolute FL quantum yield of the CDs was determined to be 25.3%. Furthermore, the obtained CDs possessed great resistance to photobleaching under continuous UV light irradiation (Fig. S1†). All these results illustrated that the CDs were ideal phosphors to fabricate nanoprobes through surface modification.Characterization of the bioprobe (CDs–TYR)
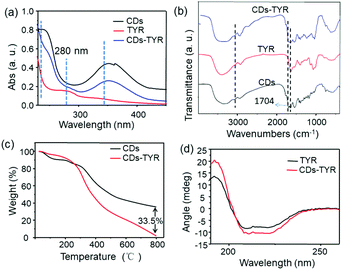
Due to the presence of abundant carboxyl functional groups on the surface of CDs, the bioprobe can be facilely fabricated through a coupling reaction between CDs and TYR. To verify the successful conjugation, UV–Vis absorption spectroscopy, FT-IR spectroscopy and TGA of CDs, TYR and CDs–TYR were performed, respectively. As shown in Fig. 2a, after being labeled with TYR, the conjugates (i.e. CDs–TYR) exhibited a typical absorption peak of TYR at 280 nm. As seen in Fig. 2b, the unique absorption peak of the carboxyl group (1704 cm−1) in the FT-IR spectrum of the CDs–TYR conjugates obviously decreased, which implied the successful condensation reaction between CDs and TYR.As seen in Fig. 2c, the TGA results showed the major weight loss to be of 64.4% and 97.9% for CDs and CDs–TYR, respectively. The grafting of TYR was thus calculated to be ca. 33.5% mass for the bioprobe. The above results demonstrated the successful linkage between CDs and TYR. The enzymatic activity is known to be directly associated with its secondary and tertiary structures.17 As shown in Fig. 2d, the circular dichroism (CD) spectra of CDs and CDs–TYR were similar to each other, which revealed that the tertiary structure of TYR well remained after conjugation. In addition, it was easy to find that the FL spectra of CDs showed nearly no change after their conjugations with TYR (Fig. S2†). The FL quantum yield of the CD–TYR conjugates was determined to be 9.8%, which was lower than that of the CDs (i.e. 25.3%). This FL quenching was mainly attributed to the self-absorption of the CDs that distributed on TYR with a shortened distance.18 Furthermore, the photostability of the bioprobe was also investigated. As shown in Fig. S3–S5,† the bioprobe exhibited excellent photostability under continuous ultraviolet light irradiation, stable emission at pH values between 5 and 9, and good tolerance to high ionic strengths up to 500 mM of NaCl. Furthermore, the harvested bioprobe also showed relatively long time storage stability (Fig. S6†). Such stable FL emission made the bioprobe robust in sensing applications.
DA detection in buffer
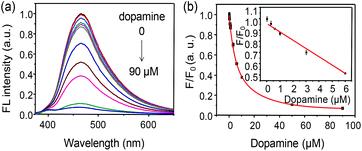
The time course of FL quenching induced by DA was first studied and is shown in Fig. S7.† It demonstrated that the FL of the bioprobe leveled off to saturation after 150 min of incubation with 10 μM DA. Temperature is an important factor in the activity of the enzyme. As shown in Fig. S8,† the optimal quenching efficiency for the bioprobe is obtained due to the higher catalytic activity of TYR under the condition of 37 °C incubation, which would enable a higher sensitivity or S/N ratio (signal to noise). So, 37 °C is selected for the following sensing. For DA detection, incremental amounts of DA were added into the bioprobe (15 μg mL−1). As shown in Fig. 3a, the fluorescence of the probe gradually decreased in the presence of DA from 0 to 90 μM, and a standard fitting curve was obtained (Fig. 3b). Moreover, the inset of Fig. 3b clearly reveals the linear relationship between the F/F0 ratio (F and F0 representing the FL intensities of the bioprobe in the presence and absence of DA, respectively) and the concentration of DA from 0.1 to 6.0 μM with a good linear correlation coefficient (R2 = 0.996). The detection limit for DA was thus calculated to be 0.06 μM according to the standard 3σ (signal to-noise) criteria.19 According to many previous reports, enzyme immobilization on the surface of nanomaterials can improve its activity and enhance its sensitivity.20 To verify the enhanced catalytic activity of TYR immobilized on CDs, a control experiment was performed. Firstly, TYR (5 μg mL−1) was simply mixed with CDs (10 μg mL−1). After an identical incubation procedure with DA (10 μM), the FL emission decreased only about 15% (Fig. S9†), which was obviously lower than that of the CDs–TYR (15 μg mL−1) in the presence of an equivalent amount of DA (Fig. 3b). Such a significant difference in FL quenching is mainly attributed to the increased catalytic activity of TYR after its conjugation to CDs. Thus, the linkage between CDs and TYR is necessary, and enables high sensitivity of the bioprobe towards DA. To investigate the mechanism of fluorescence quenching of the bioprobe by DA, FL lifetime measurements were performed. The FL lifetimes of the bioprobe in the absence (2.1 ns) or presence (2.4 ns) of DA are similar (Fig. S10†), demonstrating a photoinduced electron transfer process from CDs to DA.Selectivity of the bioprobe towards DA
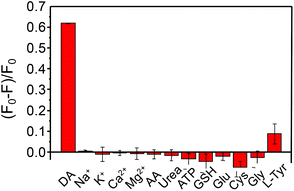
Since the assay was based on the specific catalysis of a substrate by the enzyme, a high specificity was naturally expected. To assess the selectivity of this enzyme-conjugated bioprobe for DA, the influence of some biological species including metal ions, small molecules and protein was inspected. As shown in Fig. 4, no obvious fluorescence alteration induced by the interfering species was observed except in the presence of DA. In particular, L-tyrosine (L-Tyr), a substrate to TYR, was also selected as an inspected species with the same concentration as DA (10 μM). However, the fluorescence of the bioprobe only decreased by ca. 10% upon the addition of Tyr (10 μM). In the presence of DA, the bioprobe might further catalyze DA to polydopamine (PDA) nanoparticles, an excellent light absorber and super-nanoquencher to many fluorophores.21 Thereby, a great FL quenching of the bioprobe is observed if DA is selected as a substrate. These results clearly demonstrated the excellent specificity of this bioprobe for DA determination. In Table 1, a detailed comparison of analytical performances to DA (e.g., limit of detection (LOD), selectivity and linear range), chemical stability and the fabrication process of the nanoprobe with the recently reported ones is provided. As shown therein, the nanoprobe in this study exhibits overall advantages compared to the previous ones.| Phosphors | Linear range (μM) | LOD (nM) | Selectivity | Stability | Ref. |
|---|---|---|---|---|---|
| Silicon QDs | 0.005–10.0 | 0.3 | Poor | Yes | 22 |
| GQDs | 0.01–300 | 8 | Poor | Yes | 23 |
| CuInS2 QDs | 0–100 | 200 | Poor | No | 24 |
| C3N4 | 0–1000 | 30 | Good | No | 25 |
| Au NCs | 0.01–1000 | 10 | Good | No | 26 |
| GO | 0–50 | 94 | Poor | No | 27 |
| CDs | 0–100 | 68 | Poor | Yes | — |
| CDs | 0.1–6.0 | 60 | Good | Yes | This study |
DA detection in human serum
Bestowed with the good analytical performance, the bioprobe was finally proposed for DA detection in biological samples. Four individual human serum samples were analyzed, and the results are listed in Table S1.† Taking 50-fold diluted human serum as the assay medium, a standard addition experiment was carried out to validate the determination. As shown in Table S1,† the recoveries ranged from 91.3% to 104% with RSDs between 1.5% and 7.0%, which were acceptable for quantitative detection performed in biological samples. The results revealed the robustness of the bioprobe for DA sensing in biological fluids.Conclusions
In summary, a CD–TYR bioconjugate has been first fabricated and developed for dopamine sensing. Dopamine can react with TYR to form dopaquinone that could in turn quench the fluorescence of CDs because of the electron transfer process. The FL intensities of the CDs–TYR bioconjugate decrease in a dopamine-concentration-dependent manner, making it very suitable for the quantitative detection of dopamine. Due to the excellent optical properties and enhanced catalytic activity, the bioprobe exhibits relatively high sensitivity. Owing to the specific catalytic reaction between TYR and its substrate, the bioprobe shows excellent selectivity towards dopamine. Furthermore, the proposed bioprobe was applied for dopamine determination in human serum samples. This work will open up new opportunities to build other CD-based highly selective probes through linking a variety of enzymes. Nonetheless, two insufficiencies of this bioprobe should be mentioned. One is that the sensing principle of the bioprobe was designed on a fluorescence quenching mechanism (i.e. signal turn-off). The other is that the bioprobe was shame to detect intrinsic dopamine in human serum due to its blue emission feature. To overcome these defects, near-infrared (NIR) and phosphorescent CDs are good candidates due to their respective NIR and time-gated detection window, and this work is underway in our group.Conflicts of interest
There are no conflicts to declare.Acknowledgements
The authors acknowledge the financial support from the National Natural Science Foundation of China (21607160, 51872300 and U1832110), the Zhejiang Provincial Natural Science Foundation of China (LY16B050005), Ningbo Science and Technology Bureau (2016A610268 and 2016C50009), and the W. C. Wong Education Foundation (rczx0800).Notes and references
- (a) Z. Zhou and M. Hartmann, Chem. Soc. Rev., 2013, 42, 3894–3912 RSC; (b) E. T. Hwang, R. Tatavarty, H. Lee, J. Kim and M. B. Gu, J. Mater. Chem., 2011, 21, 5215–5218 RSC.
- (a) A. Zebda, C. Gondran, A. L. Goff, M. Holzinger, P. Cinquin and S. Cosnier, Nat. Commun., 2011, 2, 370 CrossRef PubMed; (b) B. I. Ipe and C. M. Niemeyer, Angew. Chem., Int. Ed., 2006, 45, 504–507 CrossRef CAS PubMed; (c) J. Yuan, D. Wen, N. Gaponik and A. Eychmüller, Angew. Chem., Int. Ed., 2013, 52, 976–979 CrossRef CAS PubMed; (d) M. J. Ruedas-Rama and E. A. H. Hall, Anal. Chem., 2010, 82, 9043–9049 CrossRef CAS PubMed; (e) A. Popat, B. P. Ross, J. Liu, S. Jambhrunkar, F. Kleitz and S. Z. Qiao, Angew. Chem., Int. Ed., 2012, 51, 12486–12489 CrossRef CAS PubMed.
- (a) X. Xu, J. Qian, J. Yu, Y. Zhang and S. Liu, Chem. Commun., 2014, 50, 7607–7610 RSC; (b) J. Yuan, N. Gaponik and A. Eychmüller, Anal. Chem., 2012, 84, 5047–5052 CrossRef CAS PubMed; (c) N. E. Azmi, N. I. Ramli, J. Abdullah, M. A. A. Hamid, H. Sidek, S. A. Rahman, N. Ariffin and N. A. Yusof, Biosens. Bioelectron., 2015, 67, 129–133 CrossRef CAS PubMed; (d) X. Gao, Y. Zhao, B. Zhang, Y. Tang, X. Liu and J. Li, Analyst, 2016, 141, 1105–1111 RSC; (e) E. Jang, S. Kim and W.-G. Koh, Biosens. Bioelectron., 2012, 31, 529–536 CrossRef CAS PubMed.
- P. Wu, Y. He, H. F. Wang and X. P. Yan, Anal. Chem., 2010, 82, 1427–1433 CrossRef CAS PubMed.
- F. Wen, Y. Dong, L. Feng, S. Wang, S. Zhang and X. Zhang, Anal. Chem., 2011, 83, 1193–1196 CrossRef CAS PubMed.
- (a) Q. Wu, A. Fang, H. Li, Y. Zhang and S. Yao, Biosens. Bioelectron., 2016, 77, 957–962 CrossRef CAS PubMed; (b) Q. Long, A. Fang, Y. Wen, H. Li, Y. Zhang and S. Yao, Biosens. Bioelectron., 2016, 86, 109–114 CrossRef CAS PubMed.
- J.-C. Boyer and F. C. J. M. van Veggel, Nanoscale, 2010, 2, 1417–1419 RSC.
- J. M. Tsay and X. Michalet, Chem. Biol., 2005, 12, 1159–1161 CrossRef CAS PubMed; (a) S. M. Lim, W. Shen and Z. Gao, Chem. Soc. Rev., 2015, 44, 362–381 RSC; (b) H. Feng and Z. Qian, Chem. Rec., 2018, 18, 491–505 CrossRef CAS PubMed; (c) L. Chai, J. Zhou, H. Feng, C. Tang, Y. Huang and Z. Qian, ACS Appl. Mater. Interfaces, 2015, 7, 23564–23574 CrossRef CAS PubMed; (d) X. M. Li, M. C. Rui, J. Z. Song, Z. H. Shen and H. B. Zeng, Adv. Funct. Mater., 2015, 25, 4929–4947 CrossRef CAS; (e) S. Sun, L. Zhang, K. Jiang, A. Wu and H. Lin, Chem. Mater., 2016, 28, 8659–8668 CrossRef CAS; (f) J. Ge, Q. Jia, W. Liu, L. Guo, Q. Liu, M. Lan, H. Zhang, X. Meng and P. Wang, Adv. Mater., 2015, 27, 4169–4177 CrossRef CAS PubMed.
- (a) L. L. Feng, Y. X. Wu, D. L. Zhang, X. X. Hu, J. Zhang, P. Wang, Z. L. Song, X. B. Zhang and W. Tan, Anal. Chem., 2017, 89, 4077–4084 CrossRef CAS PubMed; (b) S. Sun, K. Jiang, S. Qian, Y. Wang and H. Lin, Anal. Chem., 2017, 89, 5542–5548 CrossRef CAS PubMed; (c) J. Zhu, S. Sun, K. Jiang, Y. Wang, W. Liu and H. Lin, Biosens. Bioelectron., 2017, 97, 150–156 CrossRef CAS PubMed; (d) W. Song, W. Duan, Y. Liu, Z. Ye, Y. Chen, H. Chen, S. Qi, J. Wu, D. Liu, L. Xiao, C. Ren and X. Chen, Anal. Chem., 2017, 89(24), 13626–13633 CrossRef CAS PubMed; (e) I. Costas-Mora, V. Romero, I. Lavilla and C. Bendicho, Anal. Chem., 2014, 86(9), 4536–4543 CrossRef CAS PubMed.
- (a) R. A. Wise, Nat. Rev. Neurosci., 2004, 5, 483–494 CrossRef CAS PubMed; (b) Q. Mu, H. Xu, Y. Li, S. Ma and X. Zhong, Analyst, 2014, 139, 93–98 RSC; (c) Y. Teng, X. Jia, J. Li and E. Wang, Anal. Chem., 2015, 87, 4897–4902 CrossRef CAS PubMed; (d) T. Regina and I. C. Vieira, Analyst, 2016, 141, 216–224 RSC.
- J. Wang, P. Zhang, C. Huang, G. Liu, K. C.-F. Leung and Y. X. J. Wáng, Langmuir, 2015, 31, 8063–8073 CrossRef CAS PubMed.
- B. Tang, L. Cao, K. Xu, L. Zhuo, J. Ge, Q. Li and L. Yu, Chem. – Eur. J., 2008, 14, 3637–3644 CrossRef CAS PubMed.
- I. L. Medintz, M. H. Stewart, S. A. Trammell, K. Susumu, J. B. Delehanty, B. C. Mei, J. S. Melinger, J. B. Blanco-Canosa, P. E. Dawson and H. Mattoussi, Nat. Mater., 2010, 9, 676–684 CrossRef CAS PubMed.
- A. Reina, S. Thiele, X. T. Jia, S. Bhaviripudi, M. S. Dresselhaus, J. A. Schaefer and J. Kong, Nano Res., 2009, 2, 509–516 CrossRef CAS.
- Y. Dong, H. Pang, H. B. Yang, C. Guo, J. Shao, Y. Chi, C. M. Li and T. Yu, Angew. Chem., Int. Ed., 2013, 52, 7800–7804 CrossRef CAS PubMed.
- L. Pollegioni, G. Wels, M. S. Pilone and S. Ghisla, Eur. J. Biochem., 1999, 264, 140–151 CrossRef CAS PubMed.
- Y. Hong, J. W. Y. Lam and B. Z. Tang, Chem. Soc. Rev., 2011, 40, 5361–5388 RSC.
- X. Wu, S. Sun, Y. Wang, J. Zhu, K. Jiang, Y. Leng, Q. Shu and H. Lin, Biosens. Bioelectron., 2017, 90, 501–507 CrossRef CAS PubMed.
- B. Samanta, X.-C. Yang, Y. Ofir, M.-H. Park, D. Patra, S. S. Agasti, O. R. Miranda, Z.-H. Mo and V. M. Rotello, Angew. Chem., Int. Ed., 2009, 48, 5341–5344 CrossRef CAS PubMed.
- (a) Y. Liu, K. Ai and L. Lu, Chem. Rev., 2014, 114, 5057–5115 CrossRef CAS PubMed; (b) Q. Liu, Z. Pu, A. M. Asiri, A. O. Al-Youbi and X. Sun, Sens. Actuators, B, 2014, 191, 567–571 CrossRef CAS.
- X. Zhang, X. Chen, S. Kai, H. Wang, J. Yang, F. Wu and Z. Chen, Anal. Chem., 2015, 87, 3360–3365 CrossRef CAS PubMed.
- S. Weng, D. Liang, H. Qiu, Z. Liu, Z. Lin, Z. Zheng, A. Liu, W. Chen and X. Lin, Sens. Actuators, B, 2015, 221, 7–14 CrossRef CAS.
- S. Liu, F. Shi, X. Zhao, L. Chen and X. Su, Biosens. Bioelectron., 2013, 47, 379–384 CrossRef CAS PubMed.
- H. Li, M. Yang, J. Liu, Y. Zhang, Y. Yang, H. Huang, Y. Liu and Z. Kang, Nanoscale, 2015, 7, 12068–12075 RSC.
- J. L. Chen, X. P. Yan, K. Meng and S. F. Wang, Anal. Chem., 2011, 83, 8787–8793 CrossRef CAS PubMed.
- Y. Tao, Y. Lin, J. Ren and X. Qu, Biosens. Bioelectron., 2013, 42, 41–46 CrossRef CAS PubMed.
- K. Qu, J. Wang, J. Ren and X. Qu, Chem. – Eur. J., 2013, 19, 7243–7249 CrossRef CAS PubMed.
Footnote |
| † Electronic supplementary information (ESI) available. See DOI: 10.1039/c8an01659c |
| This journal is © The Royal Society of Chemistry 2019 |

