
 Open Access Article
 This Open Access Article is licensed under a
 Creative Commons Attribution 3.0 Unported Licence
Environmental sustainability of cellulose-supported solid ionic liquids for CO2 capture†
Pelayo
García-Gutiérrez
a,
Rosa M.
Cuéllar-Franca
a,
Dan
Reed
b,
George
Dowson
bc,
Peter
Styring
b and
Adisa
Azapagic
 *a
*a
aSustainable Industrial Systems, School of Chemical Engineering and Analytical Science, The Mill, Sackville Street, The University of Manchester, Manchester M13 9PL, UK. E-mail: adisa.azapagic@manchester.ac.uk
bUK Centre for Carbon Dioxide Utilisation, Department of Chemical & Biological Engineering, Sir Robert Hadfield Building, The University of Sheffield, Sheffield, S1 3JD, UK
cCentre for Doctoral Training in Complex Particulate Products and Processes, School of Chemical & Process Engineering, University of Leeds, Leeds LS2 9JT, UK
First published on 9th July 2019
Abstract
Solid ionic liquids (SoILs) with cellulose as a support have been demonstrated recently to be effective and low-cost sorbents for CO2 capture. However, at present it is not clear whether they remove more CO2 than is released in the rest of the life cycle, including their manufacture, regeneration and disposal. It is also unknown what other impacts they may have over the whole life cycle while attempting to mitigate climate change. Therefore, this study evaluates for the first time the life cycle environmental sustainability of cellulose-supported SoILs in comparison with unsupported SoILs and some other sorbents. Four SoILs are assessed for 11 life cycle impacts, including global warming potential (GWP), with and without the cellulose support: methyltrioctyl ammonium acetate ([N1888][Ac]), tetraethyl ammonium acetate ([N4444][Ac]), tetra-octylammonium bromide ([N8888]Br) and 1-butyl-4-methylimidazolium bromide ([Bmim]Br). They are compared with one of the ILs in the liquid state (trihexyltetradecylphosphonium 1,2,4-triazolide ([P66614][124Triz])) and with three conventional sorbents: monoethanolamine (MEA), zeolite powder and activated carbon. The results show that SoILs with cellulose loading in the range of 70%–80 wt% have better environmental performance per unit mass of CO2 captured than the unsupported SoILs. The net removal of CO2 eq. over the life cycle ranges from 20% for pure [Bmim]Br to 83% for [N1888][Ac] with 75% cellulose and for [N4444][Ac] with both 75% and 80% loadings. However, pure [N8888]Br generates three times more CO2 eq. over the life cycle than it removes. Among the SoILs, [N4444][Ac] with 80% cellulose has the lowest life cycle impacts for eight out of 11 categories. When compared to the conventional sorbents, it has significantly higher impacts, including GWP. However, it is more sustainable than [P66614][124Triz]. The results of this study can be used to target the hotspots and improve the environmental performance of cellulose-supported SoILs through sustainable design.
1 Introduction
Reducing greenhouse gas (GHG) emissions and improving the security of energy supply within the context of an ever-growing energy demand have become major global challenges. Carbon capture and storage (CCS) along with carbon capture and utilisation (CCU) are seen as potentially viable technological options that can contribute towards reducing CO2 emissions.1–3 However, their successful commercial implementation depends, among other factors, on the efficiency of CO2 capture and its net removal on a life cycle basis, which can in turn influence significantly their economic and environmental sustainability. Currently, the most advanced large-scale CO2 capture technologies rely on amine-based aqueous solutions, such as monoethanolamine (MEA).4–6 This is due to a range of advantages they provide, including high absorption capacity and high selectivity towards other gases.7 However, they are liable to evaporation losses, corrosive at elevated temperatures and their regeneration is energy intensive owing to the stability of the carbamate salt formed in the reaction between CO2 and MEA.6,8,9Over the last few years, alternative sorbents have been suggested for CO2 capture.10 Among these, ionic liquids (ILs), which are defined as organic salts with melting points below 120–140 °C,11 have shown high CO2 affinity and hence have attracted significant attention.10,12 In contrast to amine-based solvents, ILs have negligible vapour pressure and low corrosivity.10,13 In addition, many of them are chemically stable at elevated temperatures.14 Furthermore, the large number of possible combinations of cations and anions in the IL synthesis enable the design of task-specific ILs.15 However, two key factors hinder their successful implementation for CO2 capture at a commercial scale. Firstly, the high viscosity of ILs which are in the liquid state at room-temperatures (RTILs) results in extremely low CO2 diffusion rates through the bulk liquid.16 Even for low-viscosity RTILs, the diffusion rate is 19 orders of magnitude below that of MEA.7 Secondly, the costs of RTILs remain high compared to other solvents. This is crucial since the low CO2 diffusion rate means that very large quantities of ionic liquids are required in a capture plant, which in turn has negative implications for costs and the environmental footprint of the plant.
Organic salts with melting points significantly higher than room temperature have been proposed as an alternative to RTILs for applications such as CO2 capture and energy storage.17–21 These compounds have a somewhat contradictory name – ‘solid ionic liquids’ (SoILs) – as they are in the solid state at room temperature. In particular, methyltrioctyl ammonium acetate ([N1888][Ac]), tetraethyl ammonium acetate ([N4444][Ac]), tetra-octylammonium bromide ([N8888]Br) and 1-butyl-4-methylimidazolium bromide ([Bmim]Br) have been investigated for CO2 capture.17 The rationale for the selection of these compounds relies on their high CO2 uptake, ease of preparation and low cost of synthesis.7 The aim of using such compounds is to alleviate the low CO2 diffusion issues by the presence of large ionic surface areas. In contrast to the CO2 capture methods of RTILs, SoILs are used in pressure swing adsorption (PSA) systems, which rely on a drop in pressure to release the more weakly-bound CO2. PSA is an established process used in industry for gas or liquid separations.22,23 Here, it is used to counteract the fact that, typically, crystalline and impermeable SoILs will not allow full gas–solid contact;17 therefore, by applying a high pressure swing process, uptake capacities can be boosted by increasing gas–solid surface interactions.
Recently, cellulose has been suggested as a support for a range of SoILs. The motivation for this is the efficiency improvement through an increased ionic-surface area by cellulose coating, which in turn reduces the overall sorbent costs.17 However, it is not clear if this also leads to a net CO2 removal and an improved overall environmental performance of SoILs when taking into account the whole life cycle of the process. It is also unknown how they compare environmentally to RTILs and conventional CO2 sorbents. Therefore, this paper evaluates the life cycle environmental sustainability of different SoILs, considering their production and use for CO2 capture. A life cycle assessment (LCA) methodology has been used for these purposes, developed specifically to guide the sustainable development of novel ILs.24 This is described in the next section, followed by the results in section 3 and the conclusions and recommendations for future work in section 4.
2 Methods
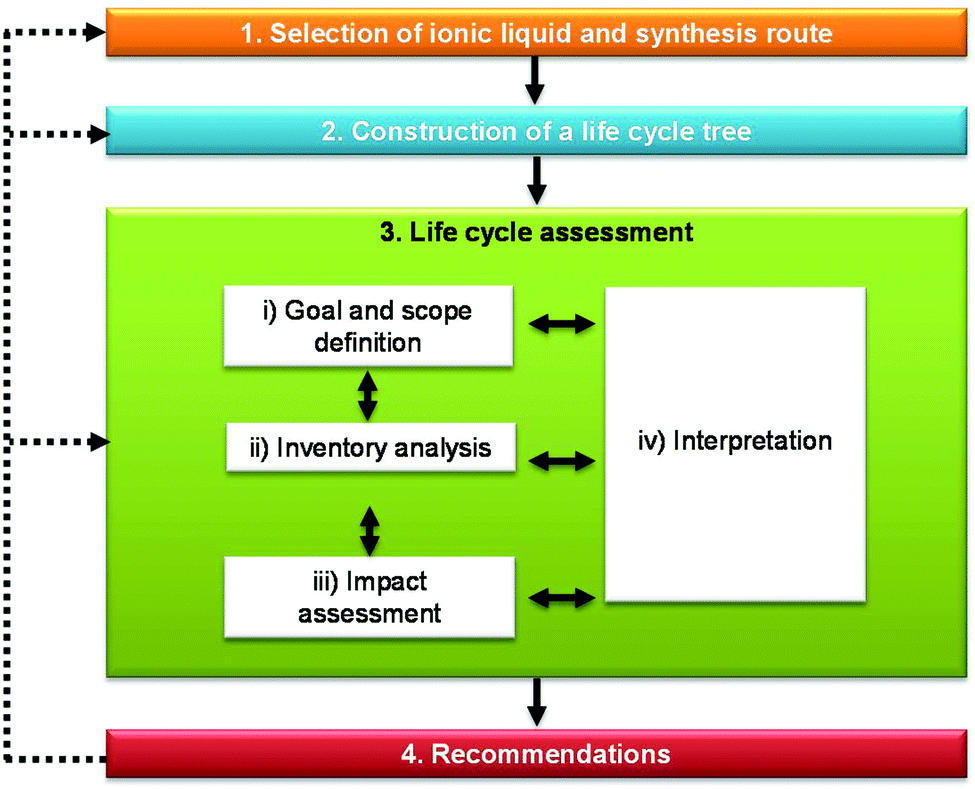
Life cycle data for ILs are scarce or non-existent owing to their limited use in industry or being available only at the laboratory scale. Furthermore, most ILs have complex chemical structures and numerous precursors are used in their production, for which environmental data are often lacking. To address this issue, a new LCA methodology was developed by Cuéllar-Franca et al.24 which is applied in this study. This methodology helps to fill in data gaps and scale up laboratory data to industrial production, thus aiding the design of ILs under development and identification of more sustainable CO2 sorbents.As shown in Fig. 1, the methodology comprises four main steps which, when applied to SoILs, involve the following:
1. selection of SoILs and the synthesis route to be considered in the study;
2. construction of a life cycle tree showing the precursors used in the synthesis of the selected SoILs to enable the identification of data gaps and tracing back to the basic precursors for which life cycle data are available;
3. LCA of SoILs to estimate the environmental impacts of interest, identify hotspots and compare SoILs with other sorbents; and
4. recommendations for improvements, which can include a change of the synthesis route, substitution of raw materials, improvements in the energy and atom efficiency or selection of a different ionic liquid.
 | ||
| Fig. 1 Methodology for assessing the life cycle environmental sustainability of ionic liquids (adapted from Cuéllar-Franca et al.24). | ||
This process is iterative, with the recommendations fed back to the preceding steps, as needed. The following sections describe each of the above steps in more detail.
2.1 Selection of SoILs and synthesis route
The following four SoILs proposed previously for CO2 capture7,17 are assessed in this study with and without the cellulose support:• methyltrioctyl ammonium acetate ([N1888][Ac]);
• tetraethyl ammonium acetate ([N4444][Ac]);
• tetra-octylammonium bromide ([N8888]Br); and
• 1-butyl-4-methylimidazolium bromide ([Bmim]Br).
[N1888][Ac] is synthesised in three steps: production of quaternary tetraalkylammonium (amine quarterisation), anion exchange and reaction with acetic acid.25 The synthesis process is depicted in Fig. 2a. In the first step, trioctylamine is mixed with methyl iodide in stoichiometric amounts at room temperature to yield methyltrioctylammonium iodide [N1888]I.25 The reaction is carried out using Schlenk-line techniques under an inert (N2) atmosphere. Aluminium foil protection on the exterior of the reaction vessel and low lighting are used to prevent the decomposition of methyl iodine. In the second step, the anion exchange resin (Amberlite IRA resin) is regenerated with 1 M NaOH and rinsed with isopropanol. Then, [N1888]I prepared as in the previous step is dissolved in isopropanol and passed slowly through the resin, dropping directly into a flask. The product containing isopropanol and [N1888][OH] is passed through the column several times to exchange completely the iodide for the hydroxide anion.25 Finally, [N1888][OH] is reacted with excess acetic acid and stirred for 16 hours at room temperature to yield [N1888][Ac], which is then dried in a rotary evaporator at 50 °C and under high vacuum (10 mbar) for 48 hours.
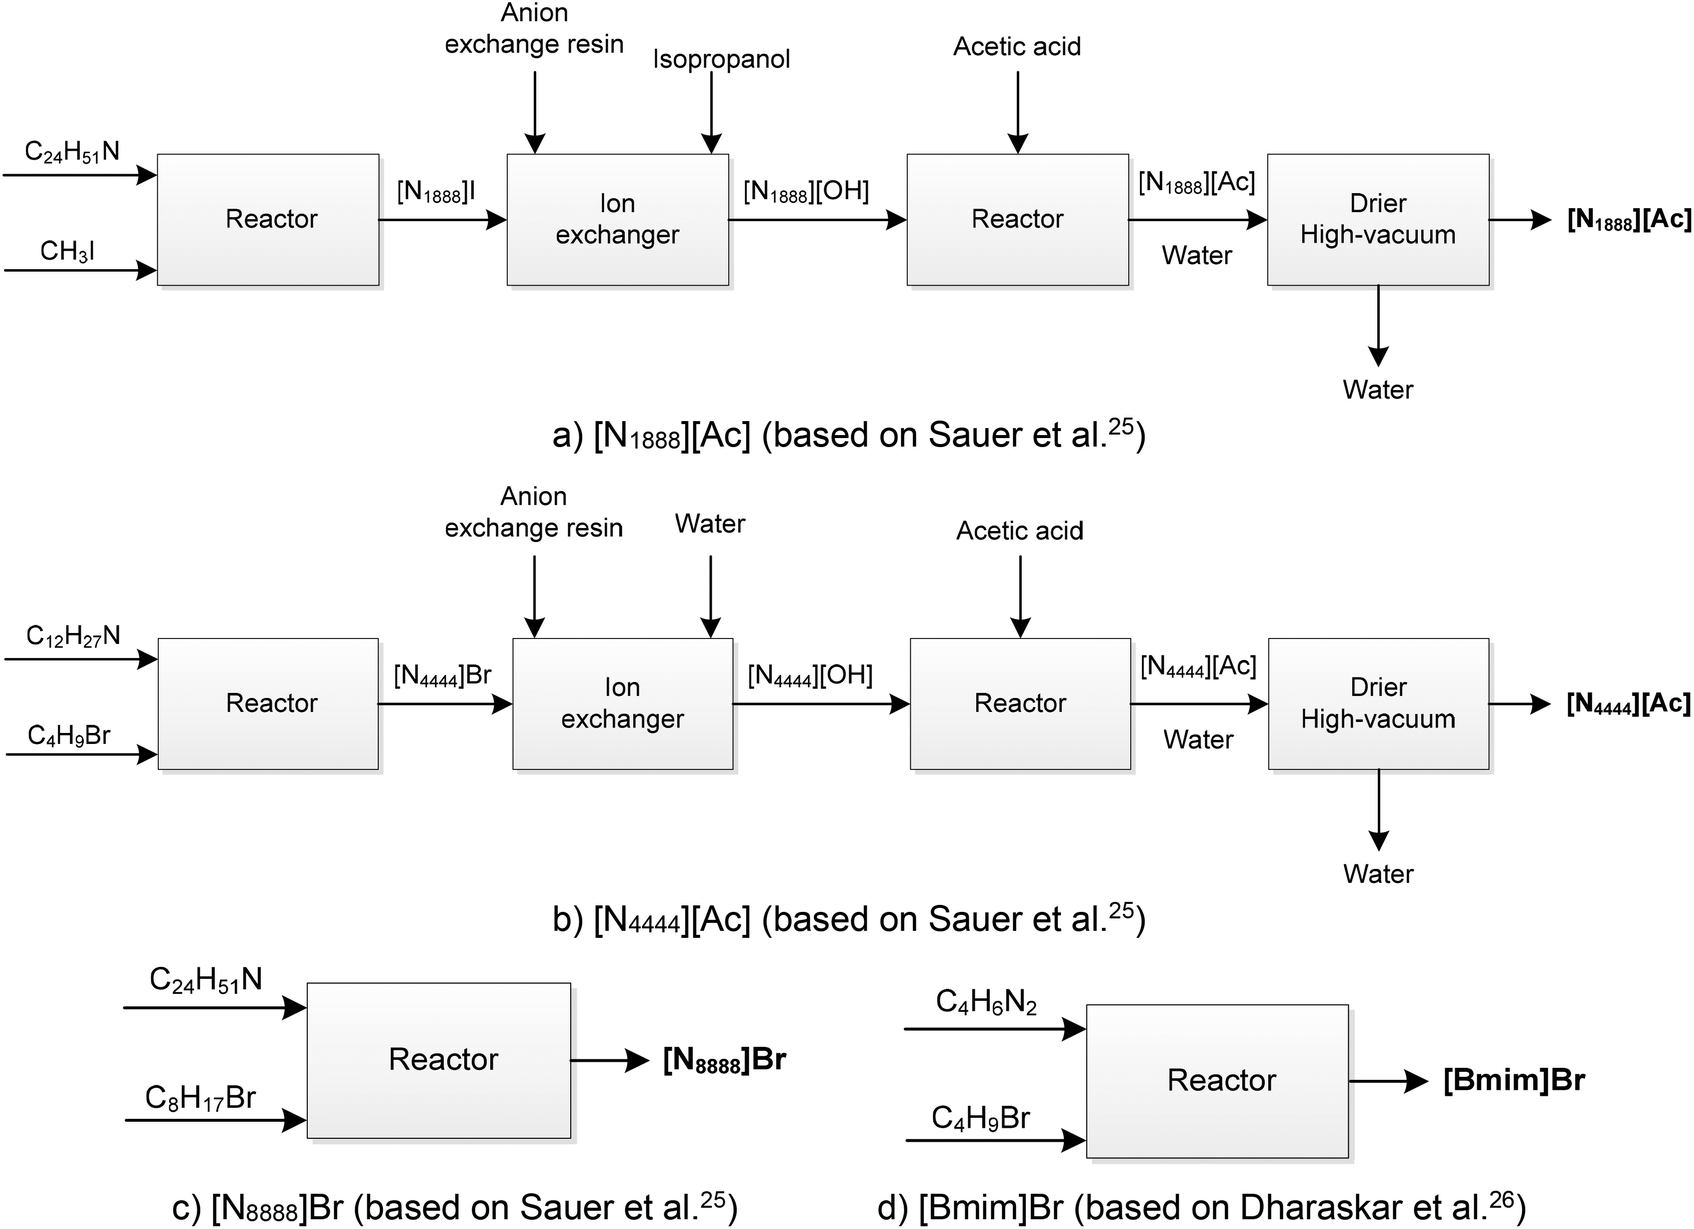 | ||
| Fig. 2 Synthesis routes for the four SOILs considered in the study. | ||
Similar to [N1888][Ac], [N4444][Ac] is also synthesised in three steps involving amine quarterisation, anion exchange and reaction with acetic acid25 (Fig. 2b). In the first step, tributylamine is mixed stoichiometrically at room temperature with 1-bromobutane to yield tetrabutylammonium bromide, [N4444]Br. The second and third steps are equivalent to the synthesis of [N1888][Ac], i.e. anion exchange followed by reaction with acetic acid. The only difference between these two is that distilled water is used to dissolve [N4444]Br instead of isopropanol used for [N1888]I.
[N8888]Br is synthesised by mixing trioctylamine with 1-bromooctane in the stoichiometric ratio at room temperature to obtain bromide salt25 (Fig. 2c). Finally, [Bmim]Br is synthesised by mixing 1-methylimidazole with 1-bromobutane in stoichiometric amounts at 70 °C over 48 hours.26 The synthesis process is shown in Fig. 2d.
The cellulose support for the ionic liquids is produced using wet coating techniques.17 In this process, the ionic liquids are first dissolved in equal parts of methanol and isopropanol (5 litres of solvent per kg IL) before adding the required amount of cellulose. The alcohol solvents are removed by vacuum evaporation. Different cellulose loadings are considered, ranging from 70–80 wt% (i.e. 30% SoIL/70% cellulose to 20% SoIL/80% cellulose). This particular range of cellulose loadings has been chosen owing to the enhanced CO2 adsorption capacity compared to lower or higher loadings.17
2.2 Life cycle tree of SoILs
Some of the compounds used in the synthesis of the SoILs considered in this study are not available in LCA databases. To overcome this issue, these compounds have been traced back to their main precursors through the construction of a life cycle tree for each SoIL, as shown in Fig. 3. As can be seen from the figures, only the precursors for [Bmim]Br (C4H6N2 and C6H5Br) are available in LCA databases (indicated as the dark-shaded boxes). For all others, there are significant data gaps, in most cases requiring tracing back to the basic precursors and their production processes. For example, the amines needed to synthesise both [N1888]I (used as a precursor in N1888[Ac]) and [N4444]Br (a precursor for N4444[Ac]) are traced back to ammonia and the alcohols used in their respective syntheses.27,28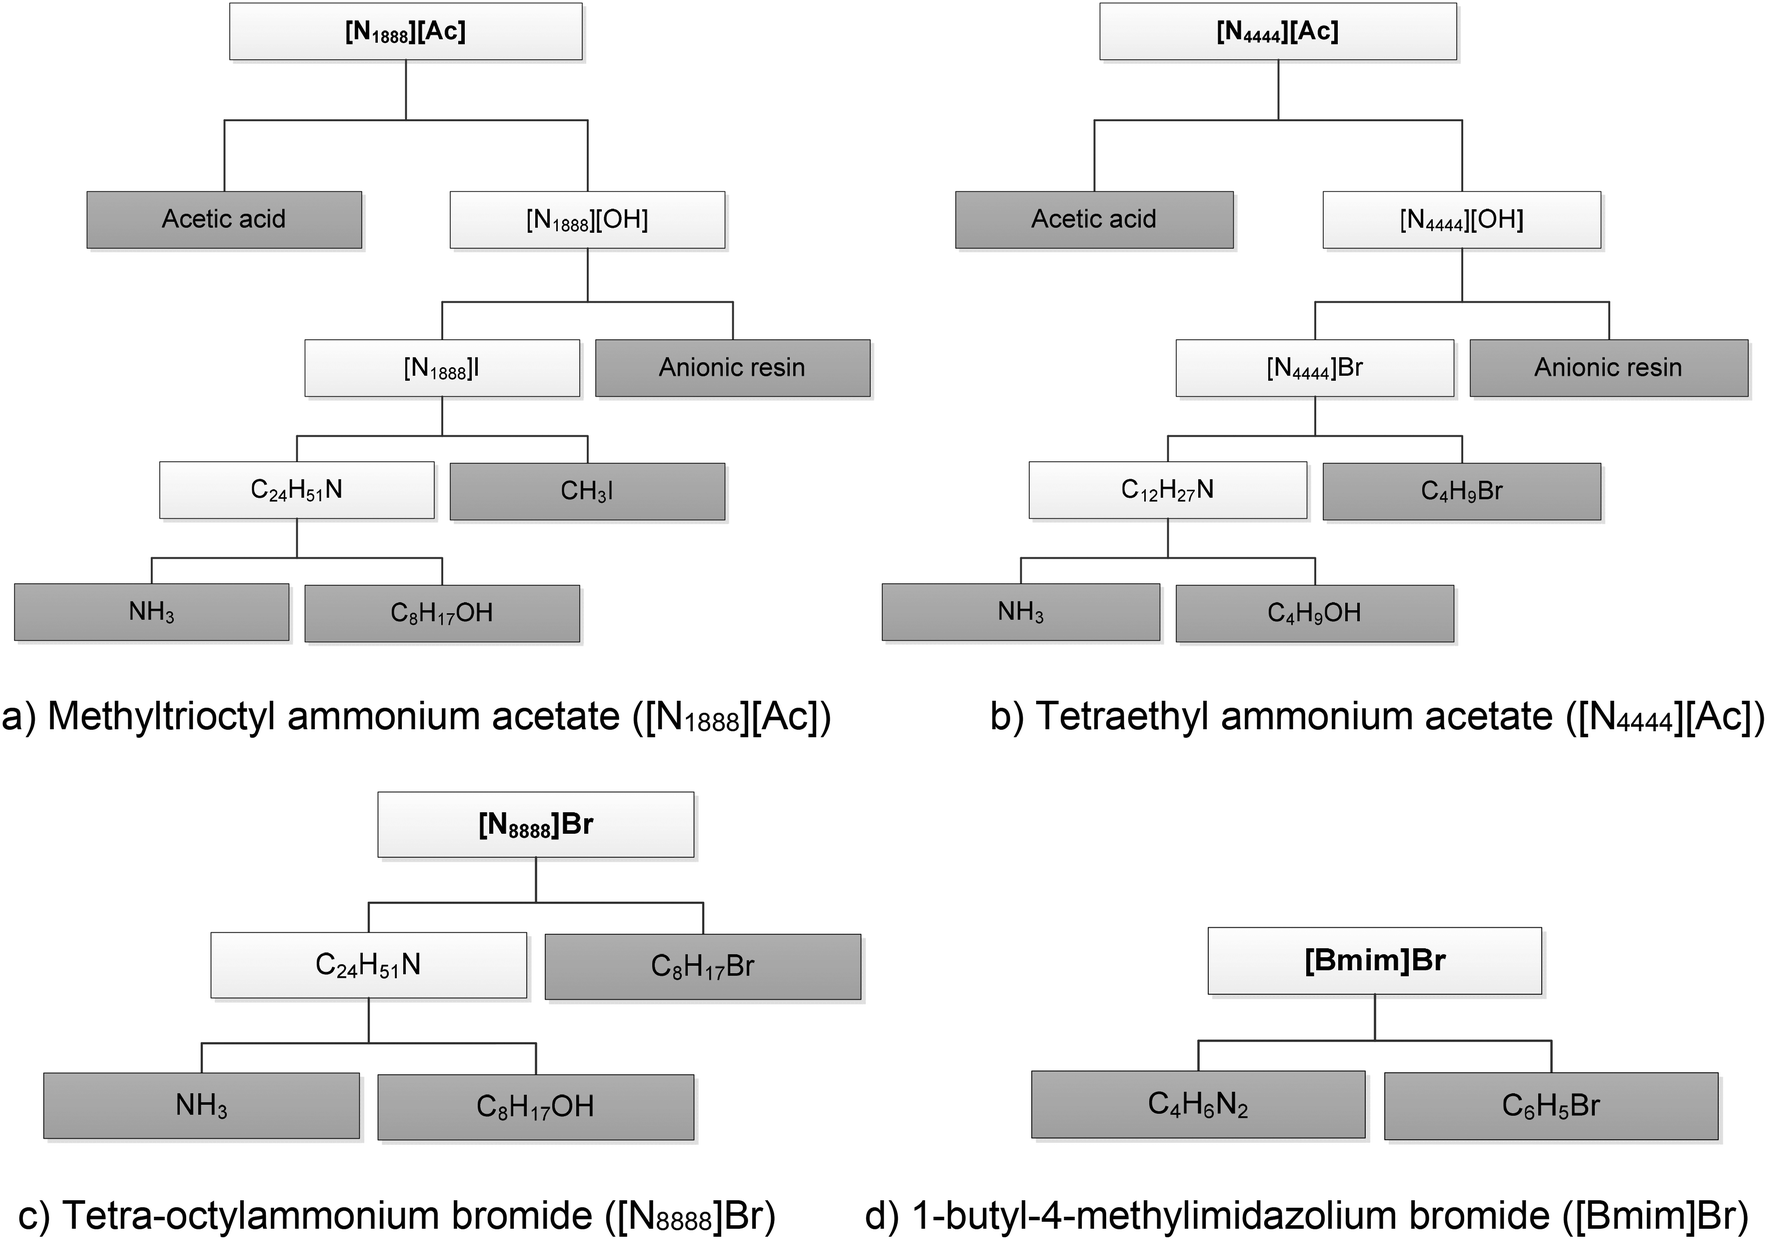 | ||
| Fig. 3 The life cycle tree for the production of SoILs considered in the study. (The dark-shaded boxes indicate the compounds for which data are available in LCA databases.) | ||
2.3 Life cycle assessment of SoILs
The LCA has been carried out in accordance with the guidelines of the ISO 14040/14044 standards,29,30 following the steps in Fig. 1. These are detailed in the next sections.(i) to estimate the life cycle environmental impacts associated with the production of four selected SoILs, both with and without the cellulose support;
(ii) to identify environmental hotspots and opportunities for improvements and guide sustainable development of these sorbents at an early stage of development; and
(iii) to compare their impacts to other CO2 sorbents and identify environmentally the most sustainable options; they are: a room-temperature ionic liquid trihexyltetradecylphosphonium 1,2,4-triazolide ([P66614][124Triz]), monoethanolamine (MEA), zeolite powder and activated carbon.
For the first two goals, the system boundary is from “cradle to gate”, which includes the extraction and manufacture of the raw materials used in the production of the precursors and SoILs, energy generation, transport and process waste management (Fig. 4). The unit of analysis (functional unit) is defined as the ‘production of 1 kg of SoIL’.
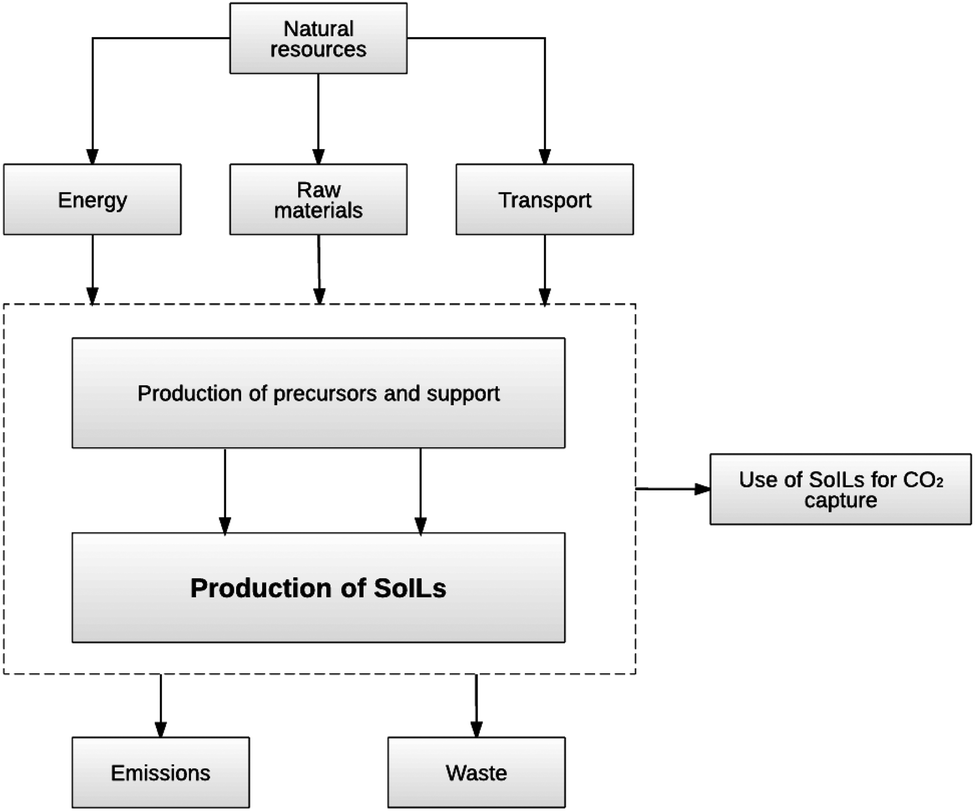 | ||
| Fig. 4 System boundary for the production and use of SoILs. (All other sorbents considered in this study – zeolite, activated carbon, MEA and [P66614][124Triz] – have the same system boundary.) | ||
For the third goal of the study, the use stage of the sorbents is also considered taking into account their adsorption capacities (Fig. 4). The functional unit in this case is ‘adsorption of 1 kg of CO2’. The impacts associated with the re-generation of the sorbents are excluded due to lack of specific data on PSA-SoIL systems. However, the effect of this assumption on the environmental impacts is assessed in the sensitivity analysis in section 3.2.2.4.
| SoIL | Compound | Chemical reactionsa | T (°C) | P (bar) |
|---|---|---|---|---|
| a Bold font in the “Chemical reactions” column represents the chemical formula of the corresponding compound in the “Compound” column. b Adapted from Sauer et al.25 c Adapted from Dharaskar et al.26 | ||||
| Methyltrioctyl ammonium acetate ([N1888][Ac])b | [N1888][Ac] | C25H54NOH + CH3COOH → C27H57NO2 + H2O | 25 | 1 |
| [N1888][OH] | C25H54IN + ṜOH− → C25H54NOH + ṜI− | 25 | 1 | |
| [N1888]I | (C8H17)3N + CH3I → C25H54IN | 75 | 1 | |
| (C8H17)3N | 3C8H17OH + NH3 → (C8H17)3N + 3H2O | 230 | 100 | |
| Tetraethyl ammonium acetate ([N4444][Ac])b | [N4444][Ac] | C16H36NOH + CH3COOH → C18H39NO2 + H2O | 25 | 1 |
| [N4444][OH] | C16H36BrN + ṜOH− → C16H36NOH + ṜBr− | 25 | 1 | |
| [N4444]Br | (C4H9)3N + C4H9Br → C16H36BrN | 75 | 1 | |
| (C4H9)3N | 3C4H9OH + NH3 → (C4H9)3N + 3H2O | 230 | 100 | |
| Tetra-octylammonium bromide ([N8888]Br)b | [N8888][Br] | (C8H17)3N + C8H17Br → C32H68BrN | 75 | 1 |
| 1-Butyl-4-methylimidazolium bromide ([Bmim]Br)c | [Bmim]Br | C4H6N2 + C4H9Br → C8H15BrN2 | 70 | 1 |
| SoIL | Compound | Amount (kg kg−1 SoIL) | |||
|---|---|---|---|---|---|
| Pure | 70% cellulose | 75% cellulose | 80% cellulose | ||
| a Methyl chloride used as a proxy. b Fatty alcohols used as a proxy. c Used as a solvent. d By-product. e Benzimidazole used as a proxy. | |||||
| Methyltrioctyl ammonium acetate ([N1888][Ac]) | Acetic acid | 0.146 | 0.044 | 0.037 | 0.029 |
| Methyl iodidea | 0.333 | 0.100 | 0.083 | 0.067 | |
| 1-Octanolb | 0.913 | 0.274 | 0.228 | 0.183 | |
| Ammonia | 0.040 | 0.012 | 0.010 | 0.008 | |
| Anion exchange resin | 0.034 | 0.010 | 0.009 | 0.007 | |
| Isopropanolc | 0.242 | 0.667 | 0.556 | 0.444 | |
| Waterd | 0.197 | 0.059 | 0.049 | 0.039 | |
| Cellulose | — | 0.700 | 0.750 | 0.800 | |
| Methanolc | — | 0.594 | 0.495 | 0.396 | |
| Tetraethyl ammonium acetate ([N4444][Ac]) | Acetic acid | 0.203 | 0.061 | 0.051 | 0.041 |
| 1-Bromobutanea | 0.455 | 0.137 | 0.114 | 0.091 | |
| 1-Butanol | 0.738 | 0.221 | 0.184 | 0.147 | |
| Ammonia | 0.057 | 0.017 | 0.014 | 0.011 | |
| Anion exchange resin | 0.034 | 0.010 | 0.008 | 0.007 | |
| Waterc | 0.242 | 0.073 | 0.061 | 0.049 | |
| Waterd | 0.352 | 0.106 | 0.088 | 0.070 | |
| Cellulose | — | 0.700 | 0.750 | 0.800 | |
| Methanolc | — | 0.594 | 0.495 | 0.396 | |
| Isopropanolc | — | 0.594 | 0.495 | 0.396 | |
| Tetra-octylammonium bromide ([N8888]Br) | 1-Octanolb | 0.714 | 0.214 | 0.178 | 0.143 |
| Ammonia | 0.031 | 0.009 | 0.008 | 0.006 | |
| 1-Bromooctanea | 0.354 | 0.106 | 0.088 | 0.071 | |
| Cellulose | — | 0.700 | 0.750 | 0.800 | |
| Methanolc | — | 0.594 | 0.495 | 0.396 | |
| Isopropanolc | — | 0.594 | 0.495 | 0.396 | |
| 1-Butyl-4-methylimidazolium bromide ([Bmim]Br) | 1-Methylimidazolee | 0.375 | 0.113 | 0.094 | 0.075 |
| 1-Bromobutanea | 0.625 | 0.188 | 0.156 | 0.125 | |
| Cellulose | — | 0.700 | 0.750 | 0.800 | |
| Methanolc | — | 0.594 | 0.495 | 0.396 | |
| Isopropanolc | — | 0.594 | 0.495 | 0.396 | |
2.3.2.1 Materials. For some of the precursors, the life cycle inventory data were not available in the LCA databases; in such cases, data for alternative chemicals have been used as proxies. Specifically, data for methyl chloride have been used as a proxy for methyl iodide, 1-bromooctane and 1-bromobutane. This is a valid approximation since all these haloalkanes are synthesised by thermal halogenation of the corresponding alkane by radical chain reaction at 300 °C.32 In addition, fatty alcohols have been used instead of 1-octanol since the latter is a type of fatty alcohol. Finally, benzimidazole has been used for 1-methylimidazole since both are derived from imidazole. The effect of these assumptions is tested through a sensitivity analysis in section 3.2.2.
The CO2 adsorption capacities per unit mass of SoILs and pure cellulose are shown in Table 1.
In the absence of real operating data, it is assumed that the sorbent retains its adsorption capacity over 500 cycles, which is in line with a range of novel sorbents for CO2 capture.33,34 The effect of this assumption on the environmental impacts is also assessed in the sensitivity analysis in section 3.2.2.
All raw materials are assumed to be transported over a distance of 100 km to the corresponding production plant. The wastewater generated in the reaction between acetic acid and the quaternary ammonium hydroxide is assumed to be treated as industrial wastewater. The end-of-life disposal of SoILs is not considered due to lack of data. To gauge the effect of this assumption on the environmental impacts, end-of-life disposal is considered in the sensitivity analysis in section 3.2.2.5.
2.3.2.2 Energy. Given that the SoILs are still under development, data on energy consumption are not available and have been estimated as follows:
(i) the heat of formation of reactants and products has been used to estimate the theoretical energy requirements for the production of the SoILs and their precursors;
(ii) only the heat duty of the reactors (heating or cooling) has been considered. This means that the energy for separation, pumping and other operations is excluded from the calculations; the robustness of this assumption is tested in the sensitivity analysis in section 3.2.2; and
(iii) the theoretical duty of the reactors has been scaled up to an industrial scale using the empirical factors found in the literature35 to account for energy efficiencies and losses; the theoretical duties have been multiplied by a factor of 4.2 in the case of exothermic reactions, assuming that natural gas is used as the source of heat, and multiplied by a factor of 3.2 in the case of endothermic reactions, assuming that electricity is used for cooling.35
Table 4 shows the estimated energy requirements by the reactors for the production of 1 kg of SoILs. Details on the calculation of the heat duty of the reactors can be found in section S2 in the ESI.† In all estimates, electricity is assumed to be supplied from the UK grid at medium voltage while heat is assumed to be supplied by steam generated from natural gas.
| SoIL | Compound | Theoretical energy consumption (MJ) | Scaled-up energy consumption (MJ) | Heating/cooling |
|---|---|---|---|---|
| a N/A: not applicable as the anion exchange reaction does not involve heating or cooling. | ||||
| Methyltrioctyl ammonium acetate ([N1888][Ac]) | [N1888][Ac] | 0.199 | 0.837 | Heating |
| [N1888][OH] | N/Aa | N/Aa | N/Aa | |
| [N1888]I | 0.203 | 0.851 | Heating | |
| (C8H17)3N | 0.233 | 0.977 | Heating | |
| Tetraethyl ammonium acetate ([N4444][Ac]) | [N4444][Ac] | 0.412 | 1.729 | Heating |
| [N4444][OH] | N/Aa | N/Aa | N/Aa | |
| [N4444]Br | 0.203 | 0.649 | Cooling | |
| (C4H9)3N | 0.023 | 0.097 | Heating | |
| Tetra-octylammonium bromide ([N8888]Br) | [N8888][Br] | 0.532 | 2.232 | Heating |
| 1-Butyl-4 methylimidazolium bromide ([Bmim]Br) | [Bmim]Br | 0.388 | 1.240 | Cooling |
The energy consumption of PSA systems for CO2 capture has been reported in the range of 331–724 kJ kg−1 CO2,23 depending on the process configuration, gas composition, operating conditions and the type of adsorbent. However, the PSA system is not considered in the study as the energy consumption would be nearly identical across the sorbents. Nevertheless, a sensitivity analysis is included in section 3.2.2.4 to assess the effect of this assumption on the environmental impacts.
3 Results and discussion
3.1 Impact assessment
The LCA software Gabi v6.4![[thin space (1/6-em)]](https://www.rsc.org/images/entities/char_2009.gif) 36 has been used to model the systems and estimate the environmental impacts, following the CML 2001 impact assessment methodology (April 2015 update).37 The CML methodology has been selected to allow comparison with the room-temperature IL [P66614][124Triz] for which LCA data were published previously.24 The following 11 impacts included in the CML method are considered: global warming potential (GWP), abiotic depletion potential for elements (ADP elements), abiotic depletion potential for fossil resources (ADP fossil), acidification potential (AP), eutrophication potential (EP), human toxicity potential (HTP), ozone layer depletion potential (ODP), photochemical oxidants creation potential (POCP), fresh water and marine aquatic ecotoxicity potential (FAETP and MAETP) and terrestrial ecotoxicity potential (TETP).
36 has been used to model the systems and estimate the environmental impacts, following the CML 2001 impact assessment methodology (April 2015 update).37 The CML methodology has been selected to allow comparison with the room-temperature IL [P66614][124Triz] for which LCA data were published previously.24 The following 11 impacts included in the CML method are considered: global warming potential (GWP), abiotic depletion potential for elements (ADP elements), abiotic depletion potential for fossil resources (ADP fossil), acidification potential (AP), eutrophication potential (EP), human toxicity potential (HTP), ozone layer depletion potential (ODP), photochemical oxidants creation potential (POCP), fresh water and marine aquatic ecotoxicity potential (FAETP and MAETP) and terrestrial ecotoxicity potential (TETP).
The results are first discussed for the functional unit related to the production of 1 kg of SoILs, followed by the impacts per 1 kg of CO2 captured.
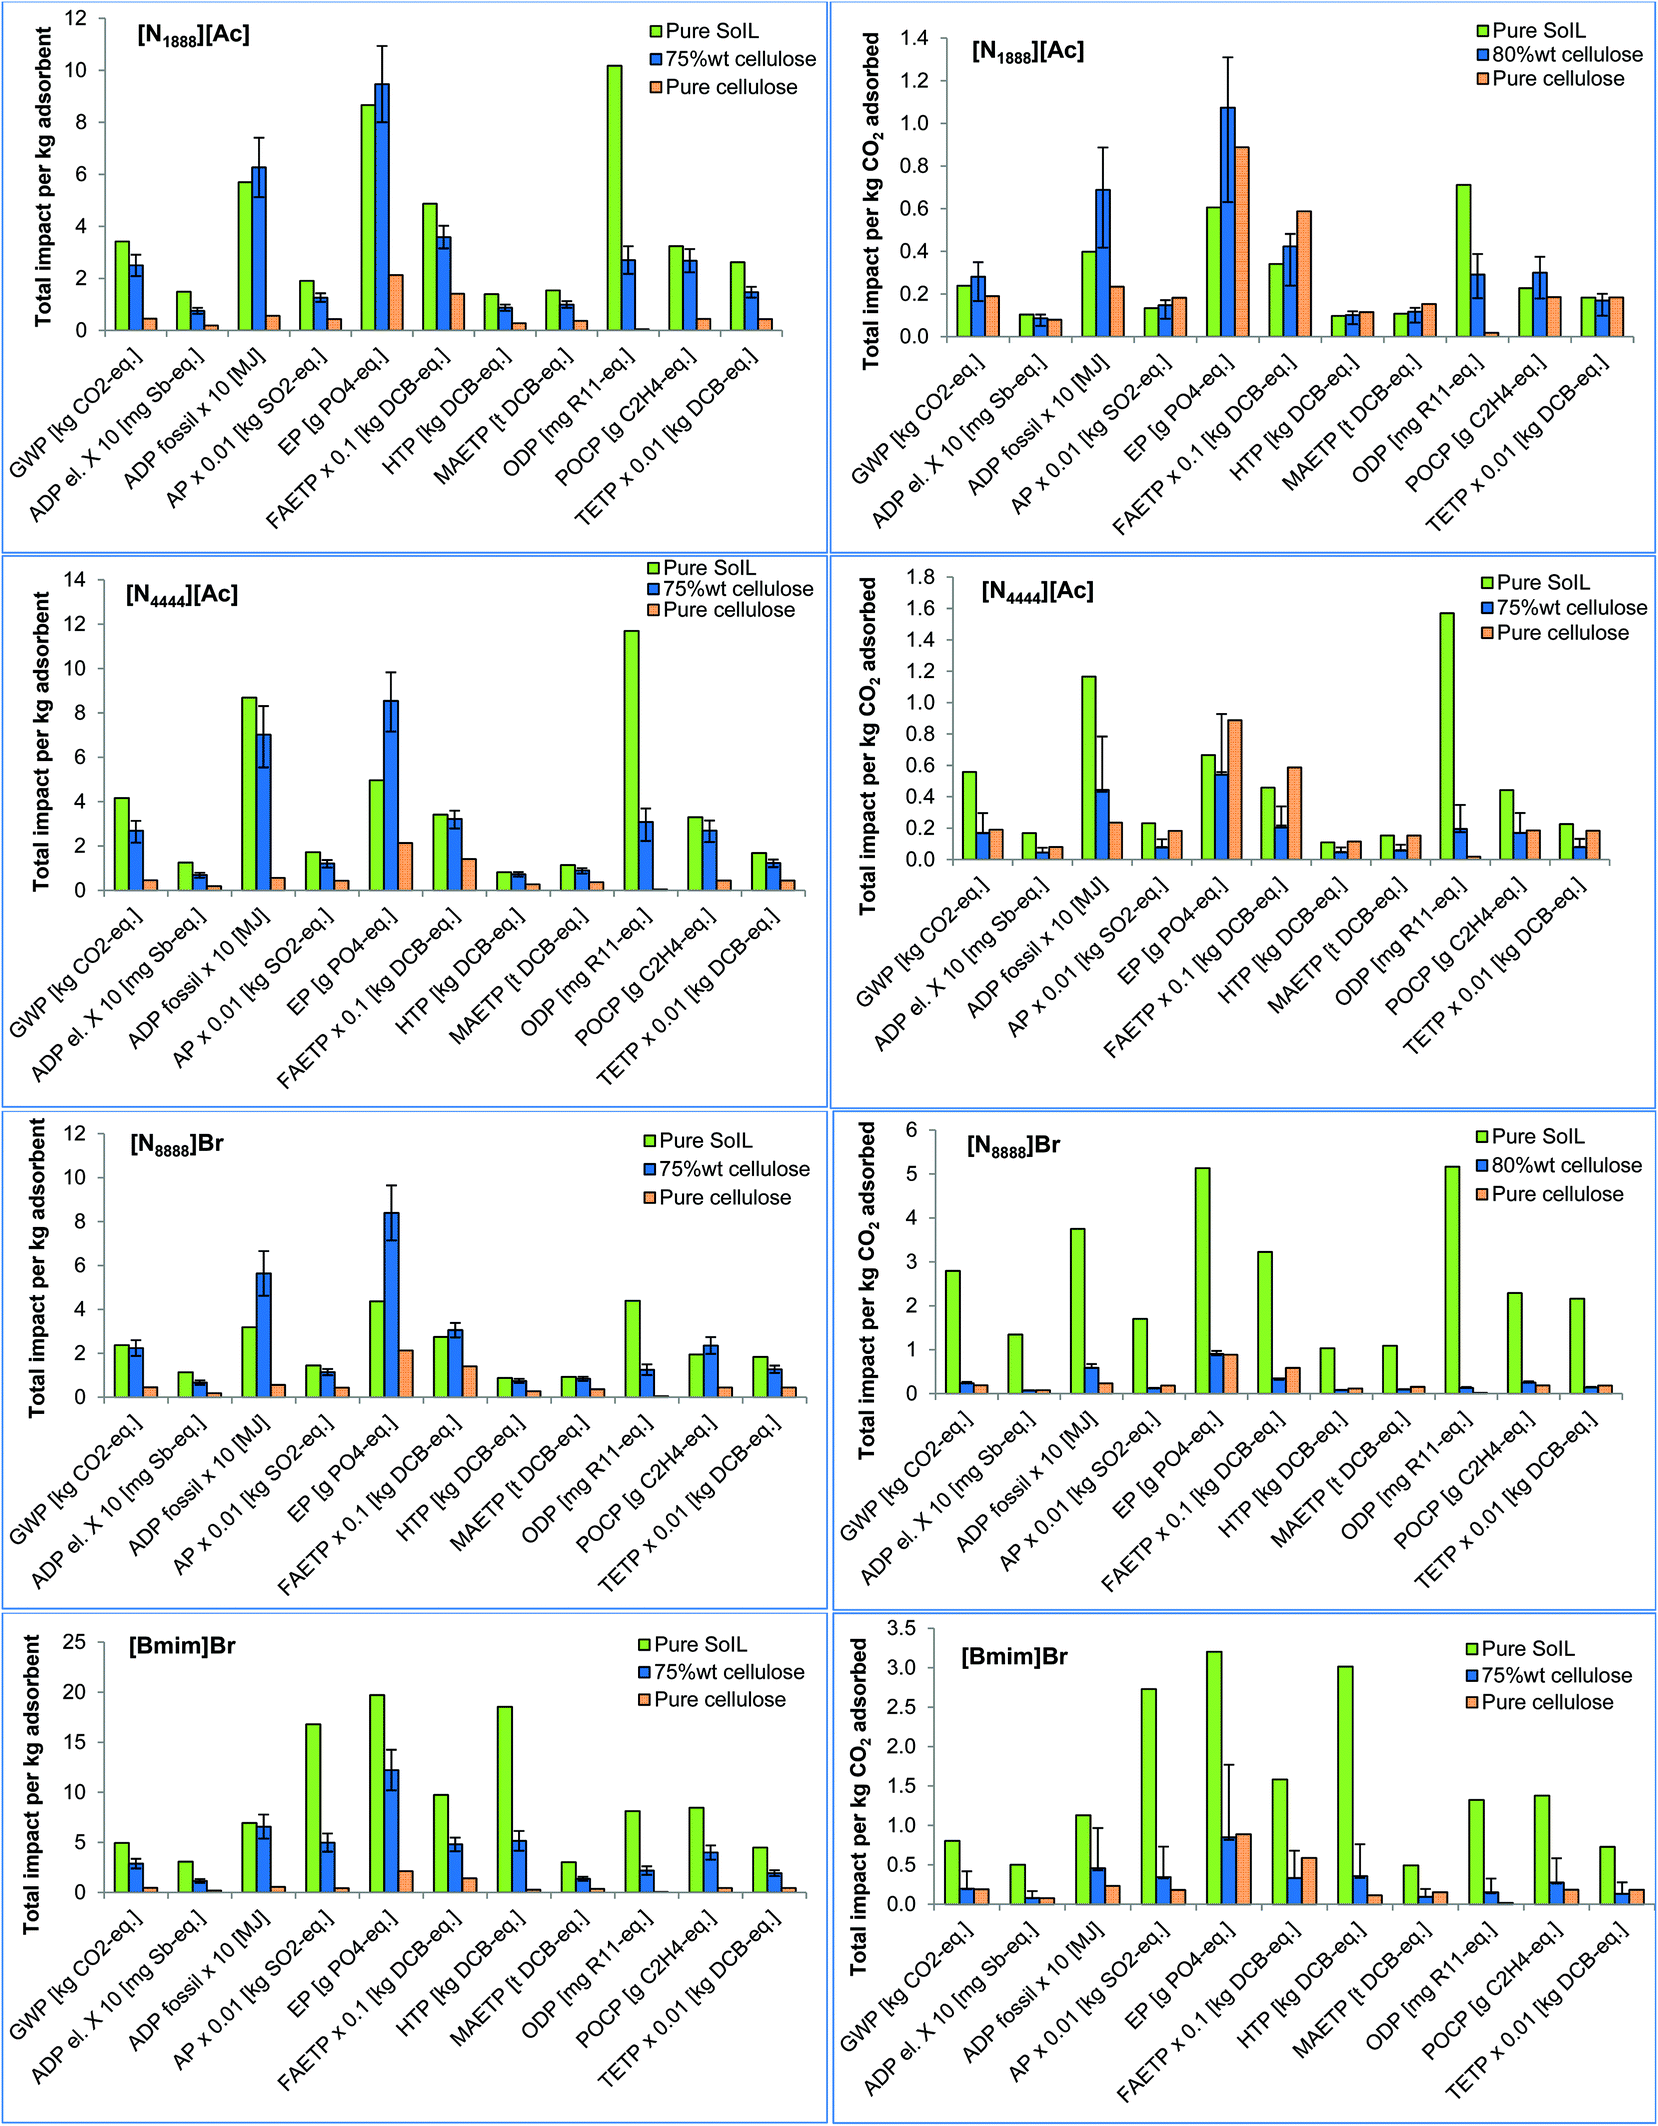 | ||
| Fig. 5 Environmental impacts of pure and cellulose-supported SoILs as a function of cellulose loading: per kg of adsorbent (left) and per kg CO2 adsorbed (right). (For impacts nomenclature, see section 3.1. The error bars represent the 70% (upper limit) and 80% cellulose loading (lower limit), except for [N1888][Ac] and [N8888][Ac], for which the error bars represent 70% (upper limit) and 75% cellulose loading (lower limit). Some impacts have been scaled to fit – to obtain the original values, multiply by the factor shown on the x-axis.) | ||
Comparing the four supported types of SoILs, it can be seen in Fig. 6a that [Bmim]Br has the highest and [N8888]Br the lowest impacts for the vast majority of the categories considered. The difference in impacts between them ranges from 22% for GWP to 86% for HTP in favour of [N8888]Br. The main reason for the poor environmental performance of [Bmim]Br is the use of 1-methylimidazole, which has higher impacts than any other precursor used for any of the other SoILs assessed. The only exceptions to the trends regarding [Bmim]Br are ADP fossil and ODP, which are the highest for [N4444][Ac]. For [N8888]Br, the exceptions are HTP and TETP which are slightly lower for [N4444][Ac]. A similar trend is also found for the pure SoILs (see Fig. S1 in section S3 in the ESI†).
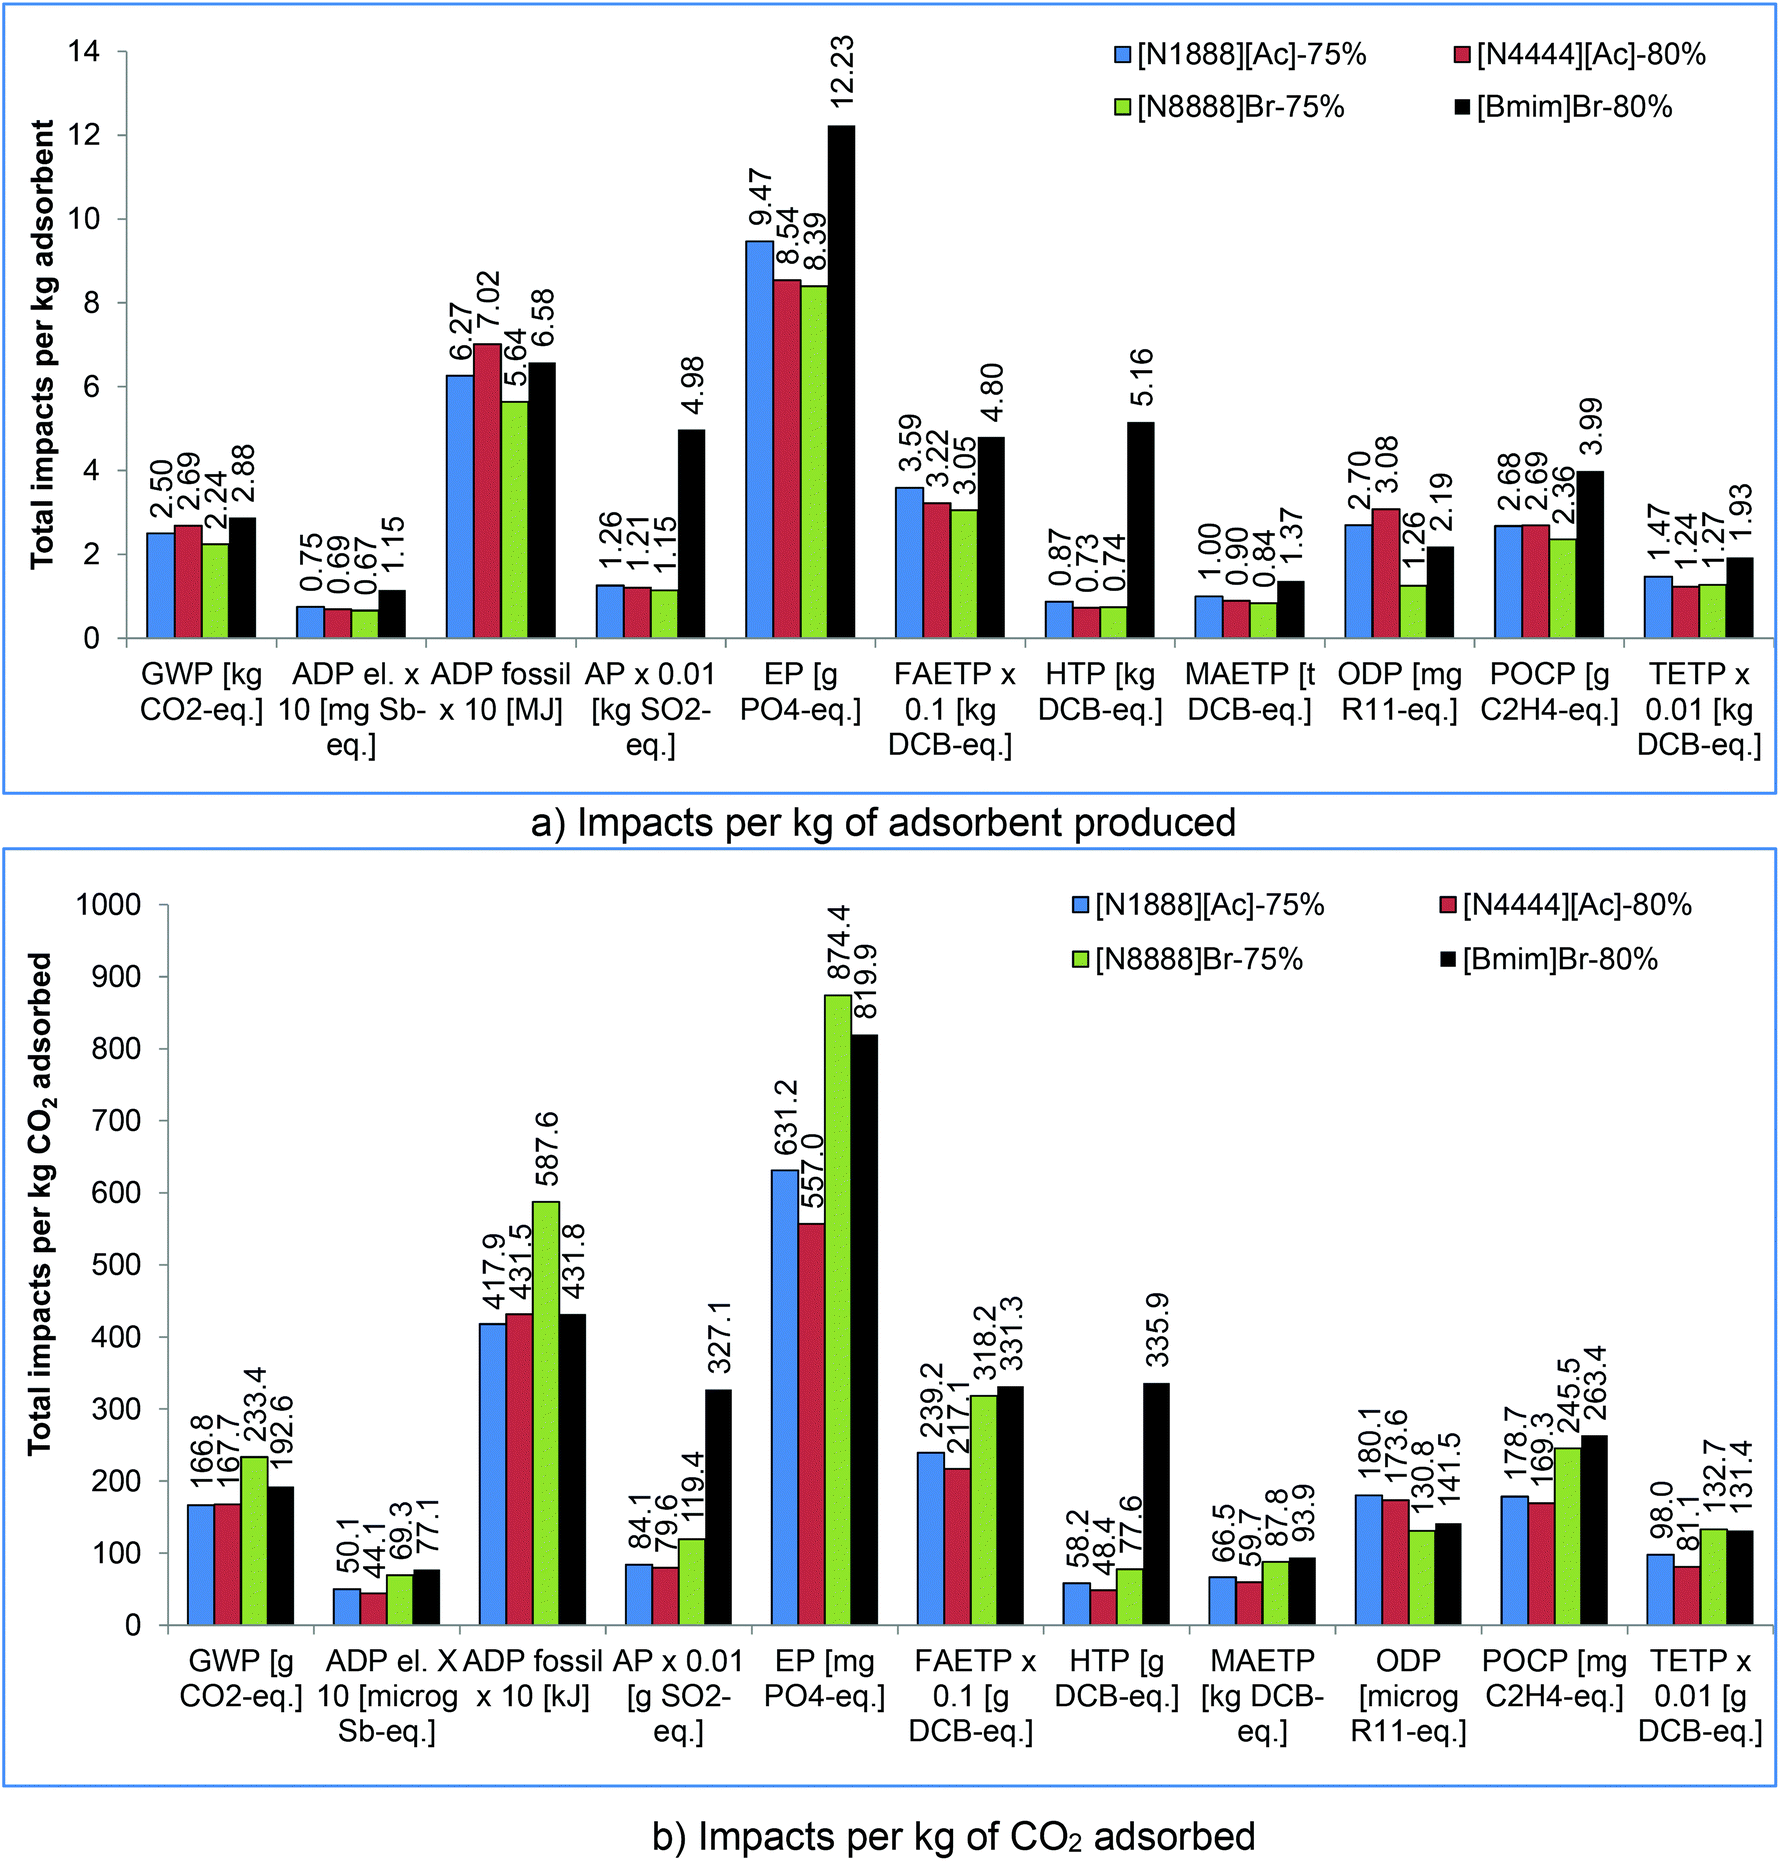 | ||
| Fig. 6 Comparison of the best-performing SoILs for different functional units. (For impacts nomenclature, see section 3.1. Some impacts have been scaled to fit – to obtain the original values, multiply by the factor shown on the x-axis.) | ||
The impacts per kg CO2 adsorbed decrease as the cellulose loading increases for [N4444][Ac] and [Bmim]Br. This is due to the lower impacts of producing the cellulose and also the higher adsorption capacity of the supported SoILs compared to the pure sorbents. As opposed to the impacts per kg of SoIL discussed in section 3.1.1, the relationship between the cellulose loading and a decrease in the impacts is no longer linear. This is due to the competitive effects of the lower impacts of producing the cellulose versus a lower adsorption capacity of the supported SoILs at 80% loading compared to 75%. For [N1888][Ac], the impacts increase at a cellulose loading of 70% due to a decrease in the adsorption capacity at this level of loading. The impacts then decrease when the loading increases to 75% to increase once again for 80% loading. This is the result of the adsorption capacity showing a maximum at 75% cellulose loading, which can be explained by a smoother coating of the IL on the fibrous cellulose particle at this loading level.17 The impacts of [N8888]Br are at a minimum at 75% cellulose loading, even though the highest adsorption capacity is at 70% cellulose loading. This is due to a greater effect of the lower impacts of producing the cellulose versus the slightly lower adsorption capacity at 75% loading.
All the supported sorbents have a net GWP below 1 kg CO2 eq. kg−1 CO2 adsorbed, ranging from 0.167 kg CO2 eq. for [N1888][Ac] to 0.233 kg for [N8888]Br at 75% loading (Fig. 6b). This means that they remove more CO2 eq. than they generate; however, their net carbon removal efficiency is 77%–83%. A similar trend is found for the pure SoILs, but with a lower removal efficiency (20%–76%). The only exception is pure [N8888]Br which generates almost three times more CO2 eq. (2.8 kg) for each kg it removes (Fig. 5).
With respect to the other impacts, [N4444][Ac]-80% is the best option for eight out of 11 categories (Fig. 6b). This is due to its higher adsorption capacity compared to the other SoILs (Table 1). For the remaining three impacts, [N1888][Ac]-75% is the best sorbent for GWP and ADP fossil, while [N8888]Br-75% outperforms the others for ODP.
3.2 Interpretation of results
Isopropanol and methanol for cellulose dissolution are also the main contributors to all the impacts related to [N8888]Br, except for ODP. For instance, they contribute 56%–59% of the total GWP, while cellulose contributes 15% of the impact. 1-Methylbromide is the main hotspot for ODP with a contribution of 84% of the total ODP. For [Bmim]Br, the main contributors are again isopropanol and methanol for cellulose dissolution. For instance, they contribute 42%–44% of the GWP and over 60% of the toxicity-related impacts. 1-Methylimidazole is also an important hotspot since it causes 25% of the GWP and over 30% of all other impacts but ADP fossil and ODP.
Although energy required for heating/cooling of the reactors is the second largest contributor to the impacts from the SoILs, its share is significantly smaller than that of the raw materials. As an example, energy contributes 4%–6% of the GWP across the SoIL types. The contribution of transport and wastewater treatment is negligible, with the shares of <1% and 0.01%, respectively.
Therefore, the hotspot analysis suggests that the main opportunities for improvements are related to reducing the impacts associated with the SoIL precursors. This can be achieved by replacing them with other precursors with lower environmental impacts or developing alternative synthesis routes. Fatty alcohols, such as 1-octanol used in the synthesis of trioctylamine (a precursor to [N1888][Ac] and [N8888]Br), are significant contributors to most environmental impacts. Therefore, they should be replaced by alcohols from biosources, such as coconut oil. For example, the latter has the GWP of 1.41 kg CO2 eq. kg−1 compared to 2.56 kg CO2 eq. kg−1 of alcohol from petrochemical origin.31 Furthermore, the use of SoILs that involve imidazole-derived precursors, as in the case of [Bmim]Br, should be avoided because of their high environmental impacts, including GWP (7.52 kg CO2 eq. kg−1 (ref. 31)). Furthermore, using anion resins that do not rely on trichloromethane could reduce the ODP.
(i) use of proxy data for some raw materials (Table 3);
(ii) estimates of energy consumption for SoIL synthesis (Table 4);
(iii) the number of adsorption/desorption cycles;
(iv) electricity consumption by the PSA unit; and
(v) the end-of-life disposal of the spent SoILs.
3.2.2.1 The effect of proxy data for raw materials. As discussed in section 2.3.2.1, alternative chemicals have been used as proxies for those compounds for which life cycle inventory data are not available. The effect of this assumption is tested by varying the impacts of these materials (arbitrarily) by ±50%. As the raw materials are relevant to the production rather than the use of the sorbents, the analysis is carried out for the functional unit related to the production of 1 kg of the SoILs. The results for 75% cellulose loading are given in Fig. 7 and for the other two loadings in Fig. S2 and S3 in the ESI.† For instance, a 50% increase in the impacts of the proxy raw materials assumed to be used in the production of SoILs with 75% cellulose results in an average increase in the GWP of 13%. Similar trends are found for the other impacts across the SoIL types, except for [Bmim]Br which shows a greater sensitivity to the assumptions for the raw materials (Fig. 7). For example, a 50% higher GWP of the proxy raw materials leads to a 20% increase in the overall GWP of [Bmim]Br, whereas for the other three SoILs the increase ranges from 6% to 12%. This is due to the higher environmental impacts of benzimidazole, which is used as a proxy for 1-methylimidazole (Table 3). Similar trends are observed for 70% and 80% cellulose loadings (Fig. S2 and S3†).
 | ||
| Fig. 7 Sensitivity analysis for the assumptions on the raw materials used in the production of the SoILs with 75% cellulose loading. (The graph bars represent the impacts in the base case and the error bars the impacts for the ± variation in impacts of the proxy raw materials. For impacts nomenclature, see section 3.1. Some impacts have been scaled to fit – to obtain the original values, multiply by the factor shown on the x-axis.) | ||
3.2.2.2 The effect of energy consumption for SoIL synthesis. As discussed in section 2.3.2.2, energy consumption by the reactor to produce the SoILs had to be estimated due to lack of data. Here, these estimates are varied by ±50% to gauge the effect on the overall impacts per kg of sorbent produced. As can be seen in Fig. S4 in the ESI† for the SoILs with 75% cellulose loading, the impacts are not sensitive to these changes. For example, a 50% increase in the energy consumption results in an average increase of 0.8% of the GWP across the SoILs. A similar trend applies for the other impacts.
3.2.2.3 The effect of adsorption/desorption cycles. The number of adsorption/desorption cycles is varied from 100–1000 in the sensitivity analysis, from 500 considered in the base case. It is assumed that the adsorption capacity of the sorbents remains constant in all cycles. Given that this analysis is related to the use of the sorbents, the functional unit is related to 1 kg of adsorbed CO2. An example effect on the impacts is shown in Fig. 8 for GWP for the best-performing SoILs and for pure sorbents. Note that the values for GWP of the supported [N4444][Ac] and [N1888][Ac] are the same and cannot be differentiated as shown in Fig. 8 (left); the same applies to the supported [Bmim]Br and pure cellulose. As can be seen, the GWP decreases exponentially as the number of cycles increases for both supported and unsupported SoILs. This is due to a longer lifespan of the sorbents and the higher overall amount of CO2 captured during their lifetime. For these optimal levels of cellulose loading, pure SoILs have higher GWP than the supported SoILs across the range of cycles.
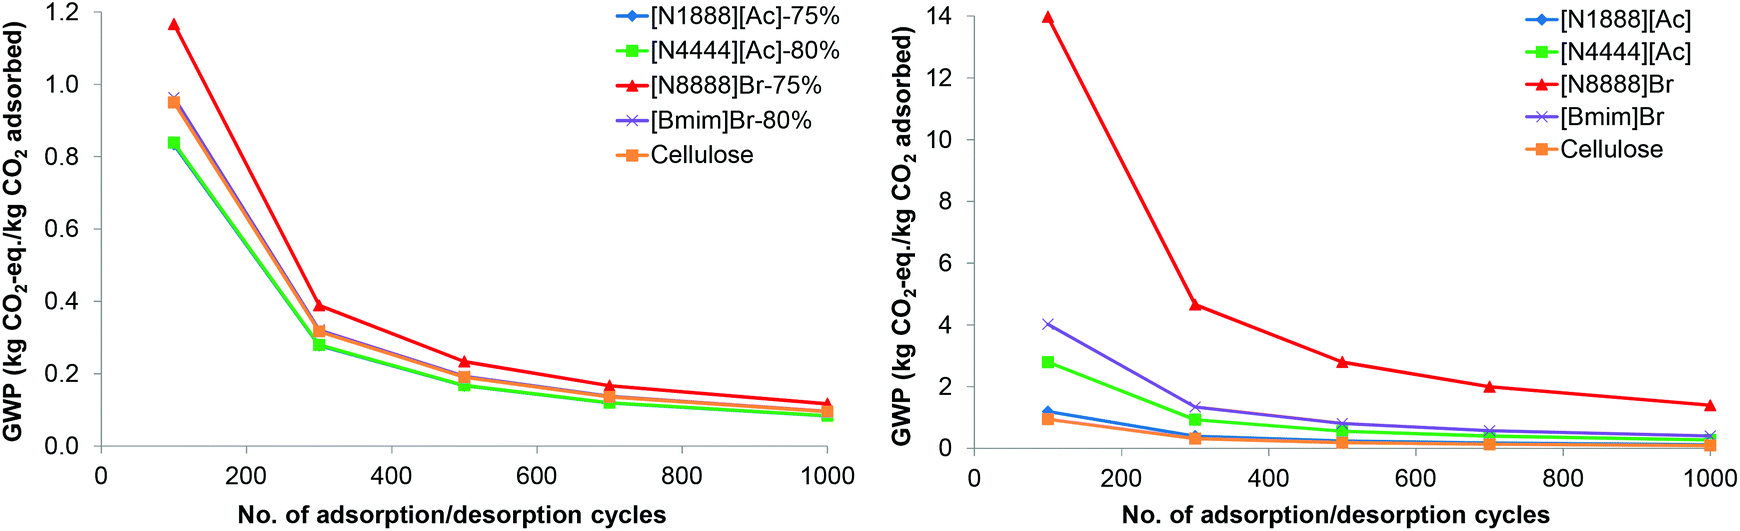 | ||
| Fig. 8 Effect of the adsorption/desorption cycles on global warming potential (GWP) of the best-performing SoILs with cellulose (left) and pure SoILs (right). (75% and 80% in the legend denote the level of cellulose loading. Pure cellulose is also shown on both graphs for context.) | ||
These results can also be used to determine the number of cycles over which a SoIL will need to retain its adsorption capacity to outperform other sorbents, including the cellulose. For instance, [N8888]Br-75% will outperform pure cellulose if it can be used in more than 200 cycles if cellulose lasts for only 100 cycles. For the same number of cycles, [N1888][Ac]-75% outperforms the rest of the supported sorbents and the cellulose. Nevertheless, its GWP remains net positive across the adsorption cycles, but it halves from 0.167 to 0.083 kg CO2 eq. kg−1 CO2 adsorbed as the number of cycles doubles from 500 to 1000. The other impacts are also similarly sensitive to the number of adsorption/desorption cycles.
3.2.2.4 The effect of electricity consumption by the PSA unit. Electricity consumption by the PSA unit has not been considered in the base case due to lack of data. The effect of this assumption is tested here by comparing the impacts in the base case with a low and high PSA energy consumption (331 and 724 kJ kg−1 CO2 adsorbed, respectively) reported in the literature.23 It can be seen in Fig. 9 that most impacts are unaffected or increase only slightly when the PSA electricity is considered. The exception to this is GWP, which is 20%–66% higher across the SoILs. ADP fossil and AP also increase, by 11%–33% and 7%–49%, respectively. However, the environmental ranking of the SoILs remains the same as in the base case.
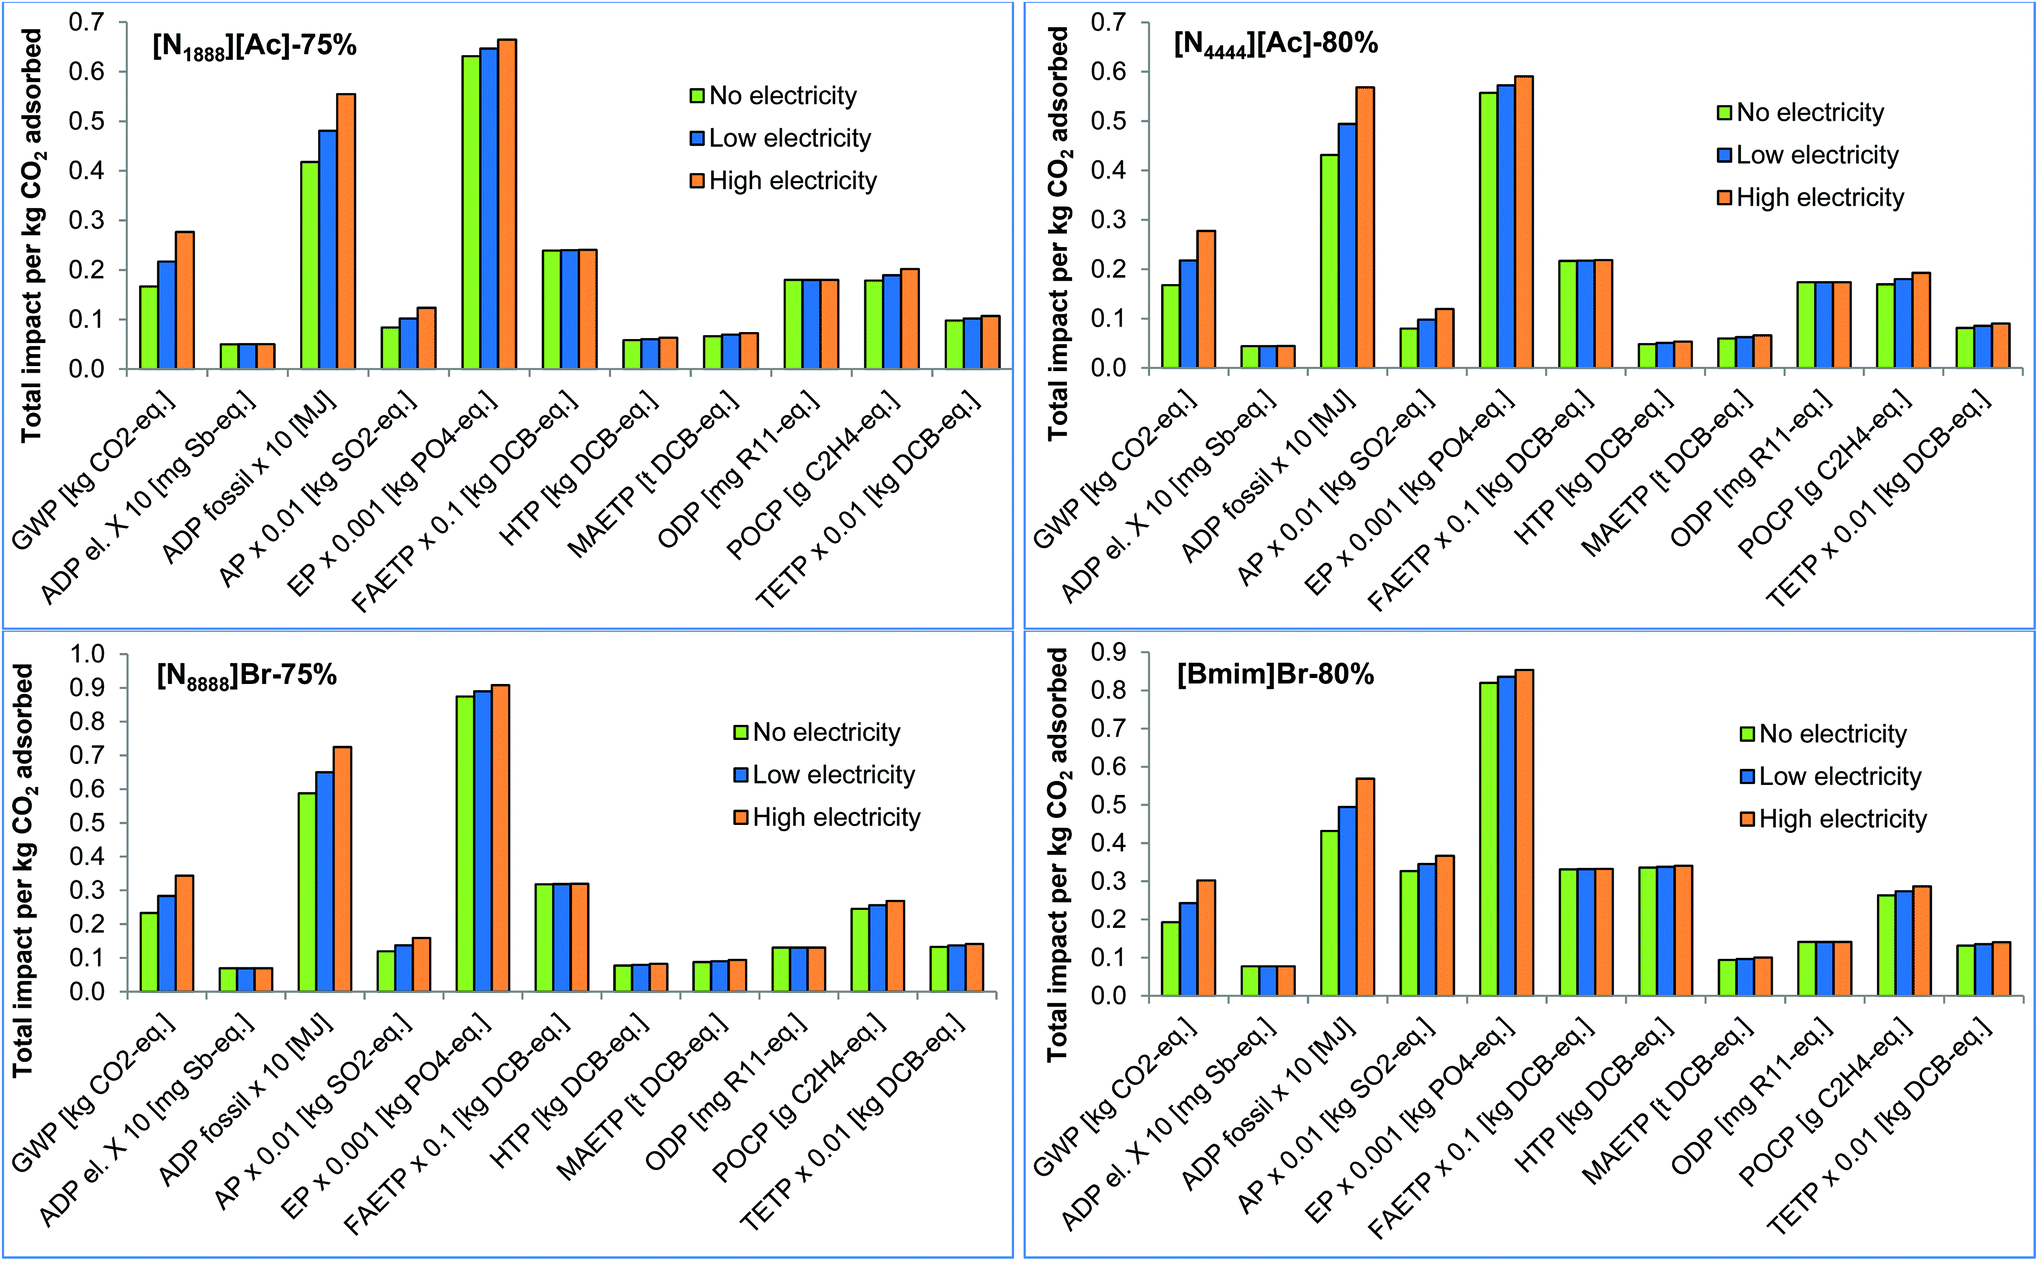 | ||
| Fig. 9 Effect of energy consumption by the PSA unit on the impacts of SoILs. (The low and high electricity consumption correspond to 331 and 724 kJ kg−1 CO2 adsorbed, respectively. For impacts nomenclature, see section 3.1.) | ||
3.2.2.5 The effect of end-of-life disposal of the spent SoILs. End-of-life disposal of the SoILs has not been considered in the base case due to lack of data. To find out if this exclusion would affect the overall impacts, it is assumed in the sensitivity analysis that the SoILs are landfilled as hazardous materials. The results in Fig. 10 suggest that in that case the effect on most impacts is negligible, except for FAETP and MAETP which increase respectively by 17%–25% and 14%–22% across the SoILs. HTP also increases by 10%–15% with the exception of [Bmim]Br-80%, where it increases only by 2%. Given a similar effect on the impacts of the SoILs’ end-of-life, their ranking in terms of the environmental performance remains the same as in the base case.
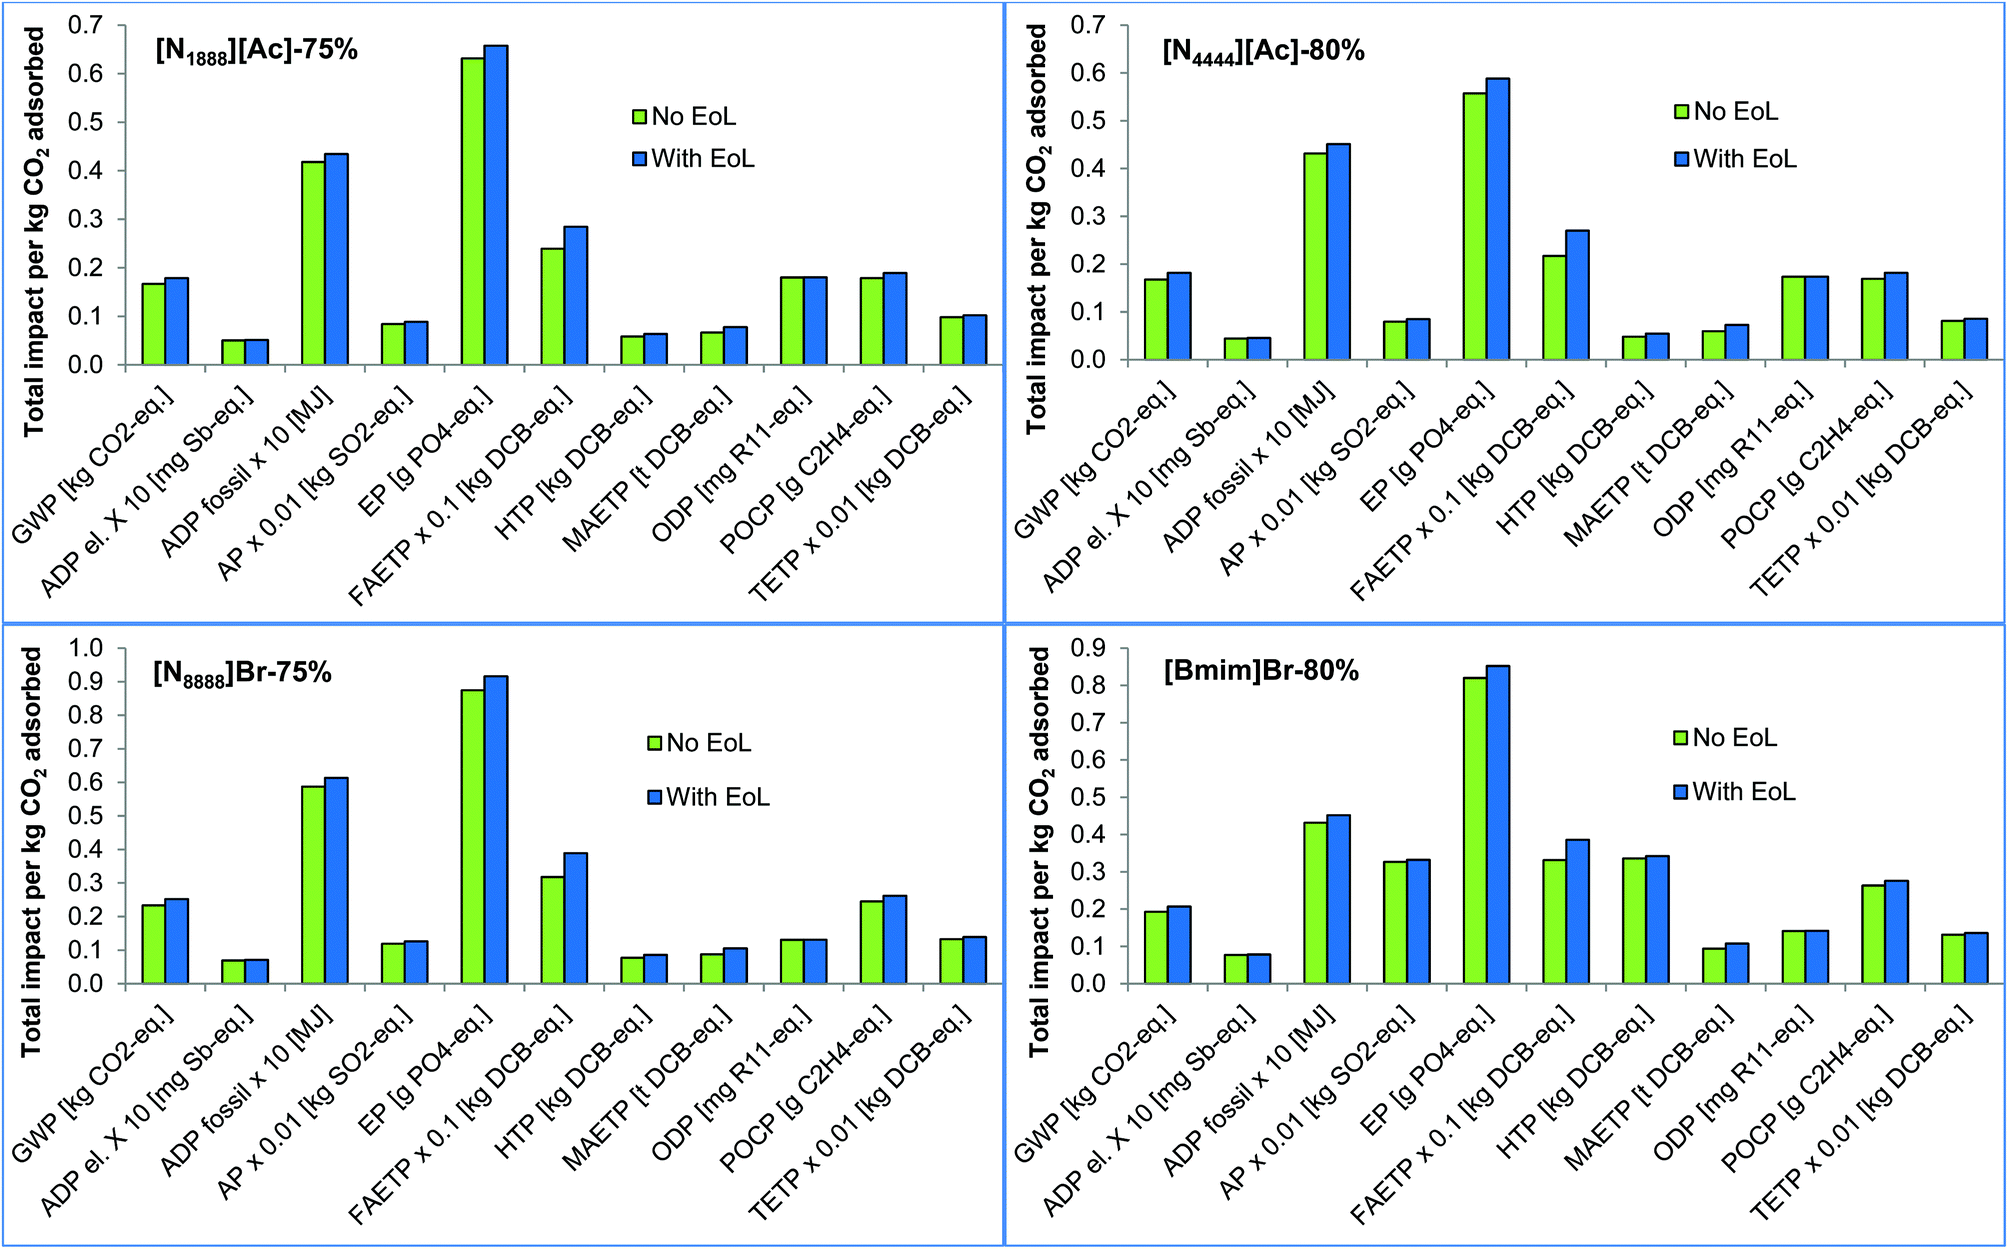 | ||
| Fig. 10 Effect of end-of-life disposal on the impacts of SoILs. (For impacts nomenclature, see section 3.1. EoL: end of life.) | ||
| Adsorbent type | Adsorbent name | Adsorption capacity (kg CO2 kg−1 adsorbent) | Source |
|---|---|---|---|
| a 298 K and 1 bar. b 298 K and 30 bar. | |||
| Activated carbon | Norit R1 | 0.440 | Himeno et al.44 |
| BPL | 0.334 | ∼II∼ | |
| A10 | 0.378 | ∼II∼ | |
| AC A | 0.334 | ∼II∼ | |
| Zeolite | Zeolite 13X | 0.220 | Zhang et al.45 |
| Zeolite 13X | 0.308 | Cavenati et al.46 | |
| Amine | MEA | 0.295 | Sønderby et al.47 |
| Room-temp. IL | [P66614][124Triz] | 0.081a | Taylor et al.38 |
| SoIL | [N4444][Ac]-80% cellulose | 0.026b | Reed et al.17 |
The LCA impacts of both MEA and [P66614][124Triz] per kg of CO2 captured have been sourced from Cuéllar-Franca et al.24 The environmental impacts of the zeolite powder are from the ecoinvent database and the data for the activated carbon are from Bayer et al.42 The activated carbon is assumed to be produced from coal, which is the most prevalent feedstock for activated carbon in industry.43 It is assumed that 99.997% of MEA and [P66614][124Triz] is recycled in the process after regeneration.24 The SoILs, zeolite and activated carbon are assumed to undergo 500 adsorption/desorption cycles with their respective adsorption capacities remaining constant over their lifetime. The effect of the number of adsorption cycles on the impacts is explored further below.
The environmental impacts of these four sorbents are compared in Fig. 11 with [N4444][Ac]-80% per kg of CO2 adsorbed. This SoIL is considered for comparison because it has the lowest impacts of all the SoILs considered in eight out of 11 categories.
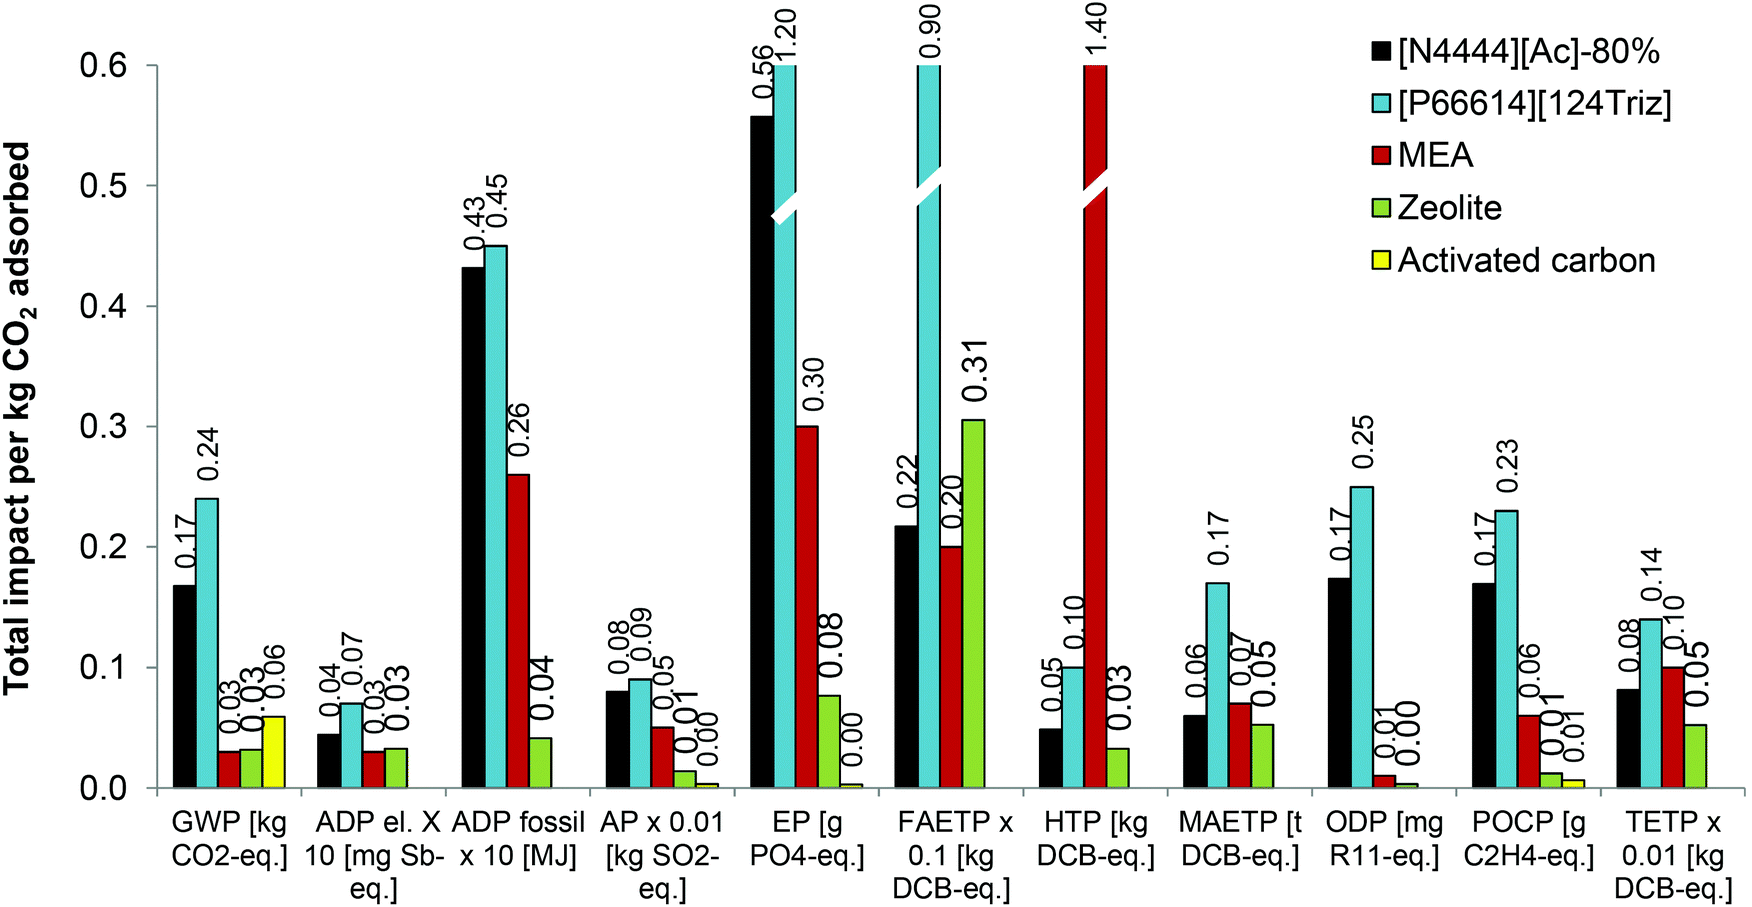 | ||
| Fig. 11 Comparison of environmental impacts of different sorbents. (Assumptions: 99.997% regeneration of MEA and [P66614][124Triz] and 500 adsorption/desorption cycles for [N4444][Ac]-80%, zeolite and activated carbon. For impacts nomenclature, see section 3.1.) | ||
The results suggest that, compared to [P66614][124Triz], [N4444][Ac]-80% has lower impacts for all the categories, ranging from 4% lower ADP fossil to 76% lower FAETP. In comparison with MEA, [N4444][Ac]-80% has higher impacts, except for HTP, MAETP and TETP, which are 97%, 15% and 19% lower than for MEA, respectively. The rest of its impacts are between 9% (FAETP) and 17 times higher (ODP) than for MEA.
Compared with zeolite powder, [N4444][Ac]-80% is a worse option for 10 out of 11 impacts, ranging from 14% higher MAETP to 55 times greater ODP. The latter is particularly high for [N4444][Ac]-80% owing to the trichloromethane used in the preparation of the anionic resin as well as the methyl iodide used as a precursor in the synthesis of [N4444][Ac]. On the other hand, [N4444][Ac]-80% has lower FAETP than zeolite.
[N4444][Ac]-80% is also less environmentally sustainable than activated carbon for all four impacts available for the latter: it has three times higher GWP, 25 times greater AP, 26 times higher POCP and 199 times greater EP (Fig. 11). The reason for a particularly high EP is the phosphoric acid diatomite used as a catalyst in the production of isopropanol via the direct hydration of propene. Since large amounts of isopropanol are needed to dissolve the cellulose, its effect on EP is exacerbated.
The effect of the number of adsorption/desorption cycles on the impacts is shown in Fig. 12 through the example of GWP. As can be seen, [N4444][Ac]-80% has a higher GWP than activated carbon and zeolite powder for the same number of cycles. However, it has a lower GWP than activated carbon as long as it retains its adsorption capacity for at least 300 cycles and the activated carbon for 100 cycles. Alternatively, the SoIL would have to retain its adsorption capacity for at least 500 cycles in order to outperform zeolite powder if the latter only lasts for 100 cycles. Fig. 12 also shows that [N4444][Ac]-80% has higher GWP than MEA across the number of cycles considered.
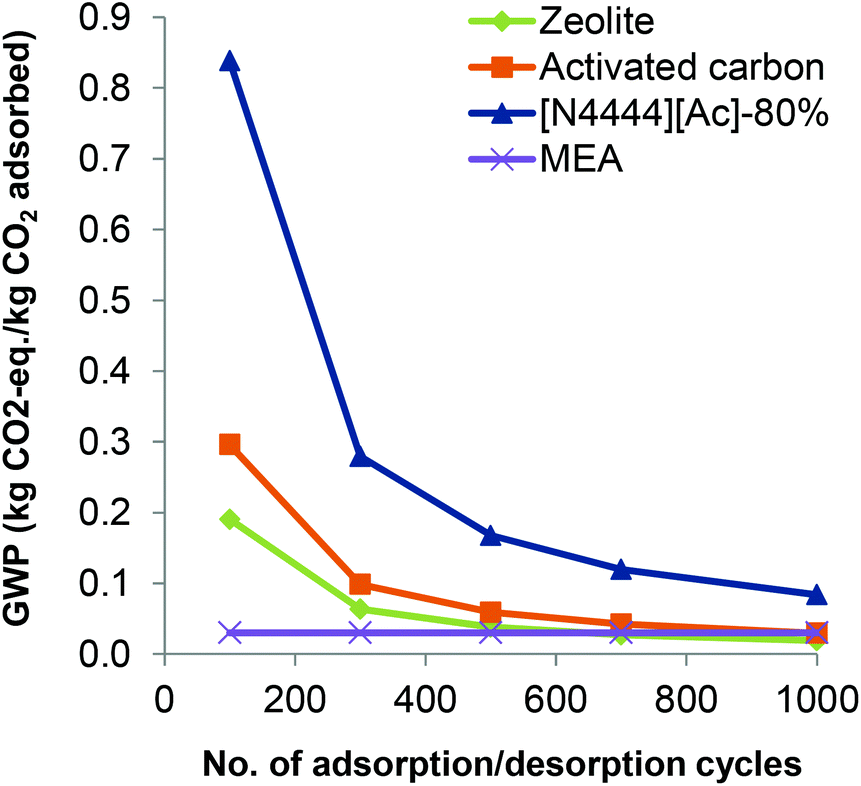 | ||
| Fig. 12 Effect of adsorption/desorption cycles on the global warming potential (GWP) of [N4444][Ac]-80%, activated carbon and zeolite powder. | ||
4 Conclusions
This work has estimated for the first time the life cycle environmental impacts of four novel cellulose-supported SoILs in comparison with their pure counterparts and some conventional CO2 sorbents, such as MEA, zeolite and activated carbon. The results indicate that the supported SoILs have lower impacts per kg CO2 adsorbed than pure SoILs in all the impact categories. The only exception is [N1888][Ac]-80% which has higher impacts than the pure sorbent across the categories, except for ADP elements, ODP and TETP. For all four SoILs, raw materials are the main contributors to environmental impacts.All the supported SoILs have a net GWP below 1 kg CO2 eq. kg−1 CO2 captured, meaning that they remove more CO2 eq. than they generate. However, their net carbon removal efficiency is 77%–83%. A similar trend is found for the pure SoILs, but with a lower removal efficiency of 20%–76%. The only exception is pure [N8888]Br which generates almost three times more CO2 eq. for each kg it removes.
[N4444][Ac]-80% is the best SoIL for eight out of 11 impact categories. For the remaining three impacts, [N1888][Ac]-75% is the best sorbent for GWP and ADP fossil, while [N8888]Br-75% outperforms the others for ODP.
In comparison to other CO2 sorbents, the best supported SoIL – [N4444][Ac]-80% – is environmentally more sustainable than [P66614][124Triz] but it has significantly higher impacts than MEA, zeolite and activated carbon.
The results presented in this work can guide the further development of environmentally more sustainable solid ionic liquids for CO2 capture. However, real data on the adsorbent recyclability, operating conditions and unit operations involved in the CO2 capture by SoILs will be required to determine whether such processes can be environmentally more sustainable than those using conventional sorbents, such as activated carbon, zeolites or MEA. Furthermore, as SoILs have a low CO2 adsorption capacity, future studies should also evaluate the economic sustainability of their potential commercial application.
Conflicts of interest
There are no conflicts of interest to declare.Acknowledgements
This work was carried out as part of the “4CU” programme Grant aimed at sustainable conversion of carbon dioxide into fuels, led by The University of Sheffield and carried out in collaboration with The University of Manchester, Queen's University Belfast and University College London. The authors acknowledge gratefully the UK Engineering and Physical Sciences Research Council (EPSRC) for supporting this work financially (Grant No. 608 EP/K001329/1).References
- European Academies Science Advisory Council, Carbon capture and storage in Europe, German National Academy of Sciences Leopoldina, Halle (Saale), Germany, 2013 Search PubMed.
- J. D. Figueroa, T. Fout, S. Plasynski, H. McIlvried and R. D. Srivastava, Int. J. Greenhouse Gas Control, 2008, 2, 9–20 CrossRef CAS.
- P. Styring, D. Jansen, H. de Coninck, H. Reith and K. Amstrong, Carbon Capture and Utilisation in the Green Economy, The Centre for Low Carbon Futures, Yotk, 2011 Search PubMed.
- R. J. Notz, I. Tönnies, N. McCann, G. Scheffknecht and H. Hasse, Chem. Eng. Technol., 2011, 34, 163–172 CrossRef CAS.
- E. S. Rubin, H. Mantripragada, A. Marks, P. Versteeg and J. Kitchin, Prog. Energy Combust. Sci., 2012, 38, 630–671 CrossRef CAS.
- L. Zhu, G. W. Schade and C. J. Nielsen, Environ. Sci. Technol., 2013, 47, 14306–14314 CrossRef CAS.
- G. R. M. Dowson, D. G. Reed, J.-M. Bellas, C. Charalambous and P. Styring, Faraday Discuss., 2016, 192, 511–527 RSC.
- M. R. M. Abu-zahra, P. H. M. Feron and G. F. Versteeg, Int. J. Greenhouse Gas Control, 2007, 1, 37–46 CrossRef CAS.
- J. Kittel, R. Idem, D. Gelowitz, P. Tontiwachwuthikul, G. Parrain and A. Bonneau, Energy Procedia, 2009, 1, 791–797 CrossRef CAS.
- X. Zhang, X. Zhang, H. Dong, Z. Zhao, S. Zhang and Y. Huang, Energy Environ. Sci., 2012, 5, 6668 RSC.
- J. S. Wilkes, P. Wasserscheid and T. Welton, in Ionic Liquids in Synthesis, Wiley-VCH Verlag GmbH & Co. KGaA, Weinheim, Germany, 2007, pp. 1–6 Search PubMed.
- J. F. Brennecke and B. E. Gurkan, J. Phys. Chem. Lett., 2010, 1, 3459–3464 CrossRef CAS.
- R. G. Reddy, J. Phys.: Conf. Ser., 2009, 165, 012076 CrossRef.
- C. Maton, N. De Vos and C. V. Stevens, Chem. Soc. Rev., 2013, 42, 5963 RSC.
- B. Lee and S. Lin, Chem. Eng. Sci., 2015, 121, 157–168 CrossRef CAS.
- C. Moya, J. Palomar, M. Gonzalez-Miquel, J. Bedia and F. Rodriguez, Ind. Eng. Chem. Res., 2014, 53, 13782–13789 CrossRef CAS.
- D. G. Reed, G. R. M. Dowson and P. Styring, Front. Energy Res., 2017, 5, 13 CrossRef.
- D. R. MacFarlane, M. Forsyth, P. C. Howlett, M. Kar, S. Passerini, J. M. Pringle, H. Ohno, M. Watanabe, F. Yan, W. Zheng, S. Zhang and J. Zhang, Nat. Rev. Mater., 2016, 1, 15005 CrossRef CAS.
- J. Wang, L. Huang, R. Yang, Z. Zhang, J. Wu, Y. Gao, Q. Wang, D. O'Hare and Z. Zhong, Energy Environ. Sci., 2014, 7, 3478–3518 RSC.
- S. Zeng, X. Zhang, L. Bai, X. Zhang, H. Wang, J. Wang, D. Bao, M. Li, X. Liu and S. Zhang, Chem. Rev., 2017, 117, 9625–9673 CrossRef CAS.
- F. L. Bernard, L. M. dos Santos, M. B. Schwab, B. B. Polesso, J. F. do Nascimento and S. Einloft, J. Appl. Polym. Sci., 2019, 136, 47536 CrossRef.
- Linde, The Linde Group, http://www.linde-engineering.com/.
- L. Riboldi and O. Bolland, Energy Procedia, 2017, 114, 2390–2400 CrossRef CAS.
- R. M. Cuéllar-Franca, P. García-Gutiérrez, S. F. R. Taylor, C. Hardacre and A. Azapagic, Faraday Discuss., 2016, 192, 283–301 RSC.
- J. Sauer, C. Knight, C. Everly and C. Chi, US, 20070260089, 2005 Search PubMed.
- S. A. Dharaskar, K. L. Wasewar, M. N. Varma, D. Z. Shende and C. Yoo, Arabian J. Chem., 2016, 9, 578–587 CrossRef CAS.
- K. Eller, E. Henkes, R. Rossbacher, H. Höke, K. Eller, E. Henkes, R. Rossbacher and H. Höke, in Ullmann's Encyclopedia of Industrial Chemistry, Wiley-VCH Verlag GmbH & Co. KGaA, Weinheim, Germany, 2000 Search PubMed.
- Y. Li, Q. Li, L. Zhi and M. Zhang, Catal. Lett., 2011, 141, 1635–1642 CrossRef CAS.
- ISO, ISO 14040 - Environmental management – Life cycle assessment – Principles and framework, http://www.iso.org/iso/catalogue_detail?csnumber=37456.
- ISO, ISO 14044 - Environmental management – Life cycle assessment – Requirements and guidelines, http://www.iso.org/iso/catalogue_detail?csnumber=38498.
- Ecoinvent, ecoinvent v3.1, http://www.ecoinvent.org/home.html.
- M. Rossberg, W. Lendle, G. Pfleiderer, A. Tögel, T. R. Torkelson, K. K. Beutel, M. Rossberg, W. Lendle, G. Pfleiderer, A. Tögel, T. R. Torkelson and K. K. Beutel, in Ullmann's Encyclopedia of Industrial Chemistry, Wiley-VCH Verlag GmbH & Co. KGaA, Weinheim, Germany, 2011 Search PubMed.
- F. Su, C. Lu and H.-S. Chen, Langmuir, 2011, 27, 8090–8098 CrossRef CAS.
- US DoE, APPENDIX B: Carbon Dioxide Capture Technology Sheets Post-Combustion Sorbents, https://www.netl.doe.gov/FileLibrary/Research/Coal/carbon capture/handbook/CO2-Capture-Tech-Update-2013-Post-Combustion-Sorbents.pdf.
- A. Mehrkesh and A. T. Karunanithi, ACS Sustainable Chem. Eng., 2013, 1, 448–455 CrossRef CAS.
- Thinkstep, GaBi LCA Software, https://www.thinkstep.com/software/gabi-lca.
- Universiteit Leiden Institute of Environmental Sciences (CML), CML-IA Characterisation Factors, https://www.universiteitleiden.nl/en/research/research-output/science/cml-ia-characterisation-factors.
- S. F. R. Taylor, C. McCrellis, C. McStay, J. Jacquemin, C. Hardacre, M. Mercy, R. G. Bell and N. H. de Leeuw, J. Solution Chem., 2015, 44, 511–527 CrossRef CAS.
- K. T. Chue, J. N. Kim, Y. J. Yoo, S. H. Cho and R. T. Yang, Ind. Eng. Chem. Res., 1995, 34, 591–598 CrossRef CAS.
- J. Kim, L.-C. Lin, J. A. Swisher, M. Haranczyk and B. Smit, J. Am. Chem. Soc., 2012, 134, 18940–18943 CrossRef CAS.
- V. K. Singh and E. Anil Kumar, Appl. Therm. Eng., 2016, 97, 77–86 CrossRef CAS.
- P. Bayer, E. Heuer, U. Karl and M. Finkel, Water Res., 2005, 39, 1719–1728 CrossRef CAS.
- M. M. Yeganeh, T. Kaghazchi and M. Soleimani, Chem. Eng. Technol., 2006, 29, 1247–1251 CrossRef CAS.
- S. Himeno, T. Komatsu and S. Fujita, J. Chem. Eng. Data, 2005, 50, 369–376 CrossRef CAS.
- Z. Zhang, W. Zhang, X. Chen, Q. Xia and Z. Li, Sep. Sci. Technol., 2010, 45, 710–719 CrossRef CAS.
- S. Cavenati, C. A. Grande and A. E. Rodrigues, J. Chem. Eng. Data, 2004, 49, 1095–1101 CrossRef CAS.
- T. L. Sønderby, K. B. Carlsen, P. L. Fosbol, L. G. Kiorboe and N. von Solms, Int. J. Greenhouse Gas Control, 2013, 12, 181–192 CrossRef.
Footnote |
| † Electronic supplementary information (ESI) available. See DOI: 10.1039/c9gc00732f |
| This journal is © The Royal Society of Chemistry 2019 |