 Open Access Article
Donor–acceptor photoexcitation dynamics in organic blends investigated with a high sensitivity pump–probe system†
Simon
Kahmann
 a,
Widianta
Gomulya
b,
Maria A.
Loi
 *a and
Andrea
Mura
*ac
aPhotophysics and OptoElectronics Group, Zernike Institute of Advanced Materials, University of Groningen, Nijenborgh 4, 9747 AG, Groningen, The Netherlands. E-mail: m.a.loi@rug.nl
bNanoscale Quantum Photonics Laboratory, RIKEN Cluster for Pioneering Research, Saitama 351-0198, Japan
cDipartimento di Fisica, Università di Cagliari, I-09042 Monserrato, Italy. E-mail: andrea.mura@dsf.unica.it
First published on 28th September 2018
Abstract
Optical pump–probe spectroscopy is a crucial tool to investigate the excited state behaviour of materials and is especially useful to investigate the photoexcitation dynamics of bulk heterojunctions as found in organic solar cells. Most common techniques for such investigations involve pulses with an energy density in the range of several tens of μJ cm−2, emitted with kHz repetition rate. Such pulse energy can entail non-linear processes due to the formation of high carrier concentrations and can furthermore severely damage the sample material. Here we introduce a softer approach with pulses of nJ cm−2 energy density and a photon flux which is more than three orders of magnitude lower than in regular techniques. We show the capability of our low-cost and easy to make set-up by investigating two prototypical donor–acceptor polymers, C-PCPDTBT and its silicon variant Si-PCPDTBT. Given the high pulse repetition rate in the MHz regime, we are readily able to monitor sample changes of 10−5 and find exciton lifetimes of 108 and 150 ps for C- and Si-PCPDTBT respectively.
1 Introduction
The understanding of interactions in organic materials has been greatly advanced through optical pump–probe techniques.1 Key aspects of the community's understanding of the mechanisms in organic photovoltaics, especially the interplay of electron donor and acceptor materials, were studied through photoinduced absorption (PIA) spectroscopy. These investigations include the seminal observation of the ultrafast charge transfer between conjugated polymers and fullerene derivatives, which facilitates the efficient dissociation of strongly bound Frenkel excitons commonly formed in these low-permittivity materials.2PIA spectroscopy is a powerful technique to study the properties and behaviour of materials upon excitation. Usually, the differential absorption (ΔA) or transmission (ΔT) is monitored and the observable signals are categorised as either photoinduced absorption (PA) or photoinduced bleaching (PB).3 The latter signals are commonly evoked by phase space filling after depopulation of the ground state of the material. Also stimulated emission, for which every incoming photon generates two photons leaving the material, leads to signals with the sign of a bleach. PA, on the other hand, is predominantly attributed to transitions of newly formed species, e.g. free charge carriers, polarons or excitons.3
These processes can be investigated in steady state configuration, where the transmission of a sample is commonly monitored using a continuous probe beam, whilst an excitation light source (pump) is modulated, e.g. using a mechanical chopper wheel, to generate the ground and the excited states. In such a way, relatively long-lived signals with a lifetime in the nano- to millisecond regime can be monitored. In order to examine the transient behaviour and to be able to study short-lived signals, it is necessary to use pulsed laser sources instead of continuous illumination. Depending on the lifetimes of interest, this experiment (often referred to as transient absorption, TA spectroscopy) can be carried out using electronic delays (predominantly in the micro- to millisecond regime) or mechanical delay lines. In the latter case, the pump and probe pulses are subject to an optical path difference relative to each other. Provided with short enough light pulses, the time resolution in such experiments can easily reach several picoseconds or lower. For a broader discussion on relevant techniques and advances also consider the reports in the literature.1,3
In recent years, the precise contribution of so-called charge transfer states (CTS) and the role of excess energy in the formation of free charge carriers has been intensively debated.4,5 Furthermore, the role of exciton coherence,6,7 polaron delocalisation8 and the presence of finely intermixed regions in blends of donor–acceptor materials has been driven by optical pump–probe spectroscopy.9 Similarly, the generation of charge carriers in neat polymers has been studied in great detail through optical techniques.10 Even after two decades of intensive research, optical pump–probe spectroscopy hence is still at the centre of scientific progress in the field of organic photovoltaics and drives the community's efforts for greater power conversion efficiencies.
Photoinduced changes in sample absorption are generally small. In order to achieve acceptable signal to noise ratio, high pulse energy densities exceeding several μJ cm−2 are commonly employed. Using pulses of such high intensity, however, can entail significant drawbacks for the analysis. Most importantly, the incoming photon flux is not representative for the processes occurring in solar cells. The global photon flux at AM1.5 coming from the sun above 1.4 eV (which is the region in which state-of-the-art materials can absorb) amounts to approximately 5 × 1016 cm−2 s−1. When high intensity laser pulses generate charge carrier densities significantly exceeding this magnitude, higher order processes, such as Auger recombination or exciton–exciton annihilation, can become dominant. Extracting carrier/exciton lifetimes from such measurements thus offers values that are not meaningful for operation in solar cells. Even more strikingly, the observed decay dynamics may be misinterpreted.
Another detrimental side effect of high intensity laser pulses is the risk of photodegradation. In the worst case, materials decompose during the measurement and the acquired data is neither representative for the original material nor for working conditions of a solar cell. In order to suppress these undesired phenomena, laser pulses are generally strongly attenuated before being sent onto the sample material. Reducing the pulse power, however, comes at the cost of a decreased signal to noise ratio.
To enable a proper assessment of excited state dynamics of organic materials, whilst working closer to the conditions encountered in photovoltaic cells, we thus present here a simple two-colour set-up,11–13 based on a high repetition rate laser source, emitting pulses of 1–2 ps duration with MHz frequency. This repetition rate allows for a significantly higher signal to noise ratio than in commonly employed 1 kHz techniques, whilst allowing for a small pulse energy and photon flux. We are therefore able to study the carrier dynamics of sample materials with excitation densities closer to solar illumination. The set-up furthermore allows to broadly tune the excitation wavelength, i.e. to selectively excite different transitions of the sample and to study the transient behaviour over a time window of several nanoseconds.
Introducing this technique, we chose to investigate two prototypical donor–acceptor (D–A) polymers, namely PCPDTBT and its silicon variant, together with their respective blends with the fullerene derivative PC60BM – systems that show very small differences in chemical structure, but with a large impact in morphology and solar cell efficiency. Whilst both systems have been studied in the past, we believe that additional to offering the important low excitation power, this is the first direct comparison of their photoexcitation dynamics.
2 Experimental
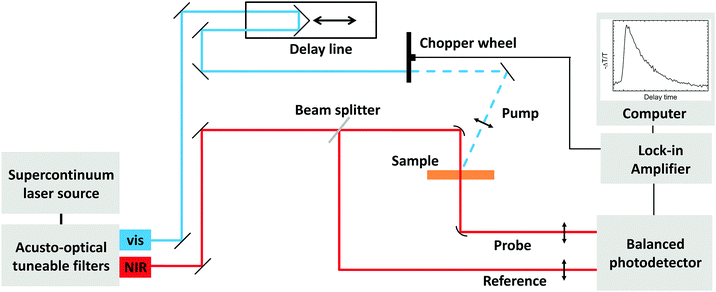
The crucial parts of our set-up are a high-repetition rate supercontinuum laser and an auto-balanced photodetector. Fig. 1 depicts a scheme of the set-up with its major components. Both the pump and the probe light are emitted by a broadband light source (NKT SuperK Extreme), emitting a single-mode supercontinuum formed in an optical fibre. The pulsed laser light is generated at a rate of 78 MHz and is tuneable down to 2 MHz using a built-in pulse-picker. An optical filter box based on acousto-optic tuneable filter (NKT SuperK Select) is used to choose and tune up to eight emission wavelengths. One exit port in the visible (500–810 nm) and one in the near infrared (NIR) spectral region (825–1400 nm) can be used conveniently as visible pump and NIR probe for conjugated polymers (Fig. 1). Using suitable optical components furthermore allows for both pump and probe to be taken from the same port. Using this laser source, we are able to excite the sample with pulse power densities of approximately 10 nJ cm−2 at an integrated emission power of 0.1–1 mW, assuming a spot radius of 200 μm on the sample. In kHz standard set-ups, the employed pulse power density is often adjusted to 1–10 μJ cm−2, with the comment that this led to a linear intensity dependent sample response.4,14,15 For some materials, however, the response is still affected by higher order process for intensities around 1 μJ cm−2.16 Especially the long range dynamics of PCPDTBT were shown to depend on the pulse energy density.17For a wavelength of 800 nm, we determine a photon flux of approximately 1022 cm−2 s−1 for our set-up. This is still larger than the above stated value from the sun, but it is five orders of magnitude lower than what is approximately found in set-ups based on lasers with a kHz repetition rate and a pulse duration of 100 fs (see calculations in ESI†).
As shown in Fig. 1, the pump beam travels through a set of mirrors and is modulated with a mechanical chopper wheel, typically set to a frequency of around 1 kHz. Subsequently, the beam is focused onto the sample. To be able to measure transient spectra, a mechanical delay line, with sub-picosecond time resolution (LMS-100, PI miCos), is inserted into the beam path of the pump beam. A full-range displacement of the mirror gives rise to an optical path difference corresponding to a delay of approximately 6 ns.
Meanwhile, after having left the emission port, the probe beam is split into two sub-beams, of which one is directed perpendicularly onto and transmitted by the sample. The second sub-beam is used as reference without sample interaction. Both beams are eventually detected using the auto-balanced photodetector (New Focus Nirvana 2007 or 2017, sensitive from 400 to 1100 or from 800 to 1700 nm, respectively). The reference sub-beam compensates variations in probe intensity due to the laser output. The photodetectors exhibit a cut-off frequency in the low kHz regime (depending on the signal strength). The incident MHz probe beams thus appear as continuous signals and only the impact of the modulated pump beam is detected. The photodetector offers the pump-induced intensity change (ΔT) and the absolute intensity at the input (the average of T and T + ΔT) as output. This way, we are able to determine the differential transmission ΔT/T. The time resolution of this set-up is lower than 20 ps (see ESI† for details).
For a proper signal to noise ratio and to allow for phase-sensitive studies, the Nirvana output is fed into a lock-in amplifier (Stanford Research Instruments SR830, 3 s integration time) synchronised to the chopper wheel. Additional to the above discussed scientific benefits, this set-up also has the advantage of being a relatively simple installation of components that are readily commercially available at a low price, when compared to kHz set-ups based on Ti:sapphire lasers.
To prove the advantages of this set-up, we investigated two different polymers, poly[2,6-(4,4-bis-(2-ethylhexyl)-4H-cyclopenta[2,1-b;3,4-b′]-dithiophene)-alt-4,7-(2,1,3-benzothiadiazole)] (C-PCPDTBT, Mn = 35 kDa, Mw = 47 kDa) and its silicon variant poly[(4,4′-bis(2-ethylhexyl)dithieno[3,2-b:2′,3′-d]silole)-2,6-diyl-alt-(4,7-bis(2-thienyl)-2,1,3-benzothiadiazole)-5,5′-diyl] (Si-PCPDTBT, also known as PSBTBT, Mn = 25 kDa, Mw = 50 kDa). Both materials were obtained from Konarka Technologies. The electron acceptor PC60BM (99.5%) was purchased from Solenne. All materials were used as received. The materials were dissolved at 20 mg mL−1 concentration in chlorobenzene or ortho-dichlorobenzene in case of C- and Si-PCPDTBT respectively. The solutions were stored overnight while vigorously stirring at 80 °C in the former and 100 °C in the latter case. Afterwards, the films (approximately 100 nm thick) were spin cast onto quartz substrates and sealed under nitrogen atmosphere using epoxy glue and quartz cover glasses.
3 Results
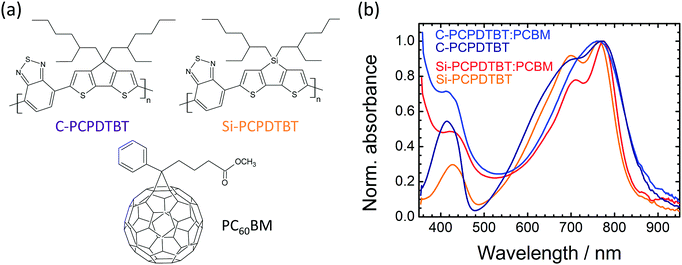
The polymer C-PCPDTBT is a prototypical and widely studied donor–acceptor material as used in organic electronics. The combination of the electron withdrawing 2,1,3-benzothiadiazole with the electron rich bi-thiophene (consider molecular structure in Fig. 2(a)) narrows the material's band gap leading to an absorption onset close to 900 nm. Cast from chlorobenzene, especially when blended with PCBM, it forms a finely mixed amorphous microstructure,18–20 which is reflected in the broad and featureless absorption bands shown in Fig. 2(b). Besides the dominant absorption band in the near infrared region, the material also exhibits a second, high energy, absorption band centred around 400 nm. The comparatively narrow band gap and broad coverage of the solar spectrum led to relatively high power conversion efficiencies (PCE) for solar cells, when initially introduced in 2007.18 It was furthermore observed that casting films in presence of solution additives facilitates a more favourable, i.e. more crystalline, morphology21 that significantly increases the device performance.18–20In contrast, Si-PCPDTBT, in which the carbon atom bridging the two thiophene rings is replaced by silicon, forms a crystalline microstructure without further treatment.22 Whilst the absorption of Si-PCPDTBT also exhibits two broad absorption bands in similar spectral regions as the carbon variant, a vibronic substructure is observable even in presence of PCBM (red curve, Fig. 2(b)). This substructure indicates a higher degree of order in this material and was previously linked to a cross-hatched structure.23,24 The increased crystallinity promotes a better charge transport and thereby a higher solar cell PCE compared to C-PCPDTBT in the amorphous phase.22 For a detailed study on the morphology of this polymer family, we refer the interested reader to an intricate study carried out by Schulz et al.23
Intensive studies on the excited states in both materials based on high intensity pulsed laser spectroscopy revealed that both materials give rise to a long lasting PA around 1250 nm (1 eV) in blend with PCBM.14,25,26 This signal was attributed to the absorption of positive polarons and is accompanied by an equally long-lived bleaching (extending into the μs to ms range17,25,27) of the ground state probed around 790 nm. A photoinduced signature of excitons is more short lived and peaks at longer wavelengths around 1450–1500 nm,14,28,29 but overlaps with the polaron signal at 1250 nm.
With these assignments in mind, we first consider the dynamics of a blend of Si-PCPDTBT with PCBM (1![[thin space (1/6-em)]](https://www.rsc.org/images/entities/char_2009.gif) :
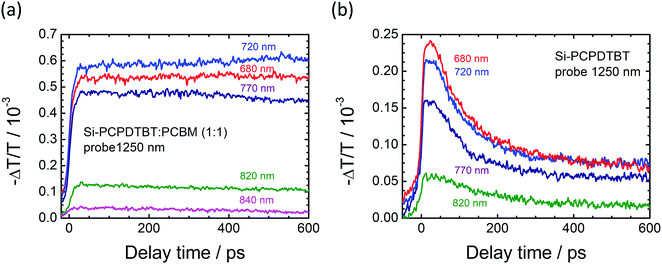
:![[thin space (1/6-em)]](https://www.rsc.org/images/entities/char_2009.gif) 1 weight ratio), for which the spectra are shown in Fig. 3(a). The curves display the TA probed at 1250 nm upon excitation at different wavelengths in the low energy absorption band of the polymer. In all cases, i.e. independent of the excitation wavelength, a rapid absorption onset is followed by a constant signal that extends throughout our measurement window. The long-lived signal is attributed to the absorption of photoinduced positive polarons formed on the polymer after electron transfer towards PCBM. The ultrafast formation of polymer polarons on a sub-ps scale cannot be resolved by our set-up, but is in line with previous observations for this material.15,30 Whilst Othonos et al., however, find a 3-exponential decay of the polaron absorption, with lifetimes of 1 ps, 27 ps and 1.3 ns, our measurement does not exhibit any decays within our window of measurement.
1 weight ratio), for which the spectra are shown in Fig. 3(a). The curves display the TA probed at 1250 nm upon excitation at different wavelengths in the low energy absorption band of the polymer. In all cases, i.e. independent of the excitation wavelength, a rapid absorption onset is followed by a constant signal that extends throughout our measurement window. The long-lived signal is attributed to the absorption of photoinduced positive polarons formed on the polymer after electron transfer towards PCBM. The ultrafast formation of polymer polarons on a sub-ps scale cannot be resolved by our set-up, but is in line with previous observations for this material.15,30 Whilst Othonos et al., however, find a 3-exponential decay of the polaron absorption, with lifetimes of 1 ps, 27 ps and 1.3 ns, our measurement does not exhibit any decays within our window of measurement.
TA spectra for the neat material under the same conditions are shown in Fig. 3(b). The curves display a strikingly different behaviour in this case. At short delay times, approximately up to 400 ps, the transients undergo an exponential decrease in signal magnitude. This decay is attributed to the recombination of excitons.30 Although simple discussions on organic solar cells motivate the application of a donor–acceptor interface by the need of a driving force to dissociate strongly bound Frenkel excitons,31 the formation of free charge carriers (or polarons, to be more precise) in neat polymers is a general observation in optical spectroscopy.26 Again, the polarons can be observed by the finite signal at long delay times, analogous to the behaviour of the blend above and reported before.15 For the silicon variant, we thus observe the typical behaviour of a D–A polymer, i.e. on the one hand a significant formation of charges already in the neat film, where the response is, nonetheless, still governed by non-dissociating excitons. On the other hand, blended with PCBM, the spectra are dominated by a long-lasting polaron absorption.
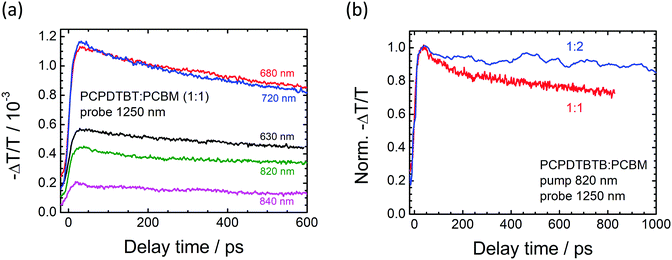
Fig. 4(a) shows the data obtained for the blend of the carbon variant with PCBM. Again, the blend's transients are marked by a rapid initial signal increase. Similar to the observation of the Si-PCPDTBT:PCBM sample above, the signal remains almost constant for a long delay time, but there is also a distinct signal decrease at early times. We attribute such a decay to an incomplete splitting of excitons, which tend to recombine before reaching the donor–acceptor interface.14 We note that for this material, the best performing blend ratio in organic solar cells is approximately 1![[thin space (1/6-em)]](https://www.rsc.org/images/entities/char_2009.gif) :
:![[thin space (1/6-em)]](https://www.rsc.org/images/entities/char_2009.gif) 2 (polymer
2 (polymer![[thin space (1/6-em)]](https://www.rsc.org/images/entities/char_2009.gif) :
:![[thin space (1/6-em)]](https://www.rsc.org/images/entities/char_2009.gif) fullerene)18 and thus also investigated the TA response for such a varied composition. A normalised decay trace of a 1
fullerene)18 and thus also investigated the TA response for such a varied composition. A normalised decay trace of a 1![[thin space (1/6-em)]](https://www.rsc.org/images/entities/char_2009.gif) :
:![[thin space (1/6-em)]](https://www.rsc.org/images/entities/char_2009.gif) 2 blend is depicted in Fig. 4(b) as a comparison. The spectra of the two blends clearly show the early decay of the 1
2 blend is depicted in Fig. 4(b) as a comparison. The spectra of the two blends clearly show the early decay of the 1![[thin space (1/6-em)]](https://www.rsc.org/images/entities/char_2009.gif) :
:![[thin space (1/6-em)]](https://www.rsc.org/images/entities/char_2009.gif) 1 ratio, whilst the 1
1 ratio, whilst the 1![[thin space (1/6-em)]](https://www.rsc.org/images/entities/char_2009.gif) :
:![[thin space (1/6-em)]](https://www.rsc.org/images/entities/char_2009.gif) 2 blend remains almost constant with time. This is a clear indication that excitons are efficiently dissociated in the latter blend, for which PCBM acceptor sites are more ubiquitous and thus can be reached by diffusing excitons before they recombine.
2 blend remains almost constant with time. This is a clear indication that excitons are efficiently dissociated in the latter blend, for which PCBM acceptor sites are more ubiquitous and thus can be reached by diffusing excitons before they recombine.
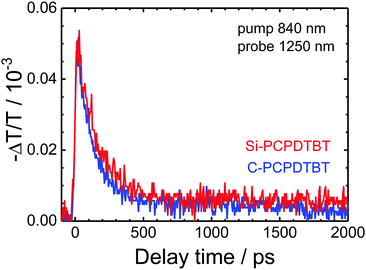
Finally, we consider a long-range measurement of the two neat polymers upon excitation in their absorption tail at 840 nm. Investigating the kinetics under these extreme conditions is important, e.g., for investigating the effect of excess energy on the dissociation of excitons. The corresponding spectra for the two materials are given in Fig. 5. This measurement also serves to show the high sensitivity of our set-up at room temperature, which is able to easily distinguish changes in the range of 10−5.32 As expected from the measurements above, the transients include a rapid decay at early times until approximately 400 ps, after which the signal remains virtually constant over our window of measurement.
Fitting the corresponding lifetime of the initial decay leads to values of 108 ps for C-PCPDTBT, which is in the range of the reported values of 78–120 ps found in different investigations14,17,29 – especially since it was shown that the excited state lifetime of C-PCPDTBT is strongly affected by exposure to the environment.33 The silicon variant exhibits a slightly longer lifetime of 150 ps, which is in agreement with our expectations for a more rigid and crystalline polymer.34
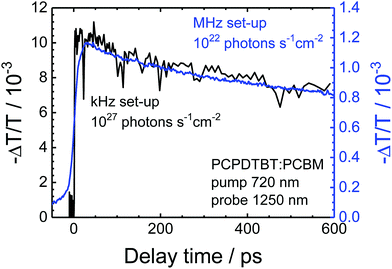
For comparison, we also investigated the same samples with a super-continuum TA spectrometer (Ultrafast Systems Helios) coupled with an optical parametric amplifier (TOPAS 800) and with a kHz Ti:sapphire laser system (Coherent Libra). The time duration of the laser pulses of this system is about 120 fs. Fig. 6 displays a measurement of the PCPDTBT:PCBM blend close to the system detection limit, with a pump pulse energy density of about 6 μJ cm−2. The pump photon flux in this case is 2 × 1027 cm−2 s−1 (cw-equivalent power of 60 μW at 800 nm), hence five orders of magnitude larger than the one used in the two colour set-up (also shown in Fig. 6). As can be seen from Fig. 6, the obtained signal magnitude for the kHz-based set-up (10−2–10−3) is ten times larger due to the higher carrier density. This comparison offers two important insights. Firstly, our set-up not only offers the possibility of measuring at significantly lower excitation densities, but simultaneously to achieve low-magnitude signals of very high quality (low signal to noise ratio). Secondly, we can prove that despite the important issue of sample degradation and higher order effects, data for this well-studied donor–acceptor system that were acquired with more “standard” set-ups remain meaningful and relevant for device physics, for example in solar cells.
4 Conclusions
In conclusion, we here introduce a straight-forward and easy to apply set-up for optical pump–probe measurements. The low pulse energy allows for photon fluxes approximately five orders of magnitude smaller than in set-ups based on high-power kHz lasers. Due to the high repetition rate in the MHz regime, our set-up is able to deliver a high signal to noise level, which easily allows to resolve signals of the magnitude of 10−5.We present a set of measurements on the prototypical donor–acceptor polymers C-PCPDTBT and its silicon variant Si-PCPDTBT, which have been widely used in organic solar cells and characterised optically in high power set-ups. We are able to clearly track the photoinduced absorption of both excitons and formed polarons in neat films of the polymer or blends with the electron acceptor PCBM and extract an exciton lifetime of 108 and 150 ps for C- and Si-PCPDTBT, respectively. When blending with a relatively low content of PCBM (1![[thin space (1/6-em)]](https://www.rsc.org/images/entities/char_2009.gif) :
:![[thin space (1/6-em)]](https://www.rsc.org/images/entities/char_2009.gif) 1 ratio), exciton dissociation remains incomplete for the carbon variant. When blending with a ratio of 1
1 ratio), exciton dissociation remains incomplete for the carbon variant. When blending with a ratio of 1![[thin space (1/6-em)]](https://www.rsc.org/images/entities/char_2009.gif) :
:![[thin space (1/6-em)]](https://www.rsc.org/images/entities/char_2009.gif) 2, the dissociation is significantly more efficient. For Si-PCPDTBT no such behaviour was observed, which speaks for the superior performance of the more crystalline silicon variant as observed in solar cells.
2, the dissociation is significantly more efficient. For Si-PCPDTBT no such behaviour was observed, which speaks for the superior performance of the more crystalline silicon variant as observed in solar cells.
Conflicts of interest
There are no conflicts to declare.Acknowledgements
This work is part of the research programme of the Foundation for Fundamental Research on Matter (FOM), which is part of the Netherlands Organisation for Scientific Research (NWO). This is a publication of the FOM-focus Group “Next Generation Organic Photovoltaics”, participating in the Dutch Institute for Fundamental Energy Research (DIFFER). Further funding occurred through the Materials for Sustainability (Mat4Sus) programme of NWO. A. Kamp and T. Zaharia are thanked for technical support. We acknowledge the CeSAR (Centro Servizi d’Ateneo per la Ricerca) of the University of Cagliari, Italy for the kHz, femtosecond transient absorption measurements. W. G. is an International Research Fellow of JSPS (Postdoctoral Fellowship for Research in Japan (Standard)).Notes and references
- J. Cabanillas-Gonzalez, G. Grancini and G. Lanzani, Adv. Mater., 2011, 23, 5468–5485 CrossRef CAS PubMed.
- N. S. Sariciftci, L. Smilowitz, A. J. Heeger and F. Wudl, Science, 1992, 258, 1474–1476 CrossRef CAS PubMed.
- G. Lanzani, G. Cerullo, D. Polli, A. Gambetta, M. Zavelani-Rossi and C. Gadermaier, Phys. Status Solidi, 2004, 201, 1116–1131 CrossRef CAS.
- G. Grancini, M. Maiuri, D. Fazzi, A. Petrozza, H.-J. Egelhaaf, D. Brida, G. Cerullo and G. Lanzani, Nat. Mater., 2013, 12, 29–33 CrossRef CAS PubMed.
- K. Vandewal, S. Albrecht, E. T. Hoke, K. R. Graham, J. Widmer, J. D. Douglas, M. Schubert, W. R. Mateker, J. T. Bloking, G. F. Burkhard, A. Sellinger, J. M. J. Fréchet, A. Amassian, M. K. Riede, M. D. McGehee, D. Neher and A. Salleo, Nat. Mater., 2014, 13, 63–68 CrossRef CAS PubMed.
- S. M. Falke, C. A. Rozzi, D. Brida, M. Maiuri, M. Amato, E. Sommer, A. De Sio, A. Rubio, G. Cerullo, E. Molinari and C. Lienau, Science, 2014, 344, 1001–1005 CrossRef CAS PubMed.
- S. Gélinas, A. Rao, A. Kumar, S. L. Smith, A. W. Chin, J. Clark, T. S. van der Poll, G. C. Bazan and R. H. Friend, Science, 2014, 343, 512–516 CrossRef PubMed.
- S. Kahmann, M. A. Loi and C. J. Brabec, J. Mater. Chem. C, 2018, 6, 6008–6013 RSC.
- M. Causa, J. De Jonghe-Risse, M. Scarongella, J. C. Brauer, E. Buchaca-Domingo, J.-E. Moser, N. Stingelin and N. Banerji, Nat. Commun., 2016, 7, 12556 CrossRef CAS PubMed.
- O. G. Reid, R. D. Pensack, Y. Song, G. D. Scholes and G. Rumbles, Chem. Mater., 2014, 26, 561–575 CrossRef CAS.
- A. Gambetta, G. Galzerano, A. G. Rozhin, A. C. Ferrari, R. Ramponi, P. Laporta and M. Marangoni, Opt. Express, 2008, 16, 11727 CrossRef CAS PubMed.
- C. Manzoni, R. Osellame, M. Marangoni, M. Schultze, U. Morgner and G. Cerullo, Opt. Lett., 2009, 34, 620 CrossRef CAS PubMed.
- P. D. Cunningham, J. E. Boercker, E. E. Foos, M. P. Lumb, A. R. Smith, J. G. Tischler and J. S. Melinger, Proc. SPIE, 2012, 8256, 825610 CrossRef.
- I.-W. Hwang, C. Soci, D. Moses, Z. Zhu, D. Waller, R. Gaudiana, C. J. Brabec and A. J. Heeger, Adv. Mater., 2007, 19, 2307–2312 CrossRef CAS.
- A. Othonos, G. Itskos, M. Neophytou and S. A. Choulis, Appl. Phys. Lett., 2012, 100, 1–5 CrossRef.
- J. Piris, T. E. Dykstra, A. A. Bakulin, P. H. Van Loosdrecht, W. Knulst, M. T. Trinh, J. M. Schins and L. D. Siebbeles, J. Phys. Chem. C, 2009, 113, 14500–14506 CrossRef CAS.
- F. Etzold, I. a. Howard, N. Forler, D. M. Cho, M. Meister, H. Mangold, J. Shu, M. R. Hansen, K. Müllen and F. Laquai, J. Am. Chem. Soc., 2012, 134, 10569–10583 CrossRef CAS PubMed.
- J. Peet, J. Y. Kim, N. E. Coates, W. L. Ma, D. Moses, A. J. Heeger and G. C. Bazan, Nat. Mater., 2007, 6, 497–500 CrossRef CAS PubMed.
- Y. Gu, C. Wang and T. P. Russell, Adv. Energy Mater., 2012, 2, 683–690 CrossRef CAS.
- J. T. Rogers, K. Schmidt, M. F. Toney, E. J. Kramer and G. C. Bazan, Adv. Mater., 2011, 23, 2284–2288 CrossRef CAS PubMed.
- F. S. U. Fischer, D. Trefz, J. Back, N. Kayunkid, B. Tornow, S. Albrecht, K. G. Yager, G. Singh, A. Karim, D. Neher, M. Brinkmann and S. Ludwigs, Adv. Mater., 2015, 27, 1223–1228 CrossRef CAS PubMed.
- M. C. Scharber, M. Koppe, J. Gao, F. Cordella, M. A. Loi, P. Denk, M. Morana, H. J. Egelhaaf, K. Forberich, G. Dennler, R. Gaudiana, D. Waller, Z. Zhu, X. Shi and C. J. Brabec, Adv. Mater., 2010, 22, 367–370 CrossRef CAS PubMed.
- G. L. Schulz, F. S. U. Fischer, D. Trefz, A. Melnyk, A. Hamidi-Sakr, M. Brinkmann, D. Andrienko and S. Ludwigs, Macromolecules, 2017, 50, 1402–1414 CrossRef CAS.
- F. Panzer, H. Bässler and A. Köhler, J. Phys. Chem. Lett., 2017, 8, 114–125 CrossRef CAS PubMed.
- F. C. Jamieson, T. Agostinelli, H. Azimi, J. Nelson and J. R. Durrant, J. Phys. Chem. Lett., 2010, 1, 3306–3310 CrossRef CAS.
- S. Kahmann, D. Fazzi, G. J. Matt, W. Thiel, M. A. Loi and C. J. Brabec, J. Phys. Chem. Lett., 2016, 7, 4438–4444 CrossRef CAS PubMed.
- T. Clarke, A. Ballantyne, F. Jamieson, C. Brabec, J. Nelson and J. Durrant, Chem. Commun., 2008, 89–91 RSC.
- F. Etzold, I. Howard, N. Forler, A. Melnyk, D. Andrienko, M. R. Hansen and F. Laquai, Energy Environ. Sci., 2015, 8, 1511–1522 RSC.
- S. Kahmann, A. Mura, L. Protesescu, M. V. Kovalenko, C. J. Brabec and M. A. Loi, J. Mater. Chem. C, 2015, 3, 5499–5505 RSC.
- M. Koppe, H. J. Egelhaaf, E. Clodic, M. Morana, L. Lüer, A. Troeger, V. Sgobba, D. M. Guldi, T. Ameri and C. J. Brabec, Adv. Energy Mater., 2013, 3, 949–958 CrossRef CAS.
- C. J. Brabec, S. Gowrisanker, J. J. M. Halls, D. Laird, S. Jia and S. P. Williams, Adv. Mater., 2010, 22, 3839–3856 CrossRef CAS PubMed.
- S. Kahmann, J. M. Salazar Rios, M. Zink, S. Allard, U. Scherf, M. C. dos Santos, C. J. Brabec and M. A. Loi, J. Phys. Chem. Lett., 2017, 8, 5666–5672 CrossRef CAS PubMed.
- D. Jarzab, F. Cordella, J. Gao, M. Scharber, H.-J. J. Egelhaaf and M. A. Loi, Adv. Energy Mater., 2011, 1, 604–609 CrossRef CAS.
- D. Di Nuzzo, D. Viola, F. S. U. Fischer, G. Cerullo, S. Ludwigs and E. D. Como, J. Phys. Chem. Lett., 2015, 6, 1196–1203 CrossRef CAS PubMed.
Footnote |
| † Electronic supplementary information (ESI) available: Estimation of the photon flux, emission spectra, discussion on the time resolution. See DOI: 10.1039/c8tc03118e |
| This journal is © The Royal Society of Chemistry 2018 |

