 Open Access Article
Creative Commons Attribution 3.0 Unported Licence
Anomalously low twist and bend elastic constants in an oxadiazole-based bent-core nematic liquid crystal and its mixtures; contributions of spontaneous chirality and polarity†
S.
Srigengan
a,
M.
Nagaraj
 a,
A.
Ferrarini
b,
R.
Mandle
 c,
S. J.
Cowling
 c,
M. A.
Osipov
de,
G.
Pająk
f,
J. W.
Goodby
c and
H. F.
Gleeson
 *a
*a
aSchool of Physics and Astronomy, University of Leeds, Leeds LS2 9JT, UK. E-mail: H.F.Gleeson@leeds.ac.uk
bDepartment of Chemical Sciences, University of Padua, I-35131 Padua, Italy
cDepartment of Chemistry, University of York, York YO10 5DD, UK
dDepartment of Mathematics and Statistics, University of Strathclyde, Glasgow G1 1XH, UK
eTopchiev Institute of Petrochemical Synthesis, Russian Academy of Sciences, Leninsky prosp. 29, 119991 Moscow, Russia
fFaculty of Physics, Mathematics and Computer Science, T. Kościuszko Cracow University of Technology, 30-084 Kraków, Poland
First published on 30th November 2017
Abstract
The splay, twist, and bend elastic constants of an oxadiazole based bent-core liquid crystal have been measured as functions of temperature throughout the nematic phase. The splay elastic constant (K11) behaves similarly to other bent-core systems, though it exhibits rather high values, varying between 8–14 pN. Further, anomalously low, temperature-independent values of both the twist and bend constants (K22 and K33) are found. The combination of such low values of both constants (∼0.15 pN and ∼1.2 pN) and temperature independence has not been observed in any type of nematic material previously. This unusual behaviour has been further investigated using two independent theoretical approaches; a molecular theory based on atomistic simulations of the real molecular structure and an analytical molecular-field theory. Computational calculations show good agreement with the experimental results for both the twist and bend constants. The statistical theory introduces a term related to chiral fluctuations that affects the twist constant, while the inclusion of polarity is known to explain low values of the bend constant. The additional terms enable one to understand the origin of the low values of both elastic constants and to describe their weak temperature dependence. It also offers an explanation for the spontaneous chiral segregation observed in some nematic bent-core systems. Mixtures of this unusual oxadiazole material are made with another similar material (C5-Ph-ODBP-Ph-OC12) that has been extensively studied that exhibits somewhat higher twist and bend elastic constants to explore the behaviour as a function of concentration.
1 Introduction
Nematic liquid crystals (NLCs) are fluids characterised by long-range uniaxial, apolar, orientational order that manifests as anisotropy in their optical, electrical and elastic properties. These anisotropic properties and their responsiveness together make liquid crystals ubiquitous in display devices. The nematic phase that is most commonly used is formed from rod-like (calamitic) molecules, but markedly different behaviour is observed in the nematic phase formed from bent-core mesogens. The differences include increased flexoelectricity1,2 and the potential to exhibit exotic phases such as the twist–bend nematic phase3,4 and the dark conglomerate phase.5,6 The remarkable spontaneous segregation of chiral domains of opposite handedness has also been reported in the nematic phase formed from bent-core molecules.7,8The elastic properties of NLCs are critical parameters, influencing their behaviour in devices as they define both the threshold voltage and steepness of the electro-optic response. The three main elastic constants in NLCs are the splay, twist and bend constants, denoted K11, K22 and K33 respectively. It is now well-established that there is a distinct difference in the behaviour of the elastic constants in calamitic and bent-core NLCs. Generally for calamitic systems K11 < K33, whereas the bent-core systems exhibit the opposite, i.e. K11 > K33,9–15 a difference which is naturally explained by the bend angle that arises in bent-core liquid crystals.16 Furthermore, it has been shown that for a family of oxadiazole-based bent-core NLCs, all of the elastic constants values are smaller than those measured in standard calamitic NLCs17 with one particular compound (C5-Ph-ODBP-Ph-OC12) exhibiting especially low elastic constant values.18
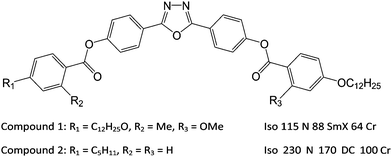
In this paper we report exceptionally low elastic constants measured for an oxadiazole-based material (compound 1 in Fig. 1) that is related to those in other studies.17 Our measurements show that the material exhibits twist and bend constants that are significantly lower than those measured in C5-Ph-ODBP-Ph-OC12 (compound 2 in Fig. 1)18 together with K11 values that are higher than in other oxadiazole-based bent-core NLCs. Low values of K33 have been found in bent-core NLCs above the transition into the twist–bend phase4,19,20 but such low values of both K22 and K33 over the full nematic phase regime have never been observed in any other NLC material. In addition, both K22 and K33 in compound 1 are found to be practically temperature independent, which is very unusual. Indeed the current molecular theory indicates that all three elastic constants should generally increase with decreasing temperature as some power of the nematic order parameter, S, and are roughly of the same order of magnitude. The results for compound 1 shown in this paper contradict this conventional understanding. This unexpected behaviour is interpreted using qualitative molecular theory and a theory based on simulations of the real molecular structure of oxadiazole materials, providing an insight into the important underlying molecular parameters. In order to further investigate the phenomena, we explore the physical properties of mixtures of compound 1 with compound 2.17,18 The main structural differences between compounds 1 and 2 lie in their lateral substitution and terminal chains; the former has asymmetric methoxy- and methyl-substitution, while the latter has no lateral chains but asymmetric terminal chains. The lateral substitution serves to reduce the temperature at which the nematic phase is exhibited,21 an important factor if any practical applications of bent-core mesogens are to be realised.
2 Experimental details
2.1 Materials and devices
The transition temperatures of both the pure materials and the mixtures were determined by a combination of polarizing optical microscopy (POM) and differential scanning calorimetry (DSC). In this paper, we are especially interested in the properties of the nematic phase. Mixtures were made by melting specific amounts of the pure compounds in the same container, giving time for the samples to mix before cooling back into the crystal phase. The phase diagram of the mixed system is shown in Fig. 2, determined on cooling at a rate of 5 °C min−1. The phase diagram shows an approximately linear dependence of all of the phase transitions on concentration. An optically isotropic phase occurs at higher concentrations of compound 2, while a smectic phase is observed at lower concentrations. The factors that favour a smectic phase or a dark conglomerate phase will be addressed in a future publication. Compound 1 was found to degrade at temperatures above 180 °C, which is not important for measurements of the pure material as all the mesophase behaviour is below that. For the mixtures, however, all measurements were constrained to temperatures below 180 °C.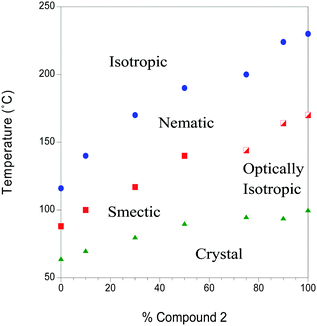 | ||
| Fig. 2 The phase diagram of mixtures of compound 2 in compound 1. The blue points mark the isotropic to nematic transition, the solid red data points represent the transition from the nematic to an unknown smectic (probably smectic C) phase, while the half-filled red data points represent the transition from a nematic to an optically isotropic phase. In the case of pure compound 2, the optically isotropic phase is the dark conglomerate (DC phase). The green data points mark the mesophase to crystal transition. The POM and DSC traces are available from the linked data repository, https://doi.org/10.5518/207. | ||
2.2 Measurement of dielectric anisotropy and elastic constants
All electrical and electro-optic measurements were carried out using 5 μm thick devices with wires attached to the electrodes using high-temperature conducting glue (H21D, Epoxy Technology). The temperature of the devices was controlled with a relative accuracy of ±0.1 °C using a Linkam LTS 350 hot stage and TMS 94 temperature controller. All electric fields were applied at a frequency of 10 kHz avoiding any relaxations in the systems. All devices were capillary filled in the nematic phase. The surface alignment on the devices defined the sample geometry and allowed a wide range of experiments to be carried out. Homeotropic alignment was achieved using trichloro(octadecyl) silane in hexane, while planar alignment was obtained using a rubbed high-temperature (SE130) polyimide layer. Homeotropic alignment of bent-core liquid crystals is a particular challenge and while the quality was found to be very good in our devices, it was not perfect. Measurements were taken only when the alignment was deemed good enough (through comparison with known data in other materials, including compound 2) and our experimental uncertainties take account of this. A slight degradation of the homeotropic alignment was observed as the temperature decreased in the nematic phase, similar to that noted by Kaur et al. more than ∼15 K below the nematic–isotropic transition temperature (TNI) for some other oxadiazole based bent-core NLCs.17The dielectric anisotropy (Δε) was measured as a function of temperature across the nematic regime using an Agilent Precision LCR Meter E4980A. Both planar and homeotropic devices were used to determine the perpendicular and parallel components of the dielectric constant respectively, and an accuracy of ∼10% or 0.5 in the measurements is assumed (whichever is larger). As mentioned, this value reflects all of the uncertainties intrinsic to the measurement, as well as the alignment quality in our devices.
The elastic constants were deduced via the analysis of the electric-field induced Freedericksz transition in appropriate geometries. As all of the materials exhibit negative dielectric anisotropy across their entire nematic phase regime, a homeotropic geometry with the field applied parallel to the director orientation was required to deduce K11 and K33. An in-plane switching (IPS) device was used to determine K22.18 The IPS device has interdigited electrodes with electrode gap and width dimensions of 20 μm and 10 μm respectively, treated for planar alignment with a rubbing direction perpendicular to the electrodes.
The Freedericksz transitions were determined optically by observing the transmitted intensity of monochromatic 675 nm laser light (for K11 and K33) or white light (for K22) as a function of applied voltage. The transmitted light intensity was monitored using a photodiode mounted on a polarizing microscope with crossed polarizers. In order to calculate K11 and K33 the intensity I transmitted as a function of voltage for the homeotropic device was converted into retardance, δ using I = I0![[thin space (1/6-em)]](https://www.rsc.org/images/entities/char_2009.gif) sin2(δ/2), where I0 is the maximum transmitted intensity. K33 is directly related to the threshold voltage of the homeotropic device;
sin2(δ/2), where I0 is the maximum transmitted intensity. K33 is directly related to the threshold voltage of the homeotropic device;
 | (1) |
 | (2) |
 | (3) |
2.3 Calculations of the elastic constants
The elastic constants of compound 1 were calculated using a computational methodology based on a molecular field approach with atomistic modeling. This consists of three steps: (i) geometry parameters and torsional potentials are obtained from quantum chemical calculations for selected conformers of the whole molecule and for representative molecular fragments; (ii) Metropolis Monte Carlo (MC)25 sampling of the conformational space is performed, using the energy and geometry parameters determined in the previous step; (iii) orientational order parameters and elastic constants, calculated according to the Surface Interaction (SI) model,26 are obtained as averages over conformers. The whole procedure is described in detail in by Greco et al.27For the optimization of molecular geometries and the calculation of the torsional potential, density functional theory was used, with the B3LYP functional and 6-31G** basis set. The conformers of compound 1 were generated according to the Rotational Isomeric State (RIS) approximation.28Fig. 3 shows the molecular structure with the bonds that were allowed to rotate (χi), which are 27 in number. Structures having pairs of atoms closer than a cut-off distance equal to 0.82 σ, where σ is the sum of their van der Waals radii, were discarded in the calculations. van der Waals radii equal to 0.185 nm (C), 0.15 nm (N and O) and 0.1 nm (H) were assumed. In this way sterically hindered conformations were rejected, including those with adjacent gauche+, gauche− (or gauche−, gauche+) pairs in the hydrocarbon chains. For each conformer, the molecular surface was generated by the fast molecular surface calculation library29 assuming a rolling sphere radius equal to 0.3 nm and density of vertices equal to 5 Å−2. The same van der Waals radii used for the cut-off distance were assumed for the molecular surface calculations.
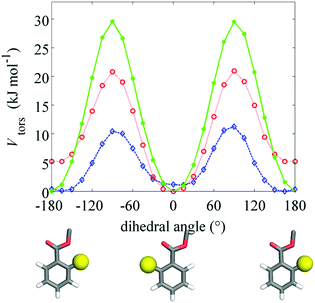
Compound 1 is similar to other compounds investigated in ref. 2 and 17, therefore most of the geometry and energy parameters used in step (ii) of the computational procedure are the same reported in the previous studies. The only important difference is the presence of the methyl and methoxy substituents in the ortho position of the benzoate rings. The effect of these substituents on the torsional potentials around the C–C–C![[double bond, length as m-dash]](https://www.rsc.org/images/entities/char_e001.gif) O dihedral angle of the ortho substituted benzoate group was investigated by DFT calculations. The results obtained by relaxed scans at the B3LYP/6-31G** level of the theory30 are shown in Fig. 6. We can see that, despite their hindrance, the methyl and methoxy groups do not modify the general shape of the torsional potential, which always exhibits two minima for planar configurations of benzoate, separated by barriers in correspondence of perpendicular geometries. The height of these barriers decreases with increasing the size of the substituents, but remains sufficiently high to let us assume that non-planar geometries must give a relatively low contribution to conformational averages. For this reason, in the sampling of conformers of compound 1 we assumed planar benzoate groups; for methoxy benzoate the C–C bond was allowed to jump between two equivalent configurations, with the substituent on either side of the carbonyl group. In the case of methyl benzoate, in view of the energy difference between the two minima of the torsional potential, a single planar conformer was assumed, with the methyl on the same side of the carbonyl group.
O dihedral angle of the ortho substituted benzoate group was investigated by DFT calculations. The results obtained by relaxed scans at the B3LYP/6-31G** level of the theory30 are shown in Fig. 6. We can see that, despite their hindrance, the methyl and methoxy groups do not modify the general shape of the torsional potential, which always exhibits two minima for planar configurations of benzoate, separated by barriers in correspondence of perpendicular geometries. The height of these barriers decreases with increasing the size of the substituents, but remains sufficiently high to let us assume that non-planar geometries must give a relatively low contribution to conformational averages. For this reason, in the sampling of conformers of compound 1 we assumed planar benzoate groups; for methoxy benzoate the C–C bond was allowed to jump between two equivalent configurations, with the substituent on either side of the carbonyl group. In the case of methyl benzoate, in view of the energy difference between the two minima of the torsional potential, a single planar conformer was assumed, with the methyl on the same side of the carbonyl group.
3 Results and discussion
3.1 The pure material, compound 1: comparison of measurements and calculations
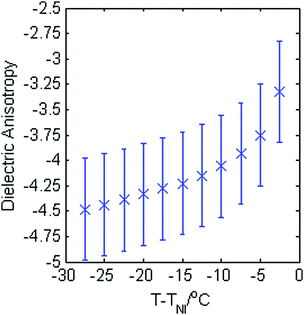
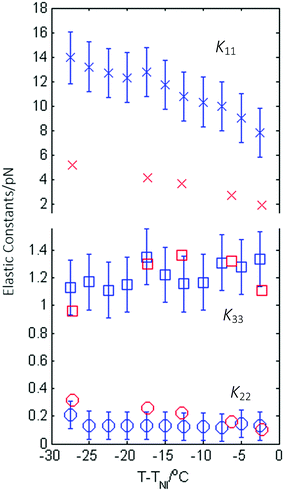
The magnitude of the dielectric anisotropy in compound 1 was found to increase as the temperature was reduced in the nematic phase regime, also becoming increasingly negative, as seen in Fig. 4. Such behaviour is similar to that determined in other oxadiazole based bent-core NLCs.17 The values of Δε were used in eqn (1)–(3) in deducing the elastic constants from measurements of the optical Freedericksz transition. Fig. 5 presents the experimentally determined values of K11, K22 and K33 together with values calculated computationally as a function of the temperature difference from TNI.The experimental data show that K11 takes values between ∼8–14 pN and increases in magnitude as the temperature decreases. This is common behaviour and has been observed in many calamitic and bent-core NLCs, though the values for compound 1 are higher than those for other bent-core NLCs which typically exhibit values between ∼3–9 pN.17 However, both K22 and K33 take extremely small values and are effectively temperature independent, which is very unusual. The absolute values measured for K22 and K33 in compound 1 are significantly lower (∼0.15 pN and ∼1.2 pN respectively) than the lowest values reported for almost all other NLCs. The only reports of lower values of K33 to our knowledge are very close to TNI in resorcinol-based bent core materials. Majumdar et al.10 found K33 ∼ 0.9 pN at T − TNI = −2 K in a chloro-substituted material while Tadapatri et al.11 reported strong temperature dependence of K33 with a value of ∼1 pN very close to TNI, increasing to ∼5 pN deeper in the nematic phase in a cyano-substituted material. Majumdar et al.10 also found K22 ∼ 0.3 pN at T − TNI = −2 K in their resorcinol based material, which is larger by a factor of 2 than the K22 values exhibited by compound 1. Our complete set of values for compound 1 shows very low K22 and K33 values across the whole nematic phase range, at temperatures as low as T − TNI = −27.5 K, together with clearly temperature independent behaviour. Although temperature-independent behaviour and small bend and twist elastic constants are also seen in compound 2 (K22 ∼ 0.4 pN and K33 ∼ 2.5 pN), other oxadiazole based bent-core NLCs (compounds 1–3 in ref. 17) again exhibit a significant variation in elastic constants across even a relatively narrow nematic range. Thus, the temperature-independent behaviour in both compounds 1 and 2 is unusual and of significant interest.
The calculated elastic constants for compound 1, also shown in Fig. 5, were determined on the basis of the molecular shape within the SI approach.26 The agreement with the experimental data is rather good; the temperature dependence of the splay elastic constant K11 is reproduced, though the calculated values are somewhat smaller, more in line with other oxadiazoles. The calculated values of K33 and are K22 are in excellent quantitative and qualitative agreement with the experimental values.
As already mentioned, the SI approach, was able to provide an explanation for the low bend elastic constant of bent mesogens, on the basis of the molecular shape. Thus, in comparing compound 1 with analogous mesogens with unsubstituted benzoates,17 the changes in molecular shape induced by the methyl and methoxy substituents have to be considered. Contrary to what might be expected, their presence does not seem to have a direct effect on the elastic constant of compound 1. In fact, according to DFT calculations, these substituents do not substantially modify the conformational preferences of the phenyl benzoate groups, as discussed in the section on computational details and demonstrated by additional calculations to be found in the linked data repository, https://doi.org/10.5518/207. Likewise, geometry optimizations by the same kind of calculations do not give indication of significant effects of the substituents on the geometry of the five-ring core. On the other hand, the presence of the two substituents causes a considerable decrease of the nematic–isotropic transition temperature, and this could have an indirect influence on the elastic constants, through a change in the conformer distribution, a point we return to later.
Fig. 7 shows the elastic constants calculated for compound 1, as a function of the orientational order parameter Szz, which quantifies the alignment of the z molecular axis (see Fig. 3) to the nematic director. Compared with other bent-core mesogens investigated in previous studies,17,25 here convergence of the elastic constants was very slow; the results showed in the figure were obtained by averaging over 1.5 million conformers. The slow convergence can be mainly ascribed to the length of the lateral chains of compound 1; the first consequence is that a large conformational space has to be sampled. Another, by far more relevant effect, is the magnification of the fluctuations of conformer shapes, which were observed also for bent-core mesogens bearing shorter chains, but to a smaller extent. This is particularly important for the bend elastic constant, as there are extended, approximately rod-like conformers, which give high positive contributions to K33, together with big bent conformers, which give strongly negative contributions, and extensive sampling is needed to obtain reliable averages.
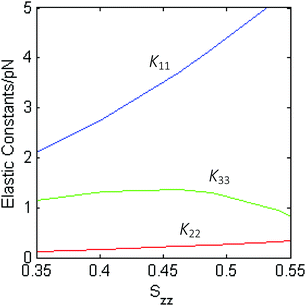 | ||
| Fig. 7 Elastic constants calculated for the nematic phase of compound 1 as a function of the orientational order parameter Szz, which quantifies the alignment of the z molecular axis (see Fig. 3) to the nematic director. | ||
In summary both the calculations and the experiment reveal values of both the twist and bend elastic constants that are unusually low and virtually temperature independent. Such behaviour has not been observed simultaneously in two elastic constants in any other NLC, whether calamitic or with a bent-core structure.
3.2 Mixtures of compound 1 and 2
Mixtures of compound 1 and 2 were created to investigate their elastic behaviour, specifically to determine if the small values of elastic constant persisted in mixtures. Indeed, while the study of mixtures is common in calamitic systems, it is largely unexplored in the nematic phases formed from bent-core compounds. Table 1 shows the composition of the mixtures of compounds 1 and 2 studied, along with their phase transition temperatures. The mixtures are denoted mixtures 1–5 for concentrations of 10%, 25%, 50%, 70% and 90% of compound 1 in compound 2 respectively.| Mixture number | Composition | Phase transitions T/°C |
|---|---|---|
| Mixture 1 | 10% compound 1 in compound 2 | Iso 224 N 164 OI 94 Cr |
| Mixture 2 | 25% compound 1 in compound 2 | Iso 200 N 144 OI 95 Cr |
| Mixture 3 | 50% compound 1 in compound 2 | Iso 190 N 140 SmX 90 Cr |
| Mixture 4 | 70% compound 1 in compound 2 | Iso 170 N 117 SmX 80 Cr |
| Mixture 5 | 90% compound 1 in compound 2 | Iso 140 N 100 SmX 70 Cr |
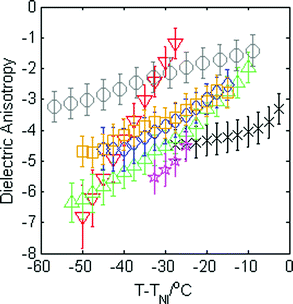
Measurements of the dielectric anisotropy and elastic constants were carried out on the mixtures using the same method described for compound 1. Fig. 8 shows the dielectric anisotropy as a function of T − TNI for the mixtures together with values for the pure compounds as a reference, assuming an uncertainty of ±0.5 in Δε. It can be seen that Δε for the mixtures is always relatively small and negative and generally lies in between the values measured for the two pure compounds, as might be expected. As with compound 1, the values of Δε shown in Fig. 8 were used in eqn (1)–(3) to calculate the elastic constants K11, K22, and K33 for each of the mixtures respectively. These elastic constant values are shown in Fig. 9 and are shown separately to provide a clear view of the relationship with T − TNI. As one would expect, all of the measurements of physical properties of the mixtures (dielectric anisotropy and elastic constants) lie between the values measured for the pure compounds 1 and 2. However, the differences in absolute values across the mixture set are relatively small and this fact, together with the relatively large uncertainties in our measurements means that there isn’t an experimentally significant difference between each data set. Nonetheless, we can say that the splay elastic constant, K11, of the mixtures follow a similar temperature dependence to that of the pure materials; the magnitude increases as the temperature increases. For the twist elastic constant K22, where the temperature dependence is practically non-existent in compound 1, we see more of a temperature dependence of K22 as more compound 2 is added to the mixture. For the bend elastic constant K33, where the values for the pure compounds were deemed to be effectively temperature independent, the values measured for the mixtures show a similar temperature independence.
Our results show that the very small and temperature-independent values of the bend and twist elastic constants are reproduced in mixtures with a high proportion of compound 1. Further, the calculations for compound 1 presented in Section 2.3 and Fig. 5 show excellent agreement with experimental data. However, as noted in the introduction, such behaviour of the elastic constants is not typical and current theory can explain neither the small values of elastic constant nor their lack of variation with temperature. We next present an extension to molecular field theory that can account for this unusual behaviour.
4 Molecular mean field theory
In the context of the molecular mean field theory, the difference between K11 and K33 is determined by the 4th order orientational order parameter 〈P4〉31,32 which is typically relatively small. Thus K11 is expected to be less than K33 but the difference not very large, which is indeed the case for most calamitic NLCs. Recently the strong reduction of K33 observed in bent-core NLCs just above the transition into the twist–bend phase, has been explained by the effect of polar intermolecular interactions between bent shaped molecules.3 From the phenomenological theory of the flexoelectric effect in bent-core NLCs,33 a coupling between local polarization and the bend deformation can lead to a negative correction (−eb2/2γ) to K33 that is proportional to the square of the bend flexocoefficient eb However, this correction can be significant only if the flexocoefficients are sufficiently large or the mean-field susceptibility γ is sufficiently small, i.e. the system is close to the virtual transition into the ferroelectric phase, which is in practice pre-empted by other transitions.Recently, the phenomenological theory of Selinger et al.,33 has been tested by Osipov and Pająk3 with the help of a molecular theory which enables one to calculate all elastic constants and the flexocoefficients using the same model interaction potential between bent-core molecules. It has been shown that the effective K33 is significantly reduced for a broad range of model parameters. A characteristic K33 profile, calculated numerically using eqn (57)–(59) from ref. 3 is presented in Fig. 10, where reduced temperature is given by τ = (t − tNI)/tNI. One can readily see that, similar to our experimental data, the effective K33 is very weakly temperature dependent and is a few times smaller than K11. Very recently it has been shown that this reduction mechanism is more general and is not restricted to flexoelectricity or to strongly polar molecules.31,34 In fact, it is the polar molecular shape that is mostly important as it always leads to some polar interactions and polar corrections to the orientational distribution function which determine some negative correction to the elastic constant. The absolute value of this correction, however, is very sensitive to the molecular parameters which are different for different compounds which explains why a dramatic reduction of K33 compared to K11 is observed only in some nematic materials. While the reduction in K33 with respect to K11 is well-established for bent-core NLCs, all other reports show only a factor of two or three difference in the values.
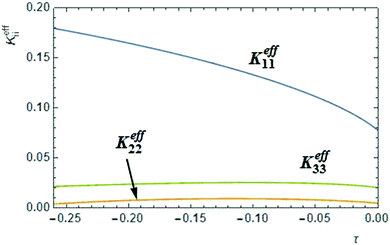 | ||
| Fig. 10 Theoretical profiles of the splay, twist and bend elastic constants in compound 1, calculated as functions of the reduced temperature taking into account the effect of chiral fluctuations and polar interactions of the bent-core molecules. The effective splay and bend constants were calculated using eqn (57)–(59) from ref. 3 for ε = 75, l = 2.5d, α = 30° and ψ = 0.009 (all parameters in this caption are as defined in ref. 3). The twist elastic constant for a bent-core molecule with the same opening angle (120°) is obtained from eqn (6) with A = 1/120 and tC = 0.05. | ||
The reduction of the twist elastic constant K22 has not been considered in the literature before. Theoretical results based on atomistic modelling presented above indicate that the anomalously small values of K22 may be related to enhanced flexibility of the oxadiazole compounds. In general bent-core molecules are known to be flexible and most of the conformational states are strongly chiral.35 This observation leads us to suggest that it may be interesting to consider a simple semiphenomenological model of a bent-core nematic that can locally exist in two states of the opposite chirality. These states can be rotamers, conformers or chiral molecular ensembles. In the equilibrium nematic phase the probability of these opposite states is the same and the system in nonchiral. At the same time there are chiral fluctuations in time and space which may renormalise the twist elastic constant in a similar way as polar fluctuations in a nonpolar nematic renormalise the bend elastic constant. In this case the free energy of the corresponding NLC is expressed as:
 | (4) |
 | (5) |
 | (6) |
 is a critical temperature. The effective constant Keff22 will become sufficiently small only if the second term in eqn (6) is large i.e. if ρ0ΔU is large enough to be close to 2kT, and if μ is also large. As already mentioned,35 some conformational states of bent-core molecules are strongly chiral and chiral molecular ensembles may possess even stronger chirality (see ref. 7 and 8). This may lead to large values of μ and ΔU, an effect that could be amplified in compound 1 by the lateral chains. One notes also that in compound 1, the nematic phase occurs about 100 degrees lower in temperature than compound 2 and the associated oxadiazole family17 which means that kT is smaller and the difference kTρ0 − ρ02ΔU/2 in eqn (6) is further reduced. In this case the negative correction to K22 is expected to be strongly temperature dependent, which can lead to an overall weak temperature dependence of Keff22. A characteristic profile of Keff22 is presented in Fig. 10 using the profile of the unrenormalised constant K22 from ref. 3 and assuming for simplicity that A = A0S. One can readily see that K22 is very low and practically temperature independent in accordance with our experiments. The ‘unrenormalised K22’ is equivalent to the ‘bare K33’ in ref. 3. It is unlikely that either of these phenomena (larger μ or lower temperature) alone can account for anomalously low K22.
5 Conclusions
In conclusion, the splay, twist and bend elastic constants of an oxadiazole-based bent-core NLC and its mixtures have been reported. In the pure material, compound 1, the splay constant was found to be rather high and to exhibit a normal temperature dependence, the twist and bend constants are anomalously small and are almost temperature independent throughout the whole nematic phase range. As far as we are aware, such unusual, simultaneous behaviour of both bent and twist constants has been observed neither in other bent-core NLCs nor in other types of NLCs. The behaviour of the elastic constants has been investigated further using two theoretical approaches: a molecular theory based on atomistic simulations of the real molecular structure of the oxadiazole compound including its conformations, and an analytical mean-field theory which explicitly takes into account polar intermolecular interactions between bend shaped molecules.Atomistic modelling was carried out to calculate the elastic constants of compound 1, showing excellent agreement with the experimental data for both the twist and bend constants. Whilst the absolute values of the calculated and experimental results differ for the splay constant, both sets of data exhibit similar temperature dependence. In the context of the qualitative mean-field theory the reduction of the bend constant is related to the existence of the local polar order of bent-core molecules which is linearly coupled to the bend deformation vector. This coupling reduces the free energy and results in a negative correction to the bend constant, which may be sufficiently large for bent-core NLCs. The reduction in the bend constant is common in bent-core NLCs. However, we additionally show that in a similar way, the free energy is reduced when the fluctuations in the population of the two local states of the opposite chirality is linearly coupled to the fluctuating twist. This yields a negative correction to the twist elastic constant which may be large if the bent-core nematic possesses strongly chiral local states. The results of the theory have been used to calculate the profiles of the elastic constants, which agree qualitatively with our experimental data.
This new theoretical approach also gives insight into the low values of twist elastic constant that have been reported for other oxadiazole systems.17 In that work K22 took values of ∼1.2 pN and the temperature dependence was rather weak; a variation from 0.4–1.0 pN in one system and from 0.4–1.2 pN in the other three considered. This is a weaker temperature dependence than seen for K11 which varied by a factor of 4 or 5 across the temperature range for each of the materials. Although the magnitude of the negative correction to K22 will depend on the material, the correction always leads to a weaker temperature variation of K22 that that of K11 in relative terms.
Mixtures of compounds 1 and 2 were created. The elastic constants and dielectric anisotropy of the mixtures lie between the values for the two pure compounds. The mixtures exhibit a similar temperature dependence to the pure compounds for the splay constant K11 as well as a similar temperature independence for the bend constant K33. Interestingly for the twist constant K22, the mixtures exhibited a more marked temperature dependence as increasing amounts of compound 2 were added to the mixture.
Understanding the mechanisms for the dramatic reduction in the twist elastic constant is important. It is widely accepted that a reduction and vanishing of the bend elastic constant may induce a transition into the twist–bend phase, which is locally polar. In a similar way vanishing of the twist constant may induce a spontaneous chiral symmetry-breaking when the system is split into macroscopic chiral domains of the opposite handedness, as observed in compound 2 and other oxadiazole NLCs at low temperatures.5,8 This may provide a long-awaited explanation of why many similar non-chiral bent-core materials exhibit chiral SmC*-like phases or the dark conglomerate phase, which are also composed of chiral domains.
Conflicts of interest
There are no conflicts to declare.Acknowledgements
This work was supported by the Engineering and Physical Sciences Research Council (EP/N509243). SS thanks the EPSRC and Merck for funding a studentship. GP acknowledges support of Cracowian Consortium ‘“Materia-Energia-Przyszłość” im. Mariana Smoluchowskiego’ within the KNOW grant and partly Grant No. DEC-2013/11/B/ST3/04247 of the National Science Centre in Poland.References
- S. Kaur, V. P. Panov, C. Greco, A. Ferrarini, V. Görtz, J. W. Goodby and H. F. Gleeson, Appl. Phys. Lett., 2014, 105, 223505 CrossRef.
- J. Addis, S. Kaur, D. J. Binks, M. R. Dickinson, C. Greco, A. Ferrarini, V. Görtz, J. W. Goodby and H. F. Gleeson, Liq. Cryst., 2016, 43, 1315 CrossRef CAS.
- M. A. Osipov and G. Pająk, Eur. Phys. J. E: Soft Matter Biol. Phys., 2016, 39, 45 CrossRef CAS PubMed.
- C.-J. Yun, M. R. Vengatesan, J. K. Vij and J.-K. Song, Appl. Phys. Lett., 2015, 106, 173102 CrossRef.
- M. Nagaraj, K. Usami, Z. Zhang, V. Görtz, J. W. Goodby and H. F. Gleeson, Liq. Cryst., 2014, 41, 800 CrossRef CAS.
- M. Nagaraj, J. C. Jones, V. P. Panov, H. Liu, G. Portale, W. Bras and H. F. Gleeson, Phys. Rev. E: Stat., Nonlinear, Soft Matter Phys., 2015, 91, 042504 CrossRef PubMed.
- V. Görtz and J. W. Goodby, Chem. Commun., 2005, 3262 RSC.
- V. Görtz, C. Southern, N. W. Roberts, H. F. Gleeson and J. W. Goodby, Soft Matter, 2009, 5, 463 RSC.
- P. Sathyanarayana, M. Mathew, Q. Li, V. S. S. Sastry, B. Kundu, K. V. Le, H. Takezoe and S. Dhara, Phys. Rev. E: Stat., Nonlinear, Soft Matter Phys., 2010, 81, 010702 CrossRef CAS PubMed.
- M. Majumdar, P. Salamon, A. Jákli, J. T. Gleeson and S. Sprunt, Phys. Rev. E: Stat., Nonlinear, Soft Matter Phys., 2011, 83, 031701 CrossRef CAS PubMed.
- P. Tadapatri, U. S. Hiremath, C. V. Yelamaggad and K. S. Krishnamurthy, J. Phys. Chem. B, 2010, 114, 1745 CrossRef CAS PubMed.
- P. S. Salter, C. Tschierske, S. J. Elston and E. P. Raynes, Phys. Rev. E: Stat., Nonlinear, Soft Matter Phys., 2011, 84, 031708 CrossRef CAS PubMed.
- R. Balachandran, V. P. Panov, J. K. Vij, A. Lehmann and C. Tschierske, Phys. Rev. E: Stat., Nonlinear, Soft Matter Phys., 2013, 88, 032503 CrossRef CAS PubMed.
- A. Chakraborty, M. K. Das, B. Das, A. Lehmann and C. Tschierske, Soft Matter, 2013, 9, 4273 RSC.
- N. Avci, V. Borshch, D. D. Sarkar, R. Deb, G. Venkatesh, T. Turiv, S. V. Shiyanovskii, N. V. S. Rao and O. D. Lavrentovich, Soft Matter, 2013, 9, 1066 RSC.
- S. Kaur, L. Tian, H. Liu, C. Greco, A. Ferrarini, J. Seltmann, M. Lehmann and H. F. Gleeson, J. Mater. Chem. C, 2013, 1, 2416 RSC.
- S. Kaur, H. Liu, J. Addis, C. Greco, A. Ferrarini, V. Görtz, J. W. Goodby and H. F. Gleeson, J. Mater. Chem. C, 2013, 1, 6667 RSC.
- S. Kaur, J. Addis, C. Greco, A. Ferrarini, V. Görtz, J. W. Goodby and H. F. Gleeson, Phys. Rev. E: Stat., Nonlinear, Soft Matter Phys., 2012, 86, 041703 CrossRef CAS PubMed.
- V. Borshch, Y.-K. Kim, J. Xiang, M. Gao, A. Jákli, V. P. Panov, J. K. Vij, C. T. Imrie, M. G. Tamba, G. H. Mehl and O. D. Lavrentovich, Nat. Commun., 2013, 4, 2635 CAS.
- K. Adlem, M. Čopič, G. R. Luckhurst, A. Mertelj, O. Parri, R. M. Richardson, B. D. Snow, B. A. Timimi, R. P. Tuffin and D. Wilkes, Phys. Rev. E: Stat., Nonlinear, Soft Matter Phys., 2013, 88, 022503 CrossRef CAS PubMed.
- H. F. Gleeson, S. Kaur, V. Görtz, A. Belaissaoui, S. Cowling and J. W. Goodby, ChemPhysChem, 2014, 15, 1251 CrossRef CAS PubMed.
- H. Allinson, PhD thesis, University of Manchester, 1994 Search PubMed.
- H. Gruler, T. J. Scheffer and G. Meier, Z. Naturforsch., 1972, 27a, 966 Search PubMed.
- M. Oh-e and K. Kondo, Appl. Phys. Lett., 1996, 69, 623 CrossRef CAS.
- N. Metropolis, A. W. Rosenbluth, M. N. Rosenbluth, A. H. Teller and E. Teller, J. Chem. Phys., 1953, 21, 1087 CrossRef CAS.
- M. Cestari, A. Bosco and A. Ferrarini, J. Chem. Phys., 2009, 131, 054104 CrossRef PubMed.
- C. Greco, A. Marini, E. Frezza and A. Ferrarini, ChemPhysChem, 2014, 15, 1336 CrossRef CAS PubMed.
- P. W. Flory, Statistical Mechanics of Chain Molecules, Wiley-Interscience, New-York, 1969 Search PubMed.
- M. F. Sanner, J. C. Spehner and A. J. Olson, Biopolymers, 1996, 38, 305 CrossRef CAS PubMed.
- M. J. Frisch, et al., Gaussian 09 (Revision B.01), Gaussian, Inc., Wallingford CT, 2010 Search PubMed.
- M. A. Osipov and G. Pająk, Liq. Cryst., 2017, 44, 58 CAS.
- M. A. Osipov and S. Hess, Mol. Phys., 1993, 78, 1191 CrossRef CAS.
- S. M. Shamid, S. Dhakal and J. V. Selinger, Phys. Rev. E: Stat., Nonlinear, Soft Matter Phys., 2013, 87, 052503 CrossRef PubMed.
- C. Greco, G. R. Luckhurst and A. Ferrarini, Soft Matter, 2014, 10, 9318 RSC.
- D. J. Earl, M. A. Osipov, H. Takezoe, Y. Takanishi and M. R. Wilson, Phys. Rev. E: Stat., Nonlinear, Soft Matter Phys., 2005, 71, 021706 CrossRef PubMed.
Footnote |
| † The source data for this publication can be found at DOI: http://doi.org/10.5518/207 |
| This journal is © The Royal Society of Chemistry 2018 |

