
 Open Access Article
 This Open Access Article is licensed under a Creative Commons Attribution-Non Commercial 3.0 Unported Licence
Thermal behaviour of dicarboxylic ester bithiophene polymers exhibiting a high open-circuit voltage†
Ruurd
Heuvel
a,
Fallon J. M.
Colberts
a,
Martijn M.
Wienk
ab and
René A. J.
Janssen
 *ab
*ab
aMolecular Materials and Nanosystems & Institute for Complex Molecular Systems, Eindhoven University of Technology, P.O. Box 513, 5600 MB Eindhoven, The Netherlands. E-mail: r.a.j.janssen@tue.nl
bDutch Institute for Fundamental Energy Research, De Zaale 20, 5612 AJ Eindhoven, The Netherlands
First published on 26th October 2017
Abstract
Nine different polythiophene derivatives based on dialkyl-(2,2′-bithiophene-5,5′-diyl)-4,4′-dicarboxylate (DCB) alternating with thiophene (T), bithiophene (2T) or thienothiophene (TT) as co-monomer have been synthesized to study the effect of the polymer backbone and side chain length on the thermal properties, the tendency to aggregate, and the photovoltaic performance. Polymers incorporating DCB and 2T show increased crystallinity and a large effect of the side chain length on the morphology of the photoactive layer blends. Thermal annealing increases the crystallinity of the polymers and enhances the long-wavelength light absorption. The concomitant increase in polymer fibre width, however, deteriorates the photovoltaic performance. The best devices were made using the PDCB-2T polymer with 2-butyloctyl side chains providing a power conversion efficiency of 5.18%. The PDCB-T polymer with 2-ethylhexyl substituents shows a comparable efficiency (5.08%), but with a significantly higher open-circuit voltage due to deeper frontier orbitals levels.
Introduction
Since the early 1990s, organic solar cells based on active layers consisting of conjugated polymer donors and fullerene acceptors have been considered for renewable energy applications.1–4 Strong light absorption by the polymer5,6 permitted the fabrication of thin film devices, leading to flexible, lightweight and low-cost solar cells.7–9 Photovoltaic performance has been increasing in leaps and bounds over the past two decades and recently power conversion efficiencies (PCEs) have been reported in excess of 10% using fullerene acceptors10–13 and over 11% using non-fullerene acceptors.14–16 In most cases, the large jumps in efficiency have coincided with the development of new donor–acceptor copolymers, and lately with the advance of efficient non-fullerene acceptors.14–16 Conjugated polymers based on the donor–acceptor paradigm offer a high degree of freedom in tuning the energy levels of the highest occupied (HOMO) and lowest unoccupied (LUMO) molecular orbitals and consequently also the optical bandgap (Eg).17–20With increasing efficiencies, performances are moving towards thresholds for application and theoretical limits.21 The development of multi-junction solar cells is becoming important as a viable way to surpass these limits.22 For high performance multi-junction solar cells, there is not only a need for well-performing low (Eg < 1.4 eV23–29) and medium (Eg = 1.4–1.7 eV10–12) bandgap polymers, which have both been the subject of many studies, but also wide bandgap polymers (Eg > 1.7 eV) need to be developed to ensure complete spectral overlap with minimum photon energy loss and parasitic absorption. One of the important benefits of wide bandgap polymers is their potential to generate high voltages as a direct consequence of their large optical bandgap. However, attaining these high voltages has been the main challenge for wide bandgap polymers, because presently many of these are hampered by comparatively high photon energy losses. By carefully tuning the HOMO and LUMO energy levels, the energy offset with a fullerene or alternative electron acceptor can be minimized while retaining the offset required for exciton separation.30 In this way, the photon energy loss might be reduced,31–35 thereby increasing the open-circuit voltage (Voc) with minimum penalty in terms of short-circuit current density (Jsc).
Polythiophene and especially poly(3-hexylthiophene) (P3HT) as advanced by Wudl et al. in the 1980's,36,37 has become the workhorse in polymer field-effect transistors and in polymer solar cells as a wide bandgap (Eg = 1.9 eV) absorber.38–40 P3HT is semi-crystalline and has a correspondingly high charge carrier mobility. In combination with Wudl's [6,6]-phenyl-C61-butylric acid methyl ester (PC61BM) electron acceptor,41 P3HT has become the most studied donor material for polymer solar cells. The PCE of P3HT-PC61BM solar cells is mainly limited by a comparatively low Voc (0.6 V) as a consequence of the low oxidation potential of P3HT. The cell has a photon energy loss (Eg − qVoc) of well over 1 eV, which exceeds the minimal loss of ∼0.6 eV thought to be sufficient for efficient current generation. Although the Voc of P3HT based solar cells can be increased by employing fullerene bis-adducts as acceptors with more negative reduction potentials, the tunability of such systems is limited.42,43
Homopolymer P3HT lacks the donor–acceptor motif that would enable controlling the oxidation potential and thereby Voc.44,45 However, the oxidation potential of polythiophenes can be increased by using electron-withdrawing ester side chains.46 As a result, the Voc can be increased.47 Significant progress was made by the introduction of dicarboxylic bithiophene polymers (PDCBT), which exhibit a high Voc of 0.91 V and a PCE up to 7.2%,48 in combination with [6,6]-phenyl-C71-butylric acid methyl ester (PC71BM). We note that for the same material, also a lower Voc of 0.80 V has been reported more recently.49 Such variation may be related to the fact that the energy levels, bandgap and performance of polythiophenes can differ depending on the degree of aggregation, which is affected by the molecular weight, regioregularity and the processing conditions.50,51 Numerous methods have been used to ensure proper organization, aggregation and crystallization of conjugated polymers in bulk heterojunction blend layers, ranging from the use of co-solvents to pre-aggregation by solution aging or the addition of additives,49 including peroxides.52 Established ways of ensuring aggregation are slow drying, hot solution processing53 and solvent or thermal annealing (TA).54
Here, we investigate the effect of backbone and side chain length on the energetics, thermal and aggregation behaviour and crystallinity of polythiophenes based on dialkyl-(2,2′-bithiophene-5,5′-diyl)-4,4′-dicarboxylate (DCB) with thiophene (T), bithiophene (2T) or thienothiophene (TT) as co-monomers to control energy levels with 2-ethylhexyl (EH), 2-butyloctyl (BO) or 2-hexyldecyl (HD) side chains to influence the tendency to aggregate (Scheme 1). A total of nine different polymers have been synthesized for which we correlate aggregation, thermal behaviour, film formation and morphology with photovoltaic performance.
 | ||
| Scheme 1 Synthesis routes towards 2-ethylhexyl (EH), 2-butyloctyl (BO) and 2-hexydecyl (HD) substituted dicarboxylic ester bithiophene monomers (DCB) (top) and polymerization conditions for all nine combinations of monomers M1–M3 and thiophene (T), bithiophene (2T) and thienothiophene bistannyl monomers (TT) (bottom). | ||
Results and discussion
The synthesis of the monomers M1–M3 (Scheme 1) started with the procedure reported by Hou et al.47 However, poor regioselectivity during the final bromination step and challenging purification, especially for the longer side chain derivatives, called for a change in the synthesis route (Scheme 1). In the new approach, 5-bromo-3-carboxylic acid (2) was protected as a methyl ester, rather than functionalizing with a long, branched side chain. Dimerization was then carried out in a Suzuki type fashion using bis(pinacolato)diboron. The resulting bithiophene (4) was brominated resulting in the highly versatile monomer precursor 5, which was easily purified by column chromatography and recrystallization. Monomers M1–M3 could then be obtained in very high purity and with near quantitative yield via a transesterification reaction using oxo[hexa(trifluoroacetato)]tetrazinc (ZnTAC24)55,56 and 4-dimethylaminopyridine (DMAP).57 Co-polymerization of monomers M1–M3 with the distannyl derivatives of thiophene, bithiophene and thienothiophene was done in Stille-type polycondensation reactions and afforded a total of nine polymers. Purification of the polymers was carried out by precipitation in methanol, followed by treatment with ethylenediaminetetraacetic acid (EDTA) to remove any residual palladium, and Soxhlet extraction.The newly synthesized polymers show reasonable to good molecular weights as determined using high-temperature (140 °C) gel permeation chromatography (GPC) in o-dichlorobenzene (oDCB) (Table 1). The poor solubility of the PDCB-TT-EH polymer even at high temperature prohibited determining the molecular weight. All other polymers were sufficiently soluble under these conditions and showed no signs of aggregation using an in-line UV-vis detector. The polymers containing thiophene as co-monomer show somewhat reduced molecular weights with respect to the others. Increased steric effects due to the smaller co-monomer can limit the reaction rate in the polymerization and increase the likelihood of introducing (smaller) terminating groups. Furthermore, a lower number of fractions during Soxhlet purification, caused by a higher solubility, increases the yield of the highest molecular weight fraction. The increased polydispersity index (PDI) of PDCB-T-EH is caused by a low molecular weight tail in the GPC. The high PDI of PDCB-2T-EH is probably caused by the low solubility of the polymer, resulting in a less well defined material.
| Yield (%) | M n [kDa] | M w [kDa] | PDIa | E g [eV] | HOMOc [eV] | LUMOc [eV] | |
|---|---|---|---|---|---|---|---|
| a GPC versus polystyrene standards in oDCB at 140 °C. b Low energy absorption onset from pristine polymer thin film spectrum, spin coated from a 6 mg mL−1 solution in chloroform at 2000 rpm. c Cyclic voltammetry of thin polymer films on ITO, using 0.1 M TBA+PF6− solution in acetonitrile as electrolyte and versus Fc/Fc+ as external standard; EHOMO/LUMO = −q(Eox/red + 5.23). | |||||||
| PDCB-T-EH | 86 | 19.0 | 102 | 5.36 | 1.96 | −5.75 | −3.40 |
| PDCB-T-BO | 81 | 17.9 | 53.1 | 2.96 | 1.95 | −5.81 | −3.40 |
| PDCB-T-HD | 88 | 25.8 | 81.3 | 3.16 | 2.05 | −6.00 | −3.42 |
| PDCB-2T-EH | 78 | 43.8 | 226 | 6.07 | 1.87 | −5.63 | −3.40 |
| PDCB-2T-BO | 78 | 34.8 | 69.2 | 1.99 | 1.90 | −5.55 | −3.30 |
| PDCB-2T-HD | 75 | 35.5 | 94.7 | 2.67 | 1.91 | −5.76 | −3.30 |
| PDCB-TT-EH | 53 | Ins. | Ins. | Ins. | 1.85 | −5.95 | −3.38 |
| PDCB-TT-BO | 58 | 54.9 | 158 | 2.88 | 2.16 | −5.84 | −3.35 |
| PDCB-TT-HD | 67 | 52.3 | 127 | 2.42 | 2.02 | −5.85 | −3.30 |
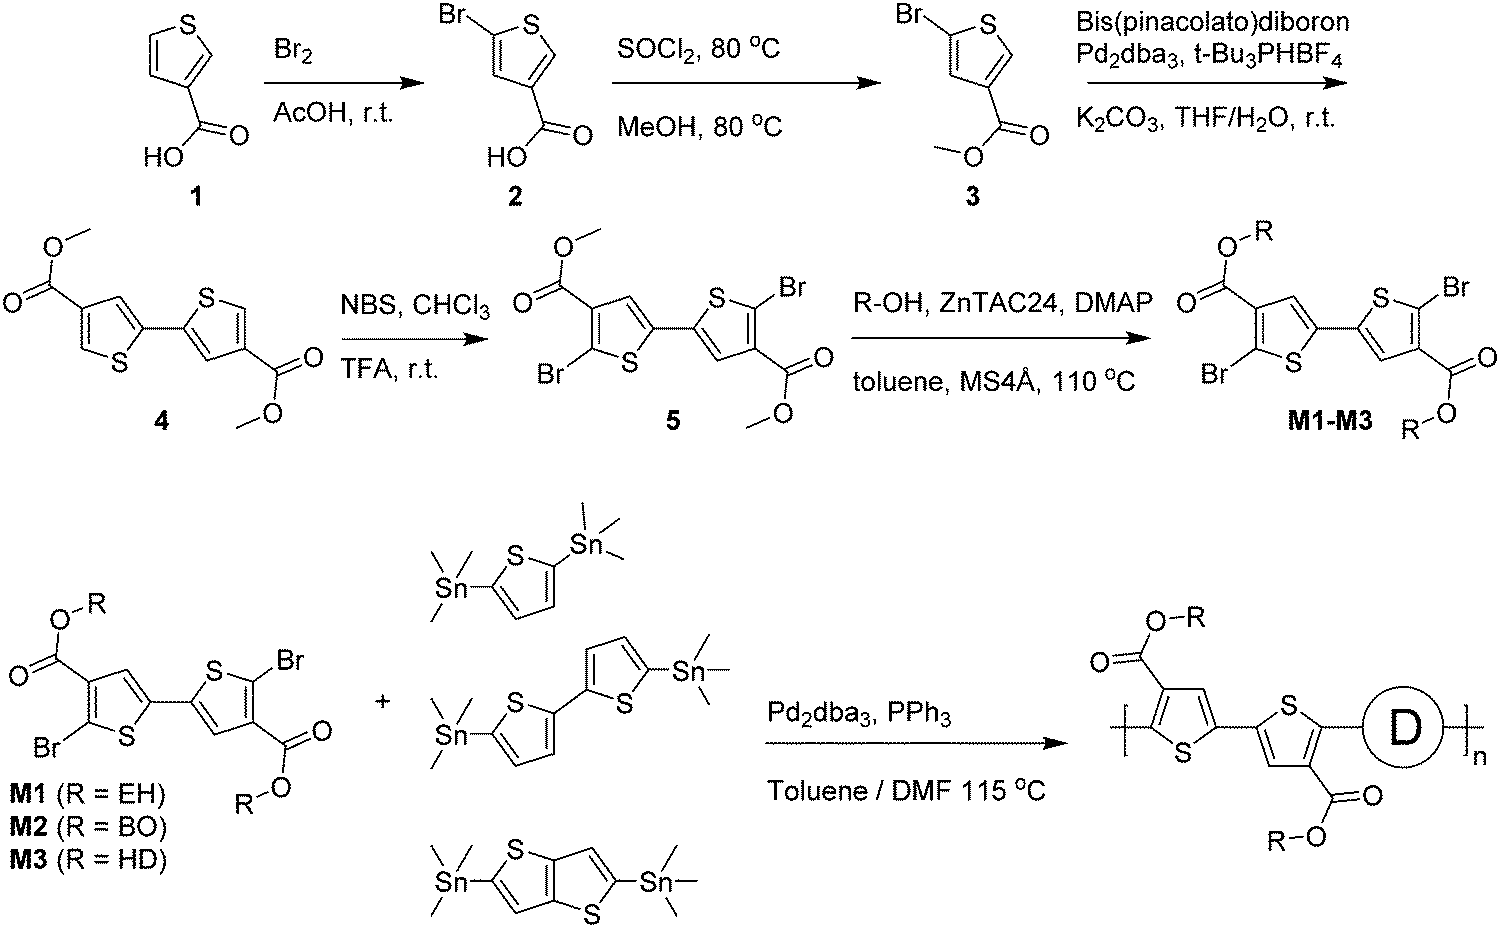
Optical absorption spectra recorded in chloroform solution (Fig. 1) show a single absorption band at room temperature originating from π–π* transitions58,59 for most polymers, except for those of PDCB-2T-EH and PDCB-TT-EH. The latter two are sparsely soluble under these conditions and show extensive aggregation, evidenced by a long-wavelength vibronically-structured absorption band.60 With polymer chains being more ordered in their aggregated state, the additional spectral features arise from an increased effective conjugation length due to a higher degree of order and stronger π stacking interactions. The three T-based polymers show overlapping absorption spectra that are blue-shifted compared to the TT-based polymers. Extended conjugation and a more pronounced donating character of the co-monomer increases delocalization and the intramolecular charge transfer character of the π–π* transition. Furthermore, the 2T-based polymers have a slightly blue-shifted absorption maximum with respect to the TT-based polymers due to the higher degree of freedom in the thiophene–thiophene bond.
 | ||
| Fig. 1 (a) UV-vis spectra of PDCB polymers in chloroform solution. (b) Temperature dependent UV-vis spectra of PDCB-2T-EH in oDCB. | ||
Spin coating from hot solution can be an effective way of controlling the moment of polymer aggregation and thereby the morphology of the resulting layer.52 To better understand the behaviour of the polymers in solution at elevated temperatures, temperature dependent UV-vis absorption spectra were measured in oDCB solution. A typical example (PDCB-2T-EH) of the temperature dependent studies in oDCB solution is shown in Fig. 1b. Two other examples (PDCB-2T-BO and PDCB-TT-EH) are depicted in the ESI† (Fig. S1). A summary of the temperature dependent UV-vis data is collected in Table 2. The majority of the PDCB polymers are molecularly dissolved in oDCB at room temperature. At elevated temperature, these polymers show a slight blue shift and a decrease of the absorption maximum due to backbone twisting and solvent expansion, respectively. PDCB-2T-BO shows a transition to the aggregated state after cooling the solution to 10 °C. PDCB-2T-EH shows a similar transition, but already at an elevated temperature between 60 and 70 °C. For the least soluble material, PDCB-TT-EH, a significant portion of the polymer remains aggregated even at 100 °C. These results suggest increased π-stacking interactions between the bithiophene and thienothiophene polymers with respect to the thiophene containing polymers.
| 1st λmax [nm] (oDCB) | E g [eV] (film) | Temperature | Enthalpy | |||||
|---|---|---|---|---|---|---|---|---|
| 10 °C | 100 °C | Pristine | TAa | T m [°C] | T f [°C] | ΔHm [J g−1] | ΔHf [J g−1] | |
| a Thermally annealed at 120 °C for 10 min. | ||||||||
| PDCB-T-EH | 477 | 462 | 1.94 | 1.92 | 232 | 198 | 8.0 | 9.3 |
| PDCB-T-BO | 478 | 462 | 1.95 | 1.92 | (98) 136 | (76) 127 | (3.9) 7.4 | (3.6) 8.0 |
| PDCB-T-HD | 476 | 461 | 2.08 | 2.07 | 75 | 48 | 2.9 | 0.8 |
| PDCB-2T-EH | 607 | 477 | 1.86 | 1.88 | >300 | 270 | — | — |
| PDCB-2T-BO | 599 | 478 | 1.91 | 1.91 | 282 | 260 | 17 | 20 |
| PDCB-2T-HD | 497 | 478 | 1.93 | 1.92 | 227 | 197 | 10 | 10 |
| PDCB-TT-EH | 619 | 615 | 1.82 | 1.82 | >300 | >300 | — | — |
| PDCB-TT-BO | 486 | 476 | 2.07 | 1.90 | >300 | >300 | — | — |
| PDCB-TT-HD | 509 | 476 | 1.94 | 1.89 | 275 | 247 | 4.5 | 11 |
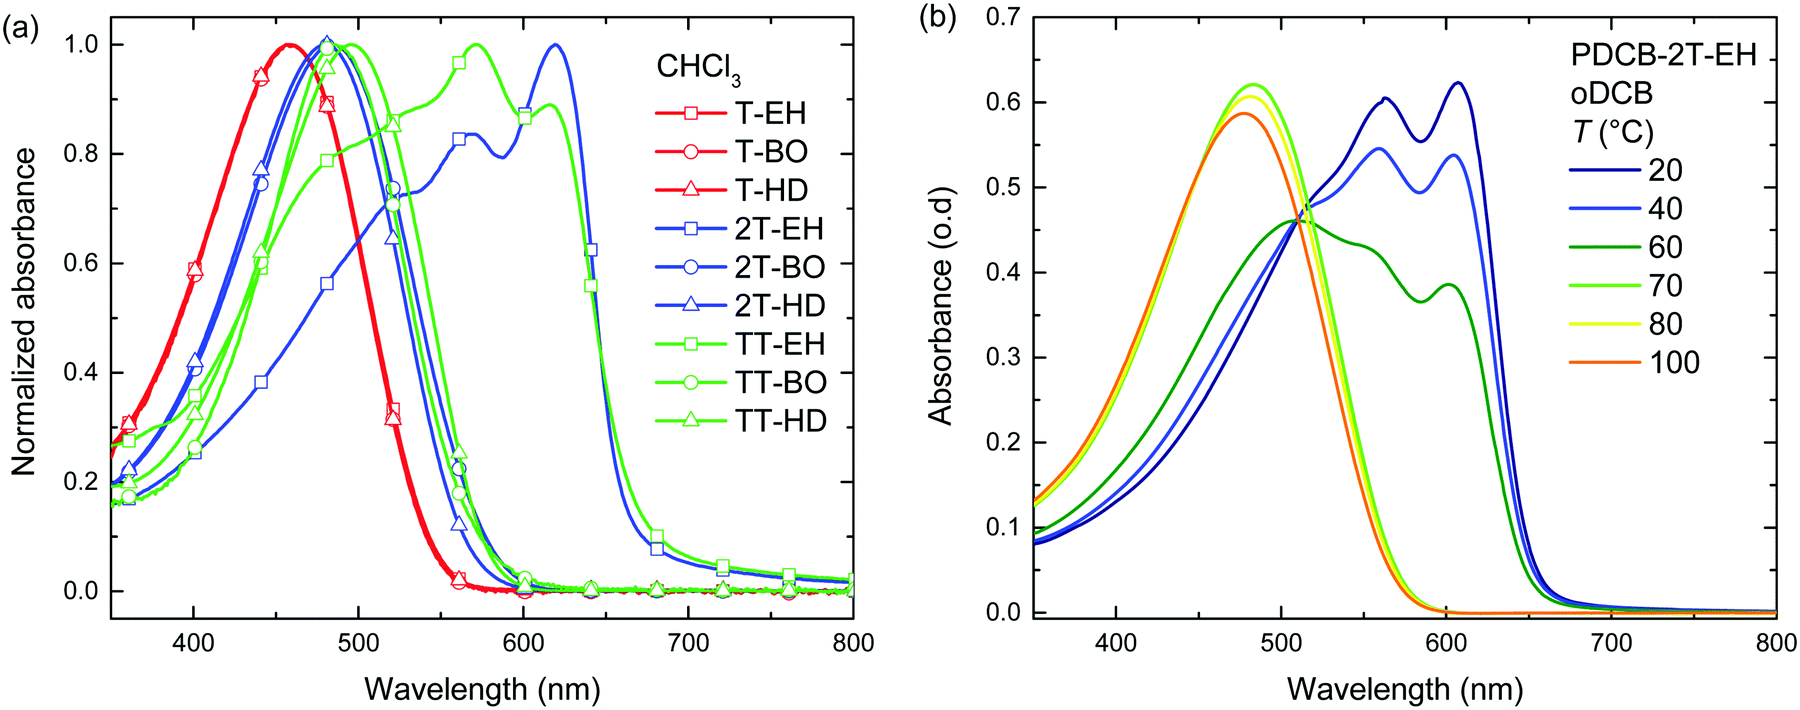
A similar trend can be seen in the thin film absorption spectra (Fig. 2), for layers spin coated from chloroform solution. In addition to the co-monomer trend, a side chain trend can also be seen. Polymers with longer side chains show more blue-shifted absorption maxima and onsets than those with shorter side chains. Apparently, the higher fraction of branched alkyl chain content in the film disrupts interchain interactions and three-dimensional ordering and thereby effective conjugation length. Consequently, the PDCB-T-HD polymer shows the highest optical bandgap suggesting that it is the most amorphous polymer, whereas PDCB-TT-EH is extremely aggregated and shows the lowest bandgap. PDCB-TT-BO does not follow the observed trend; both in solution and in thin film, the optical absorption is blue-shifted compared to that of PDCB-TT-EH and PDCB-TT-HD, for reasons that we do not understand at present. X-ray diffraction patterns of PDCB-TT-EH and PDCB-TT-BO films did not reveal significant differences between these two, except for the lamellar spacing, which is larger (20.0 vs. 17.2 Å) for the BO derivative compared to the EH polymer (Fig. S2, ESI†). In general, these results show that by varying the co-monomer and side chain length, control can be exerted over the optical properties of this type of polymer. Furthermore, the 2T-based polymers show on average a smaller bandgap and a less pronounced side chain effect. This confirms the previous observation related to the bithiophene co-monomer providing more aggregation to the polymer.
 | ||
| Fig. 2 (a) Optical absorption of PDCBT polymer thin films cast from chloroform. (b) Optical absorption spectra after thermal annealing of a PDCB-TT-BO film. The annealing temperature is shown in the legend, all spectra were recorded at room temperature after thermal annealing. | ||
Annealing at elevated temperatures is a known way for polythiophenes to increase crystallinity and thereby increase the long-wavelength absorption of light.53 Thermal annealing at different temperatures was performed on both pristine (Fig. 2 and Fig. S3, ESI†) and blend films with PC71BM (Fig. S4, ESI†) for 10 min, after which UV-vis absorption was recorded at room temperature. Results for the pristine film are summarized in Table 2. Several polymers (PDCB-2T-EH, PDCB-TT-EH, and PDCB-2T-BO) were already aggregated after spin coating and few changes were observed in the UV-vis spectra upon thermal treatment. The PDCB-T-HD polymer remained in a non-aggregated state after thermal annealing at high temperatures. However, three interesting cases presented themselves as significant changes could be seen with PDCB-T-BO, PDCB-TT-BO, and PDCB-TT-HD. The spectra of pristine PDCB-TT-BO shown in Fig. 2b reveal that thermal annealing to temperatures above 150 °C is necessary to bring the polymer from a non-ordered to an ordered state. This is confirmed by more intense reflections in the X-ray diffractogram (Fig. S2, ESI†). For PDCB-T-BO and PDCB-TT-HD, the results are very similar but the transition occurs at a significantly lower temperature (∼100 °C). For PDCB-T-BO, increased aggregation was observed with annealing up to 120 °C. Higher temperatures decreased the degree of aggregation (Fig. S3a, ESI†). In blends with PC71BM (polymer![[thin space (1/6-em)]](https://www.rsc.org/images/entities/char_2009.gif) :fullerene weight ratio 1:1.5), the polymers show the same trends and no significant influence of PC71BM can be seen on the aggregation behaviour of the polymers. In a few cases, additional scattering is observed when annealing at temperatures over 150 °C, probably related to the formation of large PC71BM crystallites.
:fullerene weight ratio 1:1.5), the polymers show the same trends and no significant influence of PC71BM can be seen on the aggregation behaviour of the polymers. In a few cases, additional scattering is observed when annealing at temperatures over 150 °C, probably related to the formation of large PC71BM crystallites.
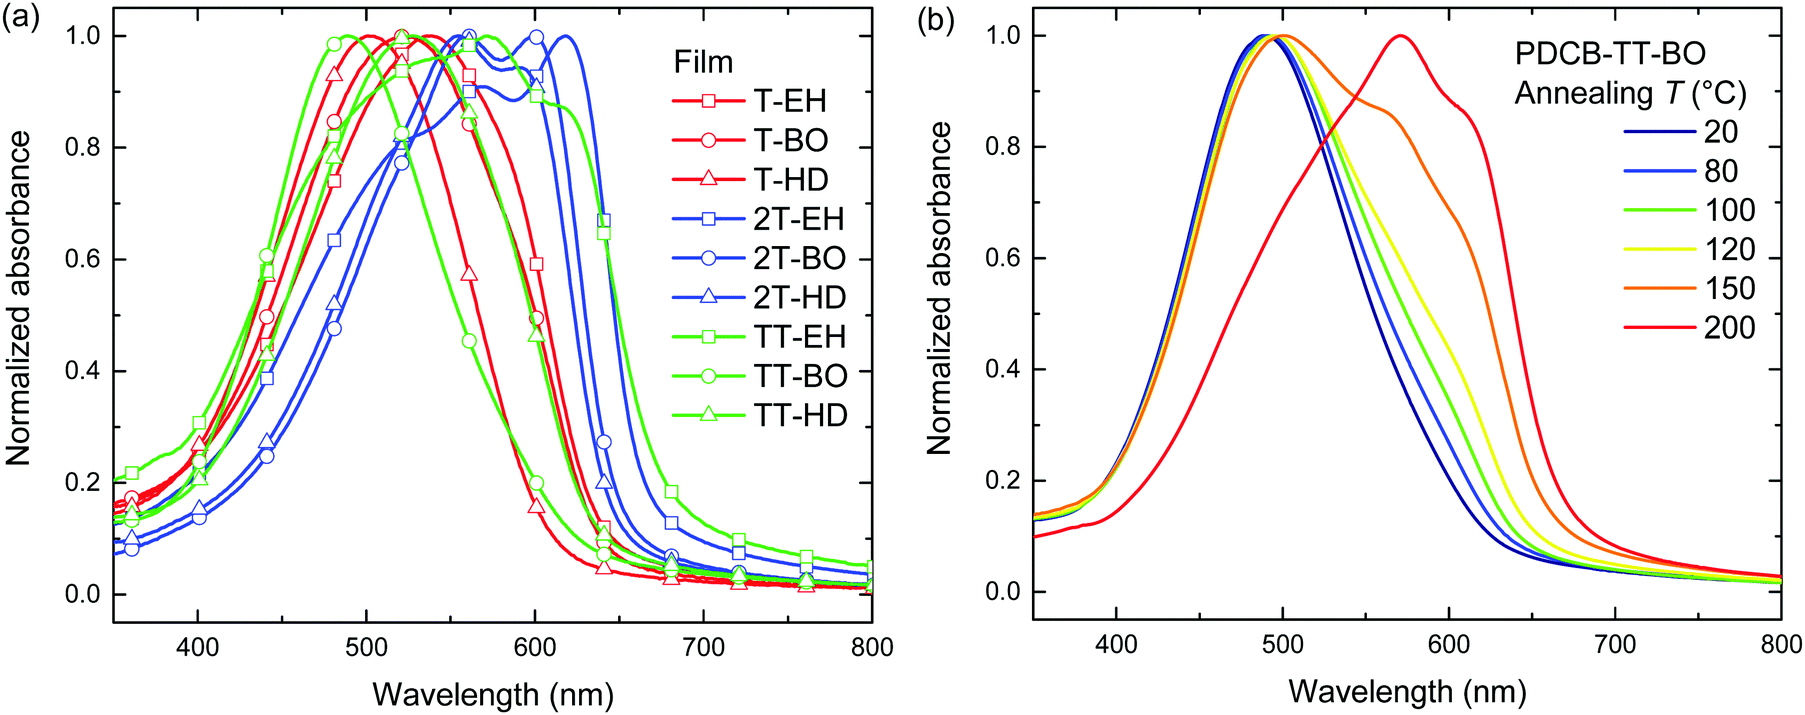
The thermal behaviour was further studied by differential scanning calorimetry (DSC). DSC traces are shown in Fig. 3 and Fig. S5 (ESI†). Transition peak temperatures for both melting and crystallization are summarized in Table 2. From these results, a general trend can be observed that for a single co-monomer, an increased side chain length results in a lower transition temperature. Furthermore, an additional trend can be observed when changing the co-monomer from T, via 2T to TT. A shift of transition peak temperature towards higher temperatures is seen, putting them outside of our measuring range (up to 300 °C) for PDCB-TT-EH and PDCB-TT-BO. Although glass transition temperatures were not identified in DSC, at least some kind of extra mobility of the polymer is already introduced from 80 °C onwards for PDCB-T-BO and PDCB-TT-HD. This could be seen from the thermal annealing induced aggregation, evidenced by the optical absorption experiments (Fig. S3a, ESI†). Interestingly, PDCB-T-BO shows an additional transition, suggesting some kind of intermediate phase between 98 and 136 °C. Further studies will have to be performed to determine the exact nature of these transitions and the state between them. Whether the drop in the aggregation shoulder intensity of PDCB-T-BO at temperatures over 120 °C (Fig. S3a, ESI†) has any relation to the extra transition around 130 °C is not certain.
 | ||
| Fig. 3 (a) DSC traces of PDCB-T polymers. (b) Redox potentials and electrochemical energy levels for the PDCB polymers. | ||
Comparing the melting (ΔHm) and fusion (ΔHf) enthalpies shows a clear trend of decreased latent heat of crystallization when extending side chain length, especially for T-based polymers (Table 2). Longer side chains combined with a smaller co-monomer introduce steric hindrance and produce more amorphous polymers. Furthermore, the thiophene polymers introduce an additional loss of crystallinity due to the configuration of the thiophene carboxylate moieties on either side of the thiophene co-monomer. Retaining the alternating directivity of thiophene units will place both carboxylate moieties on the same side introducing additional steric hindrance for longer side chains. Placing the side chains on different sides of the polymer, however, breaks the alternating directivity and will introduce a bending of the polymer chain. Bithiophene and thienothiophene both retain the alternating directivity of the thiophene units as well as the side chains. These results confirm the added crystallinity of the bithiophene containing polymers. Polymers containing the bithiophene co-monomer show, on average, higher transition enthalpy, indicating a more crystalline material.
The electrochemical properties of the PDCB polymers were measured using pristine and thermally annealed (10 min at 150 °C) thin films that were spin coated from pure chloroform on glass/ITO substrates (Fig. 3b). The HOMO and LUMO levels (Table 1) were calculated using the onsets of the oxidation and reduction waves vs. ferrocene/ferrocenium using EHOMO/LUMO = −(Eox/red + 5.23). Fig. 3b shows that the LUMO levels are only slightly affected by the backbone, side chain, or thermal history. On the other hand, the HOMO levels show some variation and weak trends can be identified. First, both T- and TT-based polymers show somewhat deeper HOMO levels than the 2T-based polymers, owing to the increased electron rich character of the latter. Second, the HOMO level becomes more negative for longer side chains. This effect is most likely caused by the decreased tendency of the polymers to aggregate for longer and bulkier side chains. Third, thermal annealing either raises the HOMO level or leaves it unaltered. Surprisingly, there is no correlation between the polymers that had different optical band gaps (PDCB-T-BO, -TT-BO, and -TT-HD) and those that had different oxidation potentials (PDCB-T-HD, -2T-EH, and -2T-HD) after thermal annealing. Due to the additional interaction between the measured film and the solvent and ions in the electrolyte, it is difficult to unambiguously determine the origin of the small differences in energy levels observed by cyclic voltammetry. However, an increased tendency to aggregate, either by using shorter side chains or by thermal annealing, often raises the HOMO level and reduces the optical bandgap. All polymers, in either pristine or annealed state, show sufficiently high offset (>0.3 eV) with the energy levels of PC71BM for photoinduced charge transfer to occur. Based on the results shown in Fig. 3b, an increased Voc can be expected for solar cells incorporating T- and TT-based polymers, compared to 2T-based polymers.
The photovoltaic performance of the PDCB polymers was investigated using a regular device configuration. A bulk heterojunction of the PDCB polymer as donor and PC71BM as acceptor in a 1:1.5 weight ratio was sandwiched between an ITO/PEDOT:PSS hole collecting electrode and a LiF/Al electron collecting electrode. The photovoltaic devices were characterized by measuring the J–V dependence in the dark and under simulated AM1.5G (100 mW cm−2) illumination (Table 3 and Fig. 4a–c). The external quantum efficiency (EQE) (Fig. 4d–f) was determined by measuring the spectral response using a calibrated silicon reference cell and was used to correct short-circuit current densities (Table 3) for spectral mismatch. The photoactive layers were processed from chloroform, followed by performance optimization using different amounts of diphenyl ether (DPE) as co-solvent to vary aggregation behaviour (Table S1, ESI†). Furthermore, the optimized devices were subjected to thermal annealing for 10 min at 120 °C to study the effect on the photovoltaic parameters. PDCB-2T-EH and PDCB-TT-EH were too poorly soluble to be processed in working photovoltaic devices. Whereas PDCB-TT-EH was only soluble in superheated chloroform at temperatures exceeding 160 °C, PDCB-2T-EH was soluble at around 70 °C, but showed rapid aggregation upon spin coating resulting in rough layers and shorted devices. For the sparsely soluble polymer (PDCB-TT-BO), the reproducibility was limited due to the need for hot spin coating (at ∼60 °C). When hot spin coating is employed, the morphology is essential frozen as the solvent cools rapidly. The resulting morphology, therefore, very much depends on parameters that are difficult to control, like substrate and solution temperature as well as cooling rate.
| Polymer | TAa | J sc [mA cm−2] | V oc [V] | FF | PCE [%] |
|---|---|---|---|---|---|
| a Thermal annealing for 10 min at 120 °C. b Obtained by integrating the EQE with the AM1.5G spectrum. | |||||
| PDCB-T-EH | No | 8.01 ± 0.04 (8.06) | 0.94 ± 0.00 (0.94) | 0.67 ± 0.01 (0.67) | 5.05 ± 0.06 (5.08) |
| Yes | 6.62 ± 0.07 (6.62) | 0.96 ± 0.00 (0.94) | 0.67 ± 0.00 (0.67) | 4.26 ± 0.05 (4.26) | |
| PDCB-T-BO | No | 2.43 ± 0.14 (2.60) | 0.99 ± 0.01 (0.99) | 0.59 ± 0.01 (0.57) | 1.42 ± 0.06 (1.47) |
| Yes | 1.26 ± 0.04 (1.30) | 1.03 ± 0.01 (1.04) | 0.43 ± 0.01 (0.43) | 0.56 ± 0.02 (0.58) | |
| PDCB-T-HD | No | 0.48 ± 0.01 (0.49) | 0.98 ± 0.09 (0.97) | 0.41 ± 0.06 (0.39) | 0.19 ± 0.04 (0.19) |
| Yes | 0.37 ± 0.01 (0.36) | 0.61 ± 0.21 (0.67) | 0.32 ± 0.03 (0.32) | 0.07 ± 0.03 (0.08) | |
| PDCB-2T-EH | — | — | — | — | |
| PDCB-2T-BO | No | 9.66 ± 0.16 (9.86) | 0.74 ± 0.00 (0.74) | 0.71 ± 0.01 (0.71) | 5.04 ± 0.12 (5.18) |
| Yes | 8.46 ± 0.15 (8.71) | 0.82 ± 0.00 (0.82) | 0.69 ± 0.06 (0.70) | 4.78 ± 0.44 (5.00) | |
| PDCB-2T-HD | No | 8.76 ± 0.11 (8.80) | 0.75 ± 0.00 (0.75) | 0.65 ± 0.00 (0.65) | 4.24 ± 0.10 (4.29) |
| Yes | 6.95 ± 0.16 (7.09) | 0.86 ± 0.01 (0.86) | 0.66 ± 0.01 (0.67) | 3.94 ± 0.18 (4.08) | |
| PDCB-TT-EH | — | — | — | — | |
| PDCB-TT-BO | No | 7.60 ± 0.14 (7.56) | 0.92 ± 0.01 (0.92) | 0.67 ± 0.01 (0.68) | 4.75 ± 0.09 (4.73) |
| Yes | 6.49 ± 0.13 (6.65) | 0.94 ± 0.00 (0.94) | 0.56 ± 0.01 (0.56) | 3.42 ± 0.09 (3.50) | |
| PDCB-TT-HD | No | 6.43 ± 0.12 (6.61) | 0.88 ± 0.01 (0.88) | 0.58 ± 0.01 (0.57) | 3.25 ± 0.04 (3.32) |
| Yes | 6.68 ± 0.09 (6.73) | 0.84 ± 0.02 (0.84) | 0.59 ± 0.05 (0.59) | 3.31 ± 0.32 (3.34) | |
 | ||
| Fig. 4 (a–c) J–V-characteristics of optimized bulk heterojunction solar cells of PDCB polymers containing (a) thiophene, (b), bithiophene, and (c) thienothiophene with PC71BM. (d–f) Corresponding EQE spectra of the same devices. TA is thermal annealing for 10 min at 120 °C. | ||
The most efficient devices were made using PDCB-T-EH, PDCB-2T-BO and PDCB-TT-BO (Table 3), which correspond to the polymers with the shortest side chain for each co-monomer (T, 2T, TT) where the PDCB polymer is soluble enough to be processed. Longer side chains generally reduced the performance. The Voc values follow the same general trend as was seen in the cyclic voltammetry on pristine polymer films, showing higher Voc values for T- and TT-based polymers. Fill factors (FFs) increase as the crystallinity of the polymer increases (i.e. for shorter side chains). In particular, PDCB-2T-BO shows a high FF. Thermal treatment of the active layer does not increase the performance. In general, Voc and FF are little affected, while Jsc decreases. The EQE spectra show a broader response for the more crystalline 2T-based polymers. The more disordered polymers yield generally lower EQEs, which is especially clear in the T-based polymers with BO and HD side chains. For most polymers the effect of thermal annealing on the shape of the EQE is surprisingly small, but it causes a distinct broadening for PDCB-TT-HD, consistent with the optical absorption experiment (Fig. S3, ESI†). For PDCB-TT-BO, annealing up to 120 °C shows a small effect only, but significant broadening of the EQE occurs at 200 °C (Fig. S6, ESI†). Aggregation in this polymer is only induced at higher temperatures as is known from temperature dependent optical absorption experiments. The most clear and rather general effect of thermal annealing, however, is a drop in the maximum EQE explaining the reduced Jsc.
To clarify the effect of morphology on the photovoltaic performance, the active layers of optimized devices were studied using transmission electron microscopy (TEM). The typical micrographs are shown in Fig. 5. A complete overview of the TEM images of pristine photoactive blends is shown in Fig. S7 and for thermally annealed blends in Fig. S8 in the ESI.† In general, the TEM micrographs correlate very well with the results and conclusions inferred from optical absorption, DSC and photovoltaic performance. For the most soluble material (PDCB-T-HD), the blend film shows droplet-like features that are associated with PC71BM-rich domains that form via spinodal liquid–liquid phase separation. Moving towards shorter BO and EH side chains for the T-based polymers results in a crossover from coarse morphologies caused by liquid–liquid phase separation as the dominant mechanism for phase separation to more intimately-mixed phases that are formed because the polymer chains aggregate before liquid–liquid phase separation occurs. Hence, whereas the PDCB-T-BO derivative still shows sizeable domains (Fig. S7b, ESI†), moving to even shorter side chains eventually results in an intimately-mixed fibrillary morphology for PDCB-T-EH (Fig. S7a, ESI†) that provides the highest PCE for the T-based PDCB polymers. For PDCB-2T-BO and PDCB-2T-HD, fibrillary morphologies are also found (Fig. 5b and c). The fibres are semi-crystalline as evidenced by the crystal lattice fringes that are visible at a higher magnification (Fig. S9, ESI†). Such a semi-crystalline, fibre-like morphology is known to be beneficial because of the small domain sizes and percolating pathways in both phases. It is interesting to see that for the more soluble PDCB-2T-HD, the crystalline fibres appear somewhat broader than for PDCB-2T-BO. For PCDB-TT-BO and PDCB-TT-HD, the trends are similar (Fig. S7, ESI†). The broadening of polymer fibres for more soluble semiconducting polymers has also been observed for diketopyrrolopyrole polymers,61 and was rationalized by considering the kinetics of nucleation and growth of polymer fibres in which higher solubility leads to wider polymer fibrils.62 Because for wider fibres, the fibril width may exceed the exciton diffusion length, the EQE and Jsc are reduced when the side chains become longer.60 The present results are consistent with this explanation.
 | ||
| Fig. 5 Bright-field TEM micrographs of optimized, pristine active layer blends with PC71BM for (a) PDCB-T-HD; (b) PDCB-2T-BO; (c) PDCB-2T-HD. (d) A thermally annealed blend of PDCB-2T-HD:PC71BM. In each case, the mixing ratio was 1:1.5 (polymer/fullerene) by weight. | ||
Thermal annealing of the active layer increases the width of the fibres for the PDCB-2T-HD:PC71BM blend (Fig. 5c and d), thereby decreasing the effective area for charge separation and reducing the EQE and Jsc even further. Thermal annealing generally increases the fraction of the crystalline regions, except for blends of PC71BM with PDCB-T-HD, PDCB-2T-BO and PDCB-2T-HD that already show extensive crystallization in the as-cast films. For the morphologies that form via liquid–liquid phase separation, the contrast between the phases in the TEM images is decreased, which suggests a flattening of the films, but crystallization does not take place.
Conclusion
In conclusion, a total of nine different polymers were synthesized and studied for their optical properties, thermal behaviour, and performance in polymer–fullerene solar cells. PDCB polymers, functionalized with short side chains or containing the bithiophene co-monomer, show higher crystallinity and better performance in photovoltaic devices. Care had to be taken to ensure the solubility and processability of the polymers in order to be able to make smooth, closed layers. Furthermore, thermal treatment of the polymers was most effective for the more amorphous polymers as these crystallize and show a steepening of the absorption onset. The Jsc of these polymers, however, does not increase upon thermal annealing. The EQE drops as a result of the widening of the fibre-like polymer domains, leading to a smaller D–A surface for charge carrier generation. We found that the PDCB-2T-BO polymer, using a moderate length side chain along with the increased crystallinity of the bithiophene moiety, performed best with PCE = 5.18% (Jsc = 9.86 mA cm−2, Voc = 0.74 V, FF = 0.71). However, for multi-junction devices, PDCB-T-EH could be an interesting polymer due to a comparable PCE of 5.08% but a significantly increased open-circuit voltage (0.94 V). Ultimately, this class of PDCBT type polymers presents an interesting group of wide bandgap polymers, where especially the high voltage might prove useful for application in multi-junction solar cells.Experimental section
Materials and methods
Tris(dibenzylideneacetone)dipalladium (Pd2dba3) (Strem Chemicals Inc.), thiophene-3-carboxylic acid, and ZnTAC24 (TCI) were used as received. Triphenylphosphine (PPh3) was recrystallized from absolute ethanol. All solid monomers were freshly recrystallized from absolute ethanol prior to use, liquid monomers were subjected to column chromatography and used within two days.1H and 13C NMR spectra were recorded at, respectively, 400 and 100 MHz on a Bruker Avance III spectrometer at 25 °C. Molecular weights of small molecules were determined using matrix assisted laser desorption ionization time of flight (MALDI-TOF) mass spectroscopy (Bruker Autoflex Speed spectrometer) or gas chromatography/mass spectroscopy (GC-MS) (Shimadzu GC-2010 chromatograph, equipped with a Zebron ZB-5MS column and a GCMS-QP2010 plus mass spectrometer). The molecular weights of polymers were determined by gel permeation chromatography (GPC) on a PL-GPC 220 using a PL-GEL 10 μm MIXED-B column. The system was operated at 140 °C with o-dichlorobenzene (oDCB) as the eluent. Samples, dissolved at 0.1 mg mL−1, were measured against polystyrene standards. UV/visible/NIR spectroscopy was conducted on a PerkinElmer Lambda 1050 spectrophotometer equipped with a 3D WB PMT/InGaAs/PbS detector module. Temperature control was realized with a PerkinElmer PTP1 Peltier temperature programmer. Cyclic voltammetry was carried out using an AutoLab PGSTAT 30 under an inert atmosphere. The electrolyte consisted of 0.1 M tetrabutylammonium hexafluorophosphate in acetonitrile. The sample was applied as a thin film, and spin coated on an ITO coated glass substrate as a working electrode. A silver rod was used as a counter electrode and a silver chloride coated silver rod (Ag/AgCl) as a quasi-reference electrode. The measurements were performed at a scan speed of 0.2 V s−1 and potentials are quoted vs. Fc/Fc+ as an external standard. For conversion to energy levels vs. vacuum, we used EFc/Fc+ = −5.23 eV. Differential scanning calorimetry was done using a TA Instruments DSC Q2000.
Photovoltaic devices were fabricated with active areas of 0.09 and 0.16 cm2. Poly(ethylenedioxythiophene):poly(styrenesulfonate) (PEDOT:PSS) (Clevios P, VP Al4083) was spin coated at 3000 rpm on pre-cleaned, patterned indium tin oxide (ITO)/glass substrates (Naranjo Substrates). The active layer was spin coated at 2000 rpm from a chloroform(/co-solvent) solution (6 mg mL−1 polymer, 9 mg mL−1 [6,6]-phenyl-C71-butyric acid methyl ester (PC71BM)). The back electrode was evaporated at ∼10−7 mbar and consisted of LiF (1 nm) and Al (100 nm) layers. Current density–voltage (J–V) characteristics were recorded with a Keithley 2400 source meter using a tungsten-halogen lamp as light source. The light was filtered by a Schott GG385 UV filter and a Hoya LB120 daylight filter to provide 100 mW cm−2 AM1.5G light. Short-circuit currents and PCEs were calculated by integrating the solar spectrum and the spectral response of the cells. External quantum efficiencies (EQEs) were determined using modulated monochromatic light from a 50 W tungsten-halogen lamp (Philips Focusline) passing through a monochromator (Oriel, Cornerstone 130) and a mechanical chopper. The response was recorded as the voltage produced by a preamplifier (Stanford Research Systems SR570) with a lock-in amplifier (SR830). All measurements were done against a Si-reference cell with known spectral response.
X-ray diffraction was measured on a Bruker 2D Phaser using Cu Kα radiation with a wavelength of 0.15406 nm between 2θ angles of 2° to 30°, using increments of 0.02°. Transmission electron microscopy (TEM) was performed on a Tecnai G2 Sphera transmission electron microscope (FEI) operating at 200 kV. Layer thicknesses were determined using a Vecoo Dektak 150 profilometer, subtracting the thickness of any underlying layers.
Synthesis
:1). The product was obtained as a white solid with a yield of 1.821 g (4.138 mmol or 75.5%). 1H-NMR (400 MHz, CDCl3, δ) 7.395 (s, 2H), 3.925 (s, 6H). 13C-NMR (100 MHz, CDCl3, δ) 161.851, 135.323, 131.720, 125.844, 119.508, 52.134. GC-MS: [M]+ calc.: 437.82, found: 437.95.
:2) to obtain the product as a colourless oil with a yield of 592 mg (0.931 mmol or 98.3%). 1H-NMR (400 MHz, CDCl3, δ) 7.380 (s, 2H), 4.263 (dd, J = 2.2 Hz, 5.6 Hz, 4H), 1.734 (m, 2H), 1.527–1.329 (m, 16H), 0.948 (m, 12H). 13C-NMR (101 MHz, CDCl3, δ) 161.698, 135.274, 132.311, 126.051, 118.964, 67.680, 38.821, 30.519, 28.972, 23.936, 22.978, 14.079, 11.073. MALDI-TOF-MS: [M]+ calc.: 634.04, found: 634.06.
:3) obtained the product as a colourless oil with a yield of 685 mg (0.918 mmol or 99.8%). 1H-NMR (400 MHz, CDCl3, δ) 7.353 (s, 2H), 4.218 (d, J = 5.5 Hz, 4H), 1.762 (m, 2H), 1.417–1.285 (m, 32H), 0.895 (m, 12H). 13C-NMR (101 MHz, CDCl3, δ) 161.692, 135.275, 132.324, 126.044, 118.931, 68.103, 37.322, 31.836, 31.384, 31.054, 29.623, 28.961, 26.728, 22.989, 22.668, 14.113, 14.088. MALDI-TOF-MS: [M]+ calc.: 746.17, found: 746.15.
:1) obtained the product as a colourless oil with a yield of 270 mg (0.314 mmol or 86.7%). 1H-NMR (400 MHz, CDCl3, δ) 7.352 (s, 2H), 4.216 (d, J = 5.6 Hz, 4H), 1.762 (m, 2H), 1.413–1.281 (m, 48H), 0.873 (m, 12H). 13C-NMR (101 MHz, CDCl3, δ) 161.677, 135.271, 132.328, 126.052, 118.929, 68.120, 37.341, 31.913, 31.837, 31.393, 31.380, 29.951, 29.623, 29.578, 29.325, 26.748, 26.732, 22.688, 22.670, 14.118. MALDI-TOF-MS: [M]+ calc.: 858.29, found: 858.28.
Polymerization reactions
Conflicts of interest
There are no conflicts to declare.Acknowledgements
We thank B. J. Bruijnaers for assistance with the X-ray measurements. The research received funding from the European Research Council under the European Union's Seventh Framework Programme (FP/2007–2013)/ERC Grant Agreement No. 339031 and from the Ministry of Education, Culture and Science (Gravity program 024.001.035).References
- N. S. Sariciftci, L. B. Smilowitz, A. J. Heeger and F. Wudl, Science, 1992, 258, 1474–1476 CAS.
- N. S. Sariciftci, D. Braun, C. Zhang, V. I. Srdanov, A. J. Heeger, G. Stucky and F. Wudl, Appl. Phys. Lett., 1993, 62, 585–587 CrossRef CAS.
- G. Yu, J. Gao, J. C. Hummelen, F. Wudl and A. J. Heeger, Science, 1995, 270, 1789–1791 CAS.
- L. S. Roman, W. Mammo, L. A. A. Pettersson, M. R. Andersson and O. Inganäs, Adv. Mater., 1998, 10, 774–777 CrossRef CAS.
- H. J. Son, F. He, B. Carsten and L. Yu, J. Mater. Chem., 2011, 21, 18934–18945 RSC.
- S. Günes, H. Neugebauer and N. S. Sariciftci, Chem. Rev., 2007, 107, 1324–1338 CrossRef PubMed.
- F. C. Krebs, Sol. Energy Mater. Sol. Cells, 2009, 93, 394–412 CrossRef CAS.
- L. Dou, J. You, Z. Hong, Z. Xu, G. Li, R. A. Street and Y. Yang, Adv. Mater., 2013, 25, 6642–6671 CrossRef CAS PubMed.
- C. Duan, F. Huang and Y. Cao, Polym. Chem., 2015, 6, 8081–8098 RSC.
- H. Hu, K. Jiang, G. Yang, J. Liu, Z. Li, H. Lin, Y. Liu, J. Zhao, J. Zhang, F. Huang, Y. Qu, W. Ma and H. Yan, J. Am. Chem. Soc., 2015, 137, 14149–14157 CrossRef CAS PubMed.
- J. Huang, J. H. Carpenter, C.-Z. Li, J.-S. Yu, H. Ade and A. K.-Y. Jen, Adv. Mater., 2015, 28, 967–974 CrossRef PubMed.
- Y. Liu, J. Zhao, Z. Li, C. Mu, W. Ma, H. Hu, K. Jiang, H. Lin, H. Ade and H. Yan, Nat. Commun., 2014, 5, 5293 CrossRef CAS PubMed.
- J. Zhao, Y. Li, G. Yang, K. Jiang, H. Lin, H. Ade, W. Ma and H. Yan, Nat. Energy, 2016, 1, 15027 CrossRef CAS.
- F. Zhao, S. Dai, Y. Wu, Q. Zhang, J. Wang, L. Jiang, Q. Ling, Z. Wei, W. Ma, W. You, C. Wang and X. Zhan, Adv. Mater., 2017, 29, 1700144 CrossRef PubMed.
- Z. Zheng, O. M. Awartani, B. Gautam, D. Liu, Y. Qin, W. Li, A. Bataller, K. Gundogdu, H. Ade and J. Hou, Adv. Mater., 2016, 29, 1604241 CrossRef PubMed.
- W. Zhao, D. Qian, S. Zhang, S. Li, O. Inganäs, F. Gao and J. Hou, Adv. Mater., 2016, 28, 4734–4739 CrossRef CAS PubMed.
- A. Ajayaghosh, Chem. Soc. Rev., 2003, 32, 181–191 RSC.
- E. Bundgaard and F. Krebs, Sol. Energy Mater. Sol. Cells, 2007, 91, 954–985 CrossRef CAS.
- S. Holliday, Y. Li and C. K. Luscombe, Prog. Polym. Sci., 2017, 70, 34–51 CrossRef CAS.
- Y. Ma, Z. Kang and Q. Zheng, J. Mater. Chem. A, 2017, 5, 1860–1872 CAS.
- K. Seki, A. Furube and Y. Yoshida, Jpn. J. Appl. Phys., 2015, 54, 08KF04 CrossRef.
- S. P. Bremner, M. Y. Levy and C. B. Honsberg, Prog. Photovoltaics, 2008, 16, 225–233 Search PubMed.
- R. S. Ashraf, I. Meager, M. Nikolka, M. Kirkus, M. Planells, B. C. Schroeder, S. Holliday, M. Hurhangee, C. B. Nielsen, H. Sirringhaus and I. McCulloch, J. Am. Chem. Soc., 2015, 137, 1314–1321 CrossRef CAS PubMed.
- D. Mühlbacher, M. Scharber, M. Morana, Z. Zhu, D. Waller, R. Gaudiana and C. Brabec, Adv. Mater., 2006, 18, 2884–2889 CrossRef.
- K. H. Hendriks, W. Li, M. M. Wienk and R. A. J. Janssen, J. Am. Chem. Soc., 2014, 136, 12130–12136 CrossRef CAS PubMed.
- W. Li, K. H. Hendriks, W. S. C. Roelofs, Y. Kim, M. M. Wienk and R. A. J. Janssen, Adv. Mater., 2013, 25, 3182–3186 CrossRef CAS PubMed.
- E. Zhou, Q. Wei, S. Yamakawa, Y. Zhang, K. Tajima, C. Yang and K. Hashimoto, Macromolecules, 2010, 43, 821–826 CrossRef CAS.
- L. Dou, C.-C. Chen, K. Yoshimura, K. Ohya, W.-H. Chang, J. Gao, Y. Liu, E. Richard and Y. Yang, Macromolecules, 2013, 46, 3384–3390 CrossRef CAS.
- W. Li, A. Furlan, K. H. Hendriks, M. M. Wienk and R. A. J. Janssen, J. Am. Chem. Soc., 2013, 135, 5529–5532 CrossRef CAS PubMed.
- M. C. Scharber, D. Mühlbacher, M. Koppe, P. Denk, C. Waldauf, A. J. Heeger and C. J. Brabec, Adv. Mater., 2006, 18, 789–794 CrossRef CAS.
- K. Kawashima, Y. Tamai, H. Ohkita, I. Osaka and K. Takimiya, Nat. Commun., 2015, 6, 10085 CrossRef CAS PubMed.
- W. Li, K. H. Hendriks, A. Furlan, M. M. Wienk and R. A. J. Janssen, J. Am. Chem. Soc., 2015, 137, 2231–2234 CrossRef CAS PubMed.
- W. Li, W. S. C. Roelofs, M. M. Wienk and R. A. J. Janssen, J. Am. Chem. Soc., 2012, 134, 13787–13795 CrossRef CAS PubMed.
- K. H. Hendriks, A. S. G. Wijpkema, J. J. van Franeker, M. M. Wienk and R. A. J. Janssen, J. Am. Chem. Soc., 2016, 138, 10026–10031 CrossRef CAS PubMed.
- S. Xu, L. Feng, J. Yuan, Z.-G. Zhang, Y. Li, H. Peng and Y. Zou, ACS Appl. Mater. Interfaces, 2017, 9, 18816–18825 CAS.
- M. M. Kobayashi, J. Chen, T.-C. Chung, F. Moraes, A. J. Heeger and F. Wudl, Synth. Met., 1984, 9, 77–86 CrossRef CAS.
- S. Hotta, S. D. D. V. Rughooputh, A. J. Heeger and F. Wudl, Macromolecules, 1987, 20, 212–215 CrossRef CAS.
- P. Schilinsky, C. Waldauf and C. J. Brabec, Appl. Phys. Lett., 2002, 81, 3885–3887 CrossRef CAS.
- G. Li, V. Shrotriya, J. Huang, Y. Yao, T. Moriarty, K. Emery and Y. Yang, Nat. Mater., 2005, 4, 864–868 CrossRef CAS.
- W. Ma, C. Yang, X. Gong, K. Lee and A. J. Heeger, Adv. Funct. Mater., 2005, 15, 1617–1622 CrossRef CAS.
- J. C. Hummelen, B. W. Knight, F. Lepeq, F. Wudl, J. Yao and C. L. Wilkins, J. Org. Chem., 1995, 60, 532–538 CrossRef CAS.
- M. Lenes, G. A. H. Wetzelaer, F. B. Kooistra, S. C. Veenstra, J. C. Hummelen and P. W. M. Blom, Adv. Mater., 2008, 20, 2116–2119 CrossRef CAS.
- Y. He, H.-Y. Chen, J. Hou and Y. Li, J. Am. Chem. Soc., 2010, 132, 1377–1382 CrossRef CAS PubMed.
- L. H. Nguyen, H. Hoppe, T. Erb, S. Günes, G. Gobsch and N. S. Sariciftci, Adv. Funct. Mater., 2007, 17, 1071–1078 CrossRef CAS.
- A. Gadisa, W. D. Oosterbaan, K. Vandewal, J.-C. Bolsée, S. Bertho, J. D’Haen, L. Lutsen, D. Vanderzande and J. V. Manca, Adv. Funct. Mater., 2009, 19, 3300–3306 CrossRef CAS.
- M. Pomerantz, H. Yang and Y. Cheng, Macromolecules, 1995, 28, 5706–5708 CrossRef CAS.
- M. Zhang, X. Guo, Y. Yang, J. Zhang, Z.-G. Zhang and Y. Li, Polym. Chem., 2011, 2, 2900–2906 RSC.
- M. Zhang, X. Guo, W. Ma, H. Ade and J. Hou, Adv. Mater., 2014, 26, 5880–5885 CrossRef CAS PubMed.
- Z. Zheng, S. Zhang, M. Zhang, K. Zhao, L. Ye, Y. Chen, B. Yang and J. Hou, Adv. Mater., 2014, 27, 1189–1194 CrossRef PubMed.
- M.-Y. Chang, Y.-H. Huang and Y.-K. Han, Org. Electron., 2014, 15, 251–259 CrossRef CAS.
- F. Panzer, M. Sommer, H. Bässler, M. Thelakkat and A. Köhler, Macromolecules, 2015, 48, 1543–1553 CrossRef CAS.
- N. Seidler, G. M. Lazzerini, G. Li Destri, G. Marletta and F. Cacialli, J. Mater. Chem. C, 2013, 1, 7748–7757 RSC.
- W. Ma, G. Yang, K. Jiang, J. H. Carpenter, Y. Wu, X. Meng, T. McAfee, J. Zhao, C. Zhu, C. Wang, H. Ade and H. Yan, Adv. Energy Mater., 2015, 5, 1501400 CrossRef.
- T. Erb, U. Zhokhavets, G. Gobsch, S. Raleva, B. Stühn, P. Schilinsky, C. Waldauf and C. J. Brabec, Adv. Funct. Mater., 2005, 15, 1193–1196 CrossRef CAS.
- Y. Hayashi, T. Ohshima, Y. Fujii, Y. Matsushima and K. Mashima, Catal. Sci. Technol., 2011, 1, 230–233 CAS.
- T. Iwasaki, Y. Maegawa, Y. Hayashi, T. Ohshima and K. Mashima, J. Org. Chem., 2008, 73, 5147–5150 CrossRef CAS PubMed.
- Y. Maegawa, T. Ohshima, Y. Hayashi, K. Agura, T. Iwasaki and K. Mashima, ACS Catal., 2011, 1, 1178–1182 CrossRef CAS.
- U. Zhokhavets, T. Erb, G. Gobsch, M. Al-Ibrahim and O. Ambacher, Chem. Phys. Lett., 2006, 418, 347–350 CrossRef CAS.
- K. Rahimi, I. Botiz, J. O. Agumba, S. Motamen, N. Stingelin and G. Reiter, RSC Adv., 2014, 4, 11121–11123 RSC.
- S. D. D. V. Rughooputh, S. Hotta, A. J. Heeger and F. Wudl, J. Polym. Sci., Part B: Polym. Phys., 1987, 25, 1071–1078 CrossRef CAS.
- W. Li, K. H. Hendriks, A. Furlan, W. S. C. Roelofs, M. M. Wienk and R. A. J. Janssen, Adv. Mater., 2014, 26, 1565–1570 CrossRef CAS PubMed.
- J. J. van Franeker, G. H. L. Heintges, C. Schaefer, G. Portale, W. Li, M. M. Wienk, P. van der Schoot and R. A. J. Janssen, J. Am. Chem. Soc., 2015, 137, 11783–11794 CrossRef CAS PubMed.
Footnote |
| † Electronic supplementary information (ESI) available. See DOI: 10.1039/c7tc04322h |
| This journal is © The Royal Society of Chemistry 2018 |