 Open Access Article
Creative Commons Attribution 3.0 Unported Licence
Understanding the charge storage mechanism of conductive polymers as hybrid battery-capacitor materials in ionic liquids by in situ atomic force microscopy and electrochemical quartz crystal microbalance studies†
Theresa
Schoetz
 *a,
Mario
Kurniawan
 b,
Michael
Stich
 b,
Ralf
Peipmann
 b,
Igor
Efimov
c,
Adriana
Ispas
 b,
Andreas
Bund
 b,
Carlos
Ponce de Leon
a and
Mikito
Ueda
d
aFaculty of Engineering and the Environment, University of Southampton, Highfield, Southampton SO17 1BJ, UK. E-mail: T.Schoetz@soton.ac.uk; Fax: +44 (0)2380 5970 51; Tel: +44 (0)2380 5989 31
bElectrochemistry and Electroplating Group, Technische Universität Ilmenau, Gustav-Kirchhoff-Straße 6, 98693 Ilmenau, Germany
cDepartment of Chemistry, University of Leicester, Leicester, LE1 7RH, UK
dFaculty of Engineering, Hokkaido University, Kita-13, Nishi-8, Kita-ku, Sapporo, 060-8628 Hokkaido, Japan
First published on 23rd August 2018
Abstract
Safe and sustainable energy storage systems with the ability to perform efficiently during large numbers of charge/discharge cycles with minimum degradation define the main objective of near future energy storage technologies. Closing the gap between high power and energy per unit weight requires new materials that can act as a battery and capacitor at the same time. Conductive polymers have attracted attention as hybrid battery-capacitor materials. However, their potential impact has not been fully investigated because their behaviour, especially in non-aqueous electrolytes such as ionic liquids, is not completely understood. Here, we aim to clarify the fundamental functionality of these hybrid characteristics while studying the interaction between a conductive polymer and an ionic liquid by in situ atomic force microscopy and electrochemical quartz crystal microbalance. The main achievement is the visualisation of the morphological modifications of the conductive polymer depending on the state of charge. These modifications significantly influence the viscoelastic material properties of the polymer. Our combined findings provide a model which explains why conductive polymers behave like (pseudo)-capacitors at a high state of charge and as batteries at a low state of charge. This understanding enables application-orientated synthesis of conductive polymers and their use as high-performance energy storage materials.
1. Broader context
High-performance energy storage devices such as lithium-ion batteries are characterised by having the highest practical specific energies (80 to 175 W h kg−1) and powers (200 to 300 W kg−1) among state-of-the-art rechargeable batteries.1 However, there are some major concerns about the safety and sustainability of lithium. These include flammability, difficult recycling and the limited availability of raw materials, which raise issues regarding the future viability of electric cars.Therefore, there is a strong tendency in the battery community to investigate alternative batteries beyond lithium-ion to enhance the safety and sustainability of batteries while decreasing their costs. Increasing the acceptance of and access to electromobility may result in a course correction towards a more sustainable and cleaner future.2,3
Great efforts are being made to implement batteries based on more sustainable materials, such as aluminium, magnesium or sodium. However, pure metal batteries cannot achieve high performance, such as high specific energy or power, and thus cannot compete with state-of-the art batteries.4 In order to increase their performance, these negative metal electrodes must be combined with a positive electrode; these are characterised as charge-storage-materials. Charge-storage electrodes can accommodate additional ions by intercalation or doping. These types of electrodes demonstrate battery-like (faradaic) behaviour due to the oxidation and reduction of the active electrode species while simultaneously showing capacitive (non-faradaic) behaviour by inserting anion species in a three-dimensional electrode structure.5
Carbon materials, especially graphene, have important roles as electrode materials due to their relatively inert electrochemistry, wide potential stability windows and low cost as well as their environmentally friendly properties.5 However, carbon-based materials can reach only limited charge storage capacities. Another type of charge-storage material is conductive polymers;6,7 they stand out for their low weights, low cost, relatively high conductivities and capacities and straightforward electrochemical synthesis.
Compared to batteries, capacitors have less energy per unit weight and store energy only for short periods. However, capacitors have higher specific powers and faster response times than batteries. In order to improve the specific energy and power of an energy storage system, the characteristics of batteries and capacitors must be combined in a hybrid system.8 Battery and capacitor properties can be linked with electrodes that operate under different charge storage mechanisms: the main storage mechanisms are based on faradaic charge storage, which is typical of batteries, and non-faradaic or capacitive charge storage by electrostatic interactions in the vicinity of the electrode double layer or pseudo-capacitive charge storage.9–11 Pseudo-capacitive charge storage refers to a surface-bound process that contributes to the total capacitance of the system.10,11
Conductive polymers such as poly(3,4-ethylenedioxythiophene) (PEDOT) are typical examples of hybrid battery-(pseudo)-capacitor materials.8 They have the unique characteristic of undergoing a redox reaction, like a battery (eqn (1)), generating positively charged sites in the polymer structure during the oxidation (charge reaction). When the polymer is reduced (discharge reaction), the charged sites return to their neutral state. In parallel to this redox reaction, the generated charged centres are compensated/doped (decompensated/de-doped) with anions from the electrolyte and incorporated into the nano/micro-porous polymer structure as electrical charges, as in a capacitor.12–14
The amount of doped charges per monomer unit is determined by the generated and accessible charged sites in the polymer; it increases with the doping potential. The number of doped anions per monomer unit is described as the degree of doping α (α = 0 to 1).15–17
 | (1) |
Furthermore, the formation of the doping/de-doping sites also depends on the polymer morphology, which is predetermined by the electro-polymerisation method, the applied potential and the doping anion.17
In contrast to conductive polymers synthesised in aqueous solution or in organic solvents such as acetonitrile, polymer films obtained in ionic liquids show higher cycle stability with a highly reversible doping/de-doping reaction and formation of doping/de-doping sites at high electrode potentials, leading to better battery performance.17–19
This study aims to investigate the anion doping/de-doping process of the conductive polymer PEDOT while performing charge/discharge cycles and evaluating its capacitive and faradaic behaviour by cyclic voltammetry (CV) coupled with electrochemical quartz crystal microbalance (EQCM) experiments. In situ atomic force microscopy (AFM) measurements were found to show the morphological changes of the polymer surface during charging and discharging. Combining these results helps establish a model of how the polymer morphology determines the battery and capacitor characteristics of the conductive polymer.
2. Experimental methods
2.1. Electro-polymerisation
The electro-polymerisation of PEDOT was performed by cyclic voltammetry from −0.5 V to 2.5 V vs. Al|Al(III) in Lewis neutral 1-ethyl-3-methylimidazolium chloride–aluminium chloride (EMImCl–AlCl3) with 0.1 mol dm−3 3,4-ethylenedioxythiophene (EDOT) (Alfa Aesar, 97%) at 100 mV s−1 over 20 cycles at 25 °C.17 The polymer surface was rinsed with monomer-free Lewis neutral EMImCl–AlCl3 after the polymerisation to remove residual monomer on the surface, and the polymer was cycled 10 times from 0 V to 2.5 V vs. Al|Al(III) at 100 mV s−1 at 25 °C in monomer-free Lewis neutral EMImCl–AlCl3.2.2. Electrochemical quartz crystal microbalance measurements
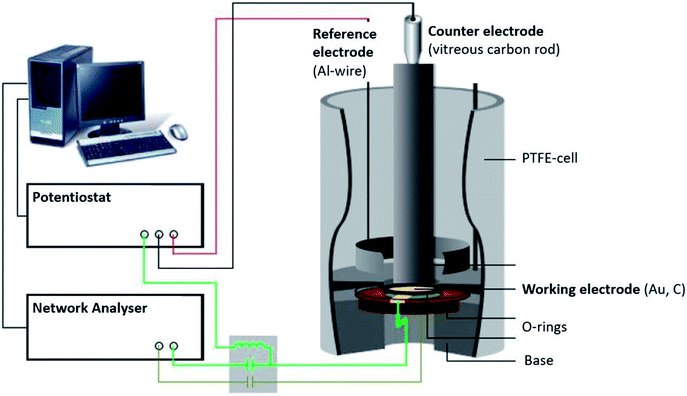
The EQCM setup (Fig. 1) comprised a three-electrode arrangement in a PTFE-cell controlled by a potentiostat (Princeton Applied Research 263A). A quartz crystal with AT-cut and sputtered gold (KVG, 10 MHz, 0.22 cm2) was used as the working electrode and substrate for the polymer. The polymer film was electro-polymerised on the gold quartz crystal as described in paragraph 2.1. A vitreous carbon rod (micro to nano, diameter 0.3 cm) placed opposite to the quartz acted as the counter electrode, while an aluminium ring was used as the reference electrode (Alfa Aesar, 99.999% metal basis, diameter 0.5 mm).When combining electrochemical and EQCM measurements, two electrical signals overlap at the working electrode: a DC voltage, applied by the potentiostat, and a high frequency AC voltage from the network analyser (Agilent E5100A). This causes the oscillation of the quartz.
The changes in the quartz resonance frequency caused by mass changes of the polymer film due to anion doping/de-doping were determined by the admittance (reciprocal of the impedance) using the network analyser. The spectrum of the admittance has the form of a Lorentz curve; thus, the resonance frequency f and the quartz damping w, which is defined as the width at half the height of the admittance peak, can be determined by curve fitting.
The resonance frequency and the damping provide information about the properties of the quartz crystal and the polymer film because they are mechanically coupled. Therefore, the mechanical properties of the polymer can be combined with the quartz to obtain a single mechanic system, which can be read as one electrical signal. The most accurate electrical description of a quartz crystal is currently given by the Electric Line Model (Transmission Line Model), based on a Mason 3-port model.20,21 Changes in the electric impedance of the quartz can be translated into film impedance of the polymer. The oscillation of the quartz causes a shear wave on the surface of the quartz, which is reproduced on the polymer film. Depending on the polymer properties, such as film density ρf, the shear wave is dampened. Therefore, the film impedance Zf is related to the shear modulus G of the system (eqn (2)).20
 | (2) |
The shear modulus describes the linear elastic deformation of the polymer film and provides information about changes in the stiffness or softness of the polymer.
 | (3) |
Because conductive polymers are not ideal planar rigid films, their viscoelastic properties cause a shift and damping of the shear wave propagation. Furthermore, contact of the polymer film with the electrolyte causes an additional film impedance Zl. If the electrolyte is inside the polymer pores and on the rough polymer surface, its impedance must be considered because it contributes to the overall impedance, which depends on the film thickness hf.
A complex shear modulus G* for viscoelastic materials can be defined (eqn (4)). G* comprises a real part G′, representing the deformation energy, which can be recovered (elastic behaviour), and an imaginary part G′′, describing the amount of energy which is lost due to frictional heat.
In this work, the changes in the shear modulus were studied instead of the quantitative mass changes of the polymer during charging/discharging cycles because the damping change of the viscoelastic polymer film is expected to be higher than the resonance frequency changes.
| G* = G′ + iG′′ | (4) |
The final equations20,23–36 for numerically solving the film impedance and shear modulus were calculated20,24,25 (eqn (5) and (6)) with the software package Mathematica® (ESI†) using FindRoot[]-function.
 | (5) |
 | (6) |
The film impedance Zf includes the unknown parameter shear modulus G* and the film density ρf, whereas the motional film impedance, which is estimated by the Sauerbrey equation, ZmfSB, includes the film thickness hf and the density (eqn (7)).
| ZmfSB = ω0ρfhfSB | (7) |
The reactance of the electrolyte is represented by Xl (eqn (8)).
 | (8) |
In order to determine the shear modulus, assumptions must be made for the thickness and the density of the polymer film. For the polymer density, the monomer density is assumed. The film thickness must be estimated. As a first step, it is assumed that the polymer consists of a rigid planar film, and the film thickness hfSB is estimated by the Sauerbrey equation. In a second step, the polymer film thickness is corrected by multiplying with the correction factor b (eqn (9)); this accounts for all deviations of a viscoelastic film from an ideal film, such as film roughness and density differences (eqn (3)).
| bhfSB = hf | (9) |
A correction factor b = 1 indicates a rigid and planar surface. The upper limit should be slightly greater than one. In order to determine the correction factor and the complex shear modulus G*, the b value was varied. The correction factor b was determined by finding the maximum of G′ because G′ is a function of b.20 In this study, an interval of b from 0.5 to 5.5 was selected.
This is the main task of the developed algorithm script (ESI†). Because b is a parameter for the calculation of G*, a list “databb” is generated which contains all b-values. First, the Mathematica FindRoot[]-function determines Zf and then G* for each b in databb. Then, the maximum and the associated bGmax are determined for G′. If both components of the shear modulus for bGmax are greater than zero, they are added to the result list.
2.3. In situ atomic force microscopy
The experimental setup (Fig. 2) consists of a self-designed PTFE three-electrode cell with a vitreous carbon disc (micro to nano, 6.3 cm2) as the substrate/working electrode, a vitreous carbon ring (micro to nano, diameter 3 cm) as the counter electrode and an aluminium wire (Alfa Aesar, 99.999% metal basis, diameter 0.5 mm) as the reference electrode. The electrochemical experiments were controlled by a Biologic SP-240 potentiostat.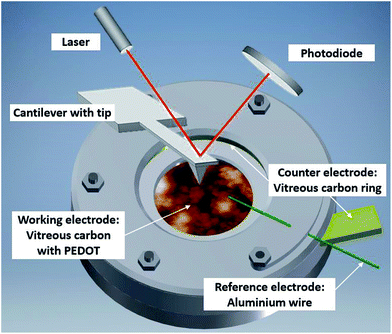 | ||
| Fig. 2 Illustration of the in situ AFM cell with PEDOT on vitreous carbon covered in Lewis neutral EMImCl–AlCl3 ionic liquid. | ||
The AFM (Dimension ICON, Bruker Co., Billerica, MA, USA) was located in a glove box (MBraun, Inertgas-Systeme GmbH, Garching, Germany) under argon atmosphere (water and oxygen levels below 10 ppm). The AFM measurements were carried out with a silicon probe coated with diamond-like carbon and a reflective aluminium layer at the back (Windsor Scientific, Multi75DLC, spring constant 3 N m−1, resonance frequency 75 kHz, tip radius < 10 nm). The probe was completely covered by the electrolyte during the duration of the electrochemical experiment.
Before the polymer film was charged/discharged, an initial AFM image of the PEDOT surface in the uncharged state was captured. The polymer surface was scanned horizontally over an area of 5 μm × 5 μm at 0.5 Hz, 512 samples per line and a 0.05 V force set point. The feedback gain was adapted automatically as the images were taken in ScanAsyst mode (peak force tapping mode).
The initial position of the polymer surface was set as a fixed scanning position and charged/discharged by linear sweep voltammetry (LSV) with 100 mV s−1 from 0 V to 2.5 V vs. Al|Al(III) and reversed to the uncharged state at 0 V. The LSV was stopped after every 500 mV and the potential was held at the OCP to capture the AFM image with the same set of parameters as the initial image. The OCP remained stable for the time spent to capture the image.
All AFM images were post-edited by a third-order polynomial flattening procedure using Nanoscope Analysis software (Bruker Co., Billerica, MA, USA) to remove tilt and curvature. A movie combining the AFM images obtained at every step of the charge/discharge cycles is available in the ESI† material.
3. Results and discussion
3.1. Electrochemical quartz crystal microbalance measurements
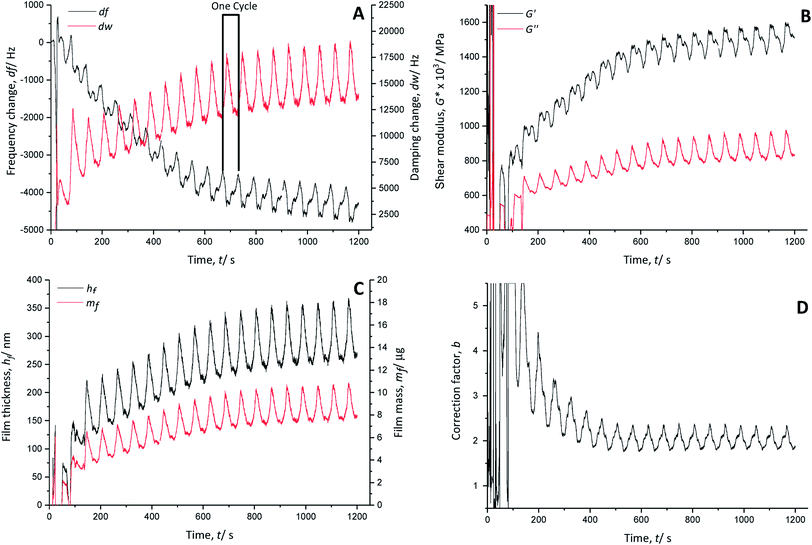
The temporal course of the resonance frequency shows an overall decrease and stabilisation around 740 s (∼cycle 12), indicating continuous growth of the polymer film on the quartz crystal (Fig. 3A). Each polymerisation cycle is characterised by a decrease of the resonance frequency followed by an increase, which are associated with the anion doping and de-doping, respectively. The anion doping during the monomer oxidation causes a decrease of the resonance frequency due to an increase of the polymer mass with inserted doping anions. The increase of the resonance frequency relates to the decrease of the polymer mass by removing the doping anions from the film during the reduction.
The calculated real G′ and imaginary G′′ parts of the shear modulus (Fig. 3B) show a similar trend to the frequency change. The overall increase of the shear modulus indicates a stiffening of the polymer film, whereas with every polymerisation cycle, a decrease followed by an increase occurs. The anion doping causes an increase of the polymer softness (decrease of G′), while the polymer film regains stiffness during anion de-doping (increase of G′).
The calculated film thickness of the whole polymer film (Fig. 3C) increases up to 360 nm during polymerisation. During doping/de-doping at every polymerisation cycle, the film thickness fluctuates by about 100 nm.
The mass of the polymer film (Fig. 3C) is increased constantly by adding a PEDOT layer with every polymerisation cycle.
The correction factor b (Fig. 3D) is 2.3 in the oxidised/doped state and 1.8 in the reduced/de-doped state after 12 cycles. A correction factor > 1 indicates that the film is very porous.
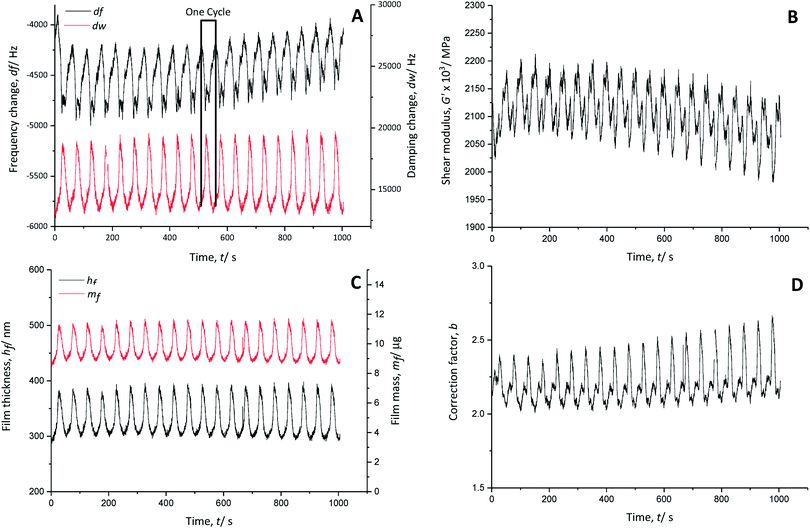
The real part of the shear modulus (Fig. 4B) shows an overall decrease, pointing to a slight increase of the polymer softness with time. Every charging cycle shows a clear decrease of the shear modulus, while every discharging cycle is characterised by an increase. Thus, the anion doping (charging reaction) causes a softening of the polymer film, which regains its stiffness when the anions are de-doped (discharge reaction).
The thickness of the PEDOT film (Fig. 4C) fluctuates about ±45 nm from its average value of 340 nm during charging and discharging cycles, indicating polymer swelling (increased film thickness) during doping of AlCl4− anions and contraction (decreased film thickness) during de-doping of AlCl4− anions.
There is nearly no net mass change in the polymer film during cycling time (Fig. 4C). The mass of the polymer increases when the film is doped with anions and decreases when it is de-doped. The PEDOT film reaches >95% reversibility in terms of the anion doping/de-doping. Therefore, the doping anion AlCl4− is not trapped in the polymer backbone during charging and discharging.
The electro-polymerised PEDOT film has a calculated correction factor b (Fig. 4D) between 2.0 and 2.6, indicating a very rough surface area.32 Assuming that meaningful values were used for the physical properties of the system, these values are two to three times larger than those reported for aqueous systems (b ∼ 0.8)20 due to the stronger interaction of PEDOT with the doping anion AlCl4−, where the doping is not hindered by hydrate shielding.
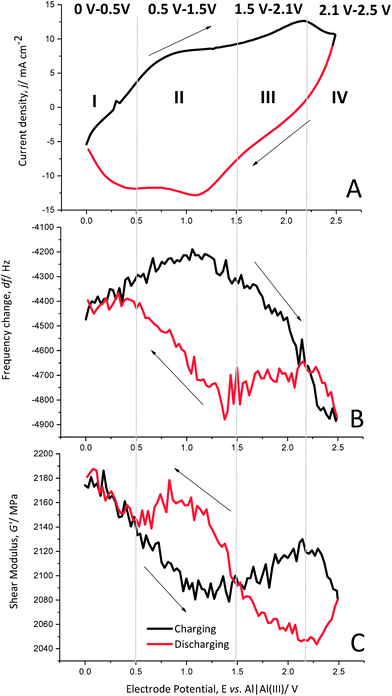
Each charging and discharging cycle can be divided into four potential areas with different behaviours, as shown by cyclic voltammetry (Fig. 5A), the change in the resonance frequency (Fig. 5B) and the calculated shear modulus (Fig. 5C) for cycle 10.
Oxidation potential window I (0 V to 0.5 V). In the beginning of the polymer charging (oxidation) from 0 V to 0.5 V vs. Al|Al(III), the current density increases slightly. The frequency change also shows only a slight increase, which implies no significant anion doping or de-doping. The shear modulus shows a clear decrease, indicating softening of the polymer.
Oxidation potential window II (0.5 V to 1.5 V). The following potential window from 0.5 V to 1.5 V vs. Al|Al(III) shows a wide oxidation peak of PEDOT, indicating the generation of positive charges in the polymer backbone. The frequency change reaches a maximum after a slight increase but does not yet show anion doping. The shear modulus decreases further to its minimum. Thus, the polymer is softest in this potential window.
Oxidation potential window III (1.5 V to 2.1 V). The further oxidation from 1.5 V to 2.1 V vs. Al|Al(III) shows another oxidation peak of PEDOT. At this potential window, the resonance frequency decreases significantly, which is a clear indication of anion doping. The shear modulus increases slightly, indicating a stiffening of the polymer backbone due to the large number of doping anions entering the polymer structure.
Oxidation potential window IV (2.1 V to 2.5 V). The last potential window from 2.1 V to 2.5 V vs. Al|Al(III) is characterised by a phase-out of the oxidation peak and a further significant decrease of the resonance frequency, clearly showing anion doping. The polymer softens again as the shear modulus decreases.
Reduction potential window IV (2.5 V to 2.1 V). The discharge reaction (towards reduction) shows that the current density decreases and the resonance frequency increases strongly, indicating reverse anion de-doping. The shear modulus decreases further, which may be related to the enhanced anion movement in the polymer backbone, opening paths between the polymer chains due to de-doping.
Reduction potential window III (2.1–1.5 V). The current density decreases almost linearly from 2.1 V to 1.5 V vs. Al|Al(III). Furthermore, there is almost no change in resonance frequency, indicating that there is no significant anion de-doping. However, the polymer stiffens as the shear modulus increases.
Reduction potential window II (1.5 V to 0.5 V). The potential window from 1.5 V to 0.5 V vs. Al|Al(III) shows a reduction peak of PEDOT, indicating the removal of repulsive forces between the polymer chains. This leads to contraction of the polymer paths accompanied with anion de-doping, as shown by the increasing resonance frequency and further stiffening of the polymer as the shear modulus increases to a maximum.
Reduction potential window I (0.5 V to 0 V). The current density increases from 0.5 V to 0 V vs. Al|Al(III) and the frequency change is almost constant, showing that the anion de-doping is complete. The shear modulus increases again to its initial value, showing that it regains the original stiffness of the polymer.
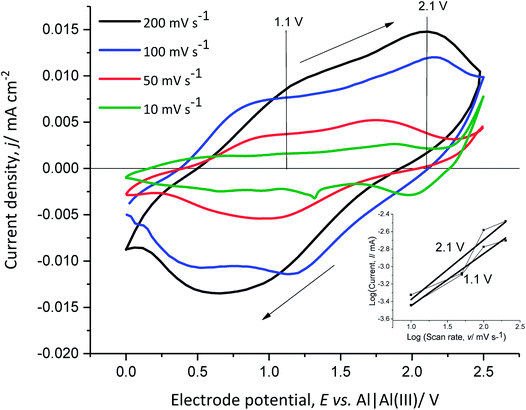
In order to better understand the dependence of the capacitive and faradaic behaviour of PEDOT on the state of charge/discharge, the scan rate of the CV of the polymer film was varied between 10 mV s−1 and 200 mV s−1 in monomer-free Lewis neutral EMImCl–AlCl3 (Fig. 6).
The anodic and cathodic current density increases with the scan rate from 10 mV s−1 to 200 mV s−1. The cathodic peak at 0.6 V vs. Al|Al(III) for 200 mV s−1 shifts towards higher potentials with decreasing scan rate. This indicates that the anion de-doping occurs at high electrode potentials and low scan rates, which demonstrates capacitive behaviour at higher potentials.
The slope of the linear function, obtained from the power–law relation (eqn (10)) by plotting the logarithm of the anodic current vs. the logarithm of the scan rate at 1.1 V and 2.1 V vs. Al|Al(III), provides information about the transport dynamics of the underlying charge-storage mechanism11,37 (Fig. 6 inset diagram).
| I(V) = zγx | (10) |
The calculated slopes x at 1.1 V and 2.1 V vs. Al|Al(III) are 0.6 and 0.7, respectively. A slope of 0.5 corresponds to a process limited by semi-infinite diffusion (faradaic behaviour) and a slope of 1 shows a surface-limited process, such as the adsorption of ions at a surface (pseudo-capacitive behaviour). The calculated values show that the oxidation of PEDOT (faradaic reaction) is accompanied by anion doping (pseudo-capacitive reaction) and that at higher anodic potentials (higher state of charge), (pseudo)-capacitive behaviour is predominant. This indicates that PEDOT as an electrode material can provide high specific energy at a low state of charge and high specific power at a high state of charge.
3.2. In situ atomic force microscopy
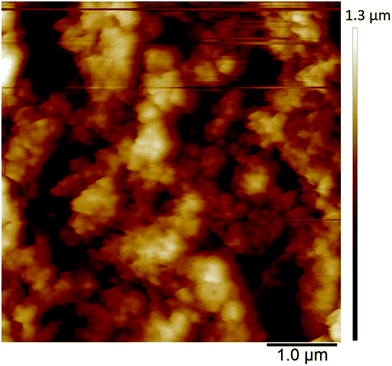
The in situ AFM measurements of PEDOT films in monomer-free Lewis neutral chloroaluminate ionic liquid provided information about the morphological changes of the polymer surface during charging/discharging (anion doping/de-doping) cycles.The morphology of PEDOT polymerised in Lewis neutral chloroaluminate ionic liquid appears to be very porous and granular (Fig. 7) when PEDOT is in its uncharged or un-doped state. The agglomerated grains have an average size of 100 nm, and the maximum height difference between the agglomerated areas reaches 1 μm (Fig. 7) (brighter areas have greater heights). The average surface roughness Ra is between 180 and 190 nm.
The polymer surface shows also local differences in terms of deformability (Fig. 8) in the uncharged state. It has been shown that PEDOT grows as vertically aligned granular pillars, which are directly connected to the substrate. These pillars, which appear as grains on the surface (Fig. 8A), are partially connected horizontally by a granular polymer layer. This layer has no direct contact with the substrate and is visible as stretched areas (Fig. 8A).14 The stretched areas are caused by the strong force applied between the tip and the polymer surface which is required to measure the deformability. It is assumed that the polymer pillars have lower deformability due to the direct contact with the substrate and appear as darker areas (Fig. 8B); the brighter areas with higher deformability can be attributed to the horizontally connecting polymer layers (Fig. 8B).
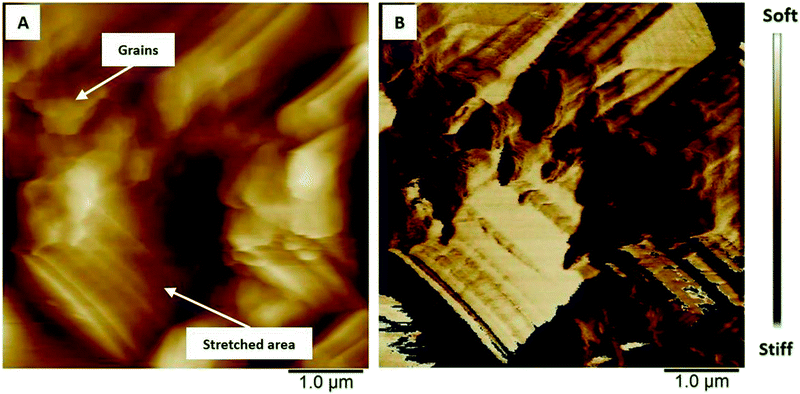 | ||
| Fig. 8 AFM images showing the differences in (A) height and (B) deformability of uncharged PEDOT in monomer-free Lewis neutral EMImCl–AlCl3. | ||
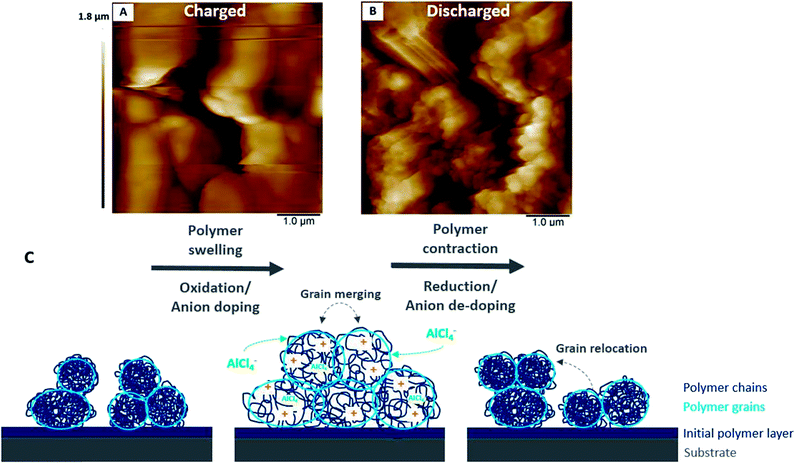
During the charging of un-doped PEDOT (Fig. 9A–E), the polymer oxidation and anion doping reaction causes the merging of the polymer granules. Conversely, during discharging (Fig. 9F–J), the polymer reduces and anion de-doping reaction occurs. This is characterised by a renewed separation of the granules, where the grain shape and position are not identical to the previous grain morphology before the charging reaction. The four areas indicated as squares a, b, c, and d (Fig. 9) clearly demonstrate the morphological changes and the merging of the granules and the reversible separation. The newly emerged grains have approximately the same sizes (∼100 nm) as the initial grains. Most areas show recovery of the initial morphology. However, area d appears to not regain its initial surface morphology after discharging. The overall surface roughness Rq decreases from 180 to 190 nm up to ∼160 nm during charging and increases again during discharging up to ∼180 nm, which indicates high morphological reversibility during cycling.
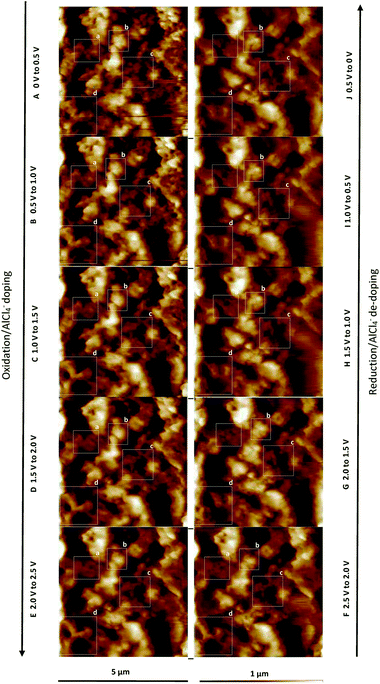 | ||
| Fig. 9 AFM images at different states of charge (A–E) and discharge (F–J). The square areas (a–d) show the morphological surface changes of PEDOT in detail. | ||
3.3. Suggested model
The previously discussed EQCM and AFM results suggest that the changes in the polymer stiffness/softness and morphology as well as the faradaic and (pseudo)-capacitive behaviour depending on the state of charge are associated with each other.The overall charging behaviour of PEDOT is characterised by swelling and softening of the grainy morphology accompanied by anion doping. Similarly, the discharging reaction shows contraction of the polymer grains, which regain stiffness. At the same time, the anions are fully de-doped. A closer look at each charging and discharging cycle reveals that the charge storage mechanisms depend on the state of charge.
A slight increase of the shear modulus and stiffening of the polymer at a high state of charge accompanies the polymer oxidation with simultaneous strong anion doping (pseudo-capacitive behaviour), which stretches and expands the polymer backbone to its boundaries. The strong anion doping at a high state of charge (>2.1 V vs. Al|Al(III)) suggests predominant pseudo-capacitive behaviour of the polymer.
Furthermore, it is assumed that the polymer swelling causes stronger interchain charge transport due to the merged polymer grains. For example, the anion doping/de-doping at a higher state of discharge (2.1 V to 2.5 V vs. Al|Al(III)) appears to be more pronounced as the resonance frequency significantly decreases/increases (Fig. 5B). This may be related to the swollen polymer morphology with opened transport paths for anions between the polymer chains. The anions have the ability to move in and out of the polymer backbone more readily. Furthermore, PEDOT shows more (pseudo)-capacitive behaviour due to the enhanced anion doping/de-doping at this higher electrode potential (>2.1 V vs. Al|Al(III)). This has been proven by the steeper slope calculated by the power–law relation (Fig. 6).
It can be concluded that an increasing state of charge is accompanied with an increase of (pseudo)-capacitive behaviour of PEDOT and a lower state of charge is characterised by faradaic or battery-like behaviour.
4. Conclusions and foresight
In this work, the morphological and viscoelastic changes of the conductive polymer PEDOT in Lewis neutral EMImCl–AlCl3 ionic liquid have been studied by in situ atomic force microscopy and electrochemical quartz crystal microbalance measurements in order to create a model for fundamental understanding of the hybrid battery-(pseudo)-capacitor characteristics of conductive polymers.It has been shown that:
(a) PEDOT undergoes a reversible morphological modification during charging (polymer oxidation) and discharging (polymer reduction) with simultaneous changes in its viscoelastic properties.
(b) The changes in the polymer characteristics are caused by polymer swelling and contraction phenomena, which can be explained by the generation and removal of repulsive forces between the monomer units accompanied by anion doping and de-doping of the polymer backbone.
(c) The charging reaction causes swelling and merging of the polymer grains as well as softening of the film. This enables fast charge transfer of doping anions at a high state of charge, which results in non-faradaic capacitor-like behaviour.
(d) The discharging reaction is characterised by contraction and separation of the previously merged polymer grains, whereas the grains relocate from their initial positions with decreasing state of charge. At the same time, the polymer regains its stiffness and shows pronounced faradaic battery-like behavior.
These fundamental insights suggest that electro-polymerised conductive polymers that contain no extra weight due to additives or binders can be used as safe and sustainable energy storage materials in non-aqueous systems. Furthermore, understanding the properties of a polymer in accordance with the state of charge has an important influence on polymer synthesis and design because the polymer morphology determines the performance and predominant electrode behaviour. Systematic structuring of the polymer can emphasise battery or capacitor characteristics depending on the wide range of applications.
Conflicts of interest
There are no conflicts to declare.List of symbols
Acknowledgements
This study is supported by the Centre for Doctoral Training in Sustainable Infrastructure Systems from the University of Southampton [EP/L01582X/1] and the International Consortium of Nanotechnology of the Lloyd's Register Foundation [G0086]. EFRE (European Regional Development Fund) and DFG (German Research Foundation) are kindly acknowledged for the financial support provided for the purchase of the AFM device. We thank Dr Cornel-Constantin Lalau for his valuable input and motivation to these studies. The raw data presented in this paper can be found at https://doi.org/10.5258/SOTON/D0635.References
- R. Korthauer, Handbook lithium-ion-batteries, Springer-Verlag Berlin Heidelberg, 2013 Search PubMed.
- D. Larcher and J.-M. Tarascon, Towards greener and more sustainable batteries for electrical energy storage, Nat. Chem., 2015, 7, 19–29 CrossRef PubMed.
- C. P. Grey and J. M. Tarascon, Sustainability and in situ monitoring in battery development, Nat. Mater., 2017, 16, 45–56 CrossRef PubMed.
- H. D. Yoo, E. Markevich, G. Salitra, D. Sharon and D. Aurbach, On the challenge of developing advanced technologies for electrochemical energy storage and conversion, Mater. Today, 2014, 17, 110–121 CrossRef.
- B. E. Conway and W. G. Pell, Double-layer and pseudocapacitance types of electrochemical capacitors and their applications to the development of hybrid devices, J. Solid State Electrochem., 2003, 7, 637–644 CrossRef.
- J. Heinze, B. A. Frontana-Uribe and S. Ludwigs, Electrochemistry of conducting polymers-persistent models and new concepts, Chem. Rev., 2010, 4724–4771 CrossRef PubMed.
- J. L. Bredas and G. B. Street. Polarons, Bipolarons, and Solitons in Conducting Polymers, Acc. Chem. Res., 1985, 18, 309–315 CrossRef.
- P. Simon and Y. Gogotsi, Materials for electrochemical capacitors, Nat. Mater., 2008, 7, 845–854 CrossRef PubMed.
- D. P. Dubal, O. Ayyad, V. Ruiz and P. Gomez-Romero, Hybrid energy storage: the merging of battery and supercapacitor chemistries, Chem. Soc. Rev., 2015, 44, 1777–1790 RSC.
- T. Brousse, D. Belanger and J. W. Long, To Be or Not To Be Pseudocapacitive?, J. Electrochem. Soc., 2015, 162, A5185–A5189 CrossRef.
- J. S. Ko, M. B. Sassin, D. R. Rolison and J. W. Long, Deconvolving double-layer, pseudocapacitance, and battery-like charge-storage mechanisms in nanoscale LiMn2O4 at 3D carbon architectures, Electrochim. Acta, 2018, 275, 225–235 CrossRef.
- C. Peng, S. Zhang, D. Jewell and G. Z. Chen, Carbon nanotube and conducting polymer composites for supercapacitors, Prog. Nat. Sci., 2008, 18, 777–788 CrossRef.
- G. A. Snook, P. Kao and A. S. Best, Conducting-polymer-based supercapacitor devices and electrodes, J. Power Sources, 2011, 196, 1–12 CrossRef.
- T. Schoetz, C. Ponce de Leon, A. Bund and M. Ueda, Electro-polymerisation of 3,4-ethylenedioxythiophene on reticulated vitreous carbon in imidazolium-based chloroaluminate ionic liquid as energy storage material, Electrochem. Commun., 2018, 89, 52–56 CrossRef.
- J. H. Park and O. O. Park, Hybrid electrochemical capacitors based on polyaniline and activated carbon electrodes, J. Power Sources, 2002, 185–190 CrossRef.
- P. Damlin, C. Kvarnström and A. Ivaska, Electrochemical synthesis and in situ spectroelectrochemical characterization of poly(3,4-ethylenedioxythiophene) (PEDOT) in room temperature ionic liquids, J. Electroanal. Chem., 2004, 570, 113–122 CrossRef.
- T. Schoetz, C. Ponce de Leon, A. Bund and M. Ueda, Electro-polymerisation and characterisation of PEDOT in Lewis basic, neutral and acidic EMImCl-AlCl3 ionic liquid, Electrochim. Acta, 2018, 263, 176–183 CrossRef.
- T. Schoetz, C. Ponce de Leon, M. Ueda and A. Bund, State of the art of rechargeable aluminium batteries in non-aqueous systems, J. Electrochem. Soc., 2017, 164, A1–A4 CrossRef.
- N. S. Hudak, Choroaluminate-doped conducting polymers as positive electrodes in rechargeable aluminium batteries, J. Phys. Chem., 2014, 118, 5203–5215 CrossRef PubMed.
- R. Peipmann, In situ Charakterisierung der viskoelastischen und elektrochemischen Eigenschaften von Poly(3,4-ethylendioxythiophen), Dissertation, Technische Universität Dresden, 2011 Search PubMed.
- H. L. Bandey, S. J. Martin, R. W. Cernosek and A. R. Hillman, Modeling the responses of thickness-shear mode resonators under various loading conditions, Anal. Chem., 1999, 71, 2205–2214 CrossRef PubMed.
- G. Sauerbrey, Verwendung von Schwingquarzen zur Wägung dünner Schichten und zur Mikrowägung, Z. Phys., 1959, 155, 206–222 CrossRef.
- S. J. Martin, H. L. Bandey, R. W. Cernosek, A. R. Hillman and M. J. Brown, Equivalent-circuit model for the thickness-shear mode resonator with a viscoelastic film near film resonance, Anal. Chem., 2000, 72, 141–149 CrossRef PubMed.
- V. Edwards Granstaff and S. J. Martin, Characterization of a thickness-shear mode quartz resonator with multiple nonpiezoelectric layers, J. Appl. Phys., 1994, 75, 1319–1329 CrossRef.
- H. L. Bandey, A. R. Hillman, M. J. Brown and S. J. Martin, Viscoelastic characterization of electroactive polymer films at the electrode/solution interface, Faraday Discuss., 1997, 107, 105–121 RSC.
- R. Lucklum, C. Behling, P. Hauptmann, R. W. Cernosek and S. J. Martin, Error analysis of material parameter determination with quartz-crystal resonators, Sens. Actuators, A, 1998, 66, 184–192 CrossRef.
- A. R. Hillman, A. Jackson and S. J. Martin, The Problem of Uniqueness of Fit for Viscoelastic Films on Thickness-Shear Mode Resonator Surfaces, Anal. Chem., 2001, 73, 540–549 CrossRef PubMed.
- E. J. Calvo and R. Etchenique, Viscoelastic Changes in Os-Containing Poly(allylamine) Based Redox Hydrogels for Amperometric Enzyme Electrodes:
![[thin space (1/6-em)]](https://www.rsc.org/images/entities/char_2009.gif) An EQCM Study, J. Phys. Chem. B, 1999, 103, 8944–8950 CrossRef.
An EQCM Study, J. Phys. Chem. B, 1999, 103, 8944–8950 CrossRef. - A. Ispas, R. Peipmann, A. Bund and I. Efimov, On the p-doping of PEDOT layers in various ionic liquids studied by EQCM and acoustic impedance, Electrochim. Acta, 2009, 54, 4668–4675 CrossRef.
- I. Efimov, A. Ispas and A. Bund, Taking into account of surface roughness for the calculation of elastic moduli of polymer films from acoustic impedance data, Electrochim. Acta, 2014, 122, 16–20 CrossRef.
- V.-T. Gruia, A. Ispas, M. Wilke, I. Efimov and A. Bund, Application of acoustic impedance method to monitoring of sensors:Metal deposition on viscoelastic polymer substrate, Electrochim. Acta, 2014, 118, 88–91 CrossRef.
- S. Koehler, A. Bund and I. Efimov, Shear moduli of anion and cation exchanging polypyrrole films, J. Electroanal. Chem., 2006, 589, 82–86 CrossRef.
- I. Efimov, S. Koehler and A. Bund, Temperature dependence of the complex shear modulus of cation and anion exchanging poly(pyrrole) films, J. Electroanal. Chem., 2007, 605, 61–67 CrossRef.
- A. Ispas, E. Wolff and A. Bund, An Electrochemical Quartz Crystal Microbalance Study on Electrodeposition of Aluminum and Aluminum-Manganese Alloys, J. Electrochem. Soc., 2017, 164, 5263–5270 CrossRef.
- L. Daikhin, E. Gileadi, G. Katz, V. Tsionsky, M. Urbakh and D. Zagidulin, Influence of Roughness on the Admittance of the Quartz Crystal Microbalance Immersed in Liquids, Anal. Chem., 2002, 74, 554–561 CrossRef PubMed.
- M. Urbakh and L. Daikhin, Roughness effect on the frequency of a quartz-crystal resonator in contact with a liquid, Phys. Rev. B, 1994, 49, 4866–4870 CrossRef.
- Y. Yan, B. Hao, D. Wang, G. Chen, E. Markweg, A. Albrecht and P. Schaaf, Understanding the fast lithium storage performance of hydrogenated TiO2 nanoparticles, J. Mater. Chem. A, 2013, 1, 14507–14513 RSC.
- L. T. T. Kim, C. Gabrielli, A. Pailleret and H. Perrot, Ions/Solvent Exchanges and Electromechanical Processes in Hexasulfonated Calix[6]Arene Doped Polypyrrole Films: Towards a Relaxation Mechanism, Electrochem. Solid-State Lett., 2011, 14, F9–F11 CrossRef.
Footnote |
| † Electronic supplementary information (ESI) available. See DOI: 10.1039/c8ta06757k |
| This journal is © The Royal Society of Chemistry 2018 |

