 Open Access Article
The effect of side-chain substitution on the aggregation and photovoltaic performance of diketopyrrolopyrrole-alt-dicarboxylic ester bithiophene polymers†
Ruurd
Heuvel
a,
Fallon J. M.
Colberts
a,
Junyu
Li
b,
Martijn M.
Wienk
ac and
René A. J.
Janssen
 *ac
*ac
aMolecular Materials and Nanosystems, Institute for Complex Molecular Systems, Eindhoven University of Technology, P.O. Box 513, 5600 MB Eindhoven, The Netherlands. E-mail: r.a.j.janssen@tue.nl
bDSM DMSC R&D Solutions, P.O. Box 18, 6160 MD Geleen, The Netherlands
cDutch Institute for Fundamental Energy Research, De Zaale 20, 5612 AJ Eindhoven, The Netherlands
First published on 17th October 2018
Abstract
Using a dicarboxylic ester bithiophene (DCBT) co-monomer, electron-withdrawing ester groups are introduced on the two central thiophene rings of an alternating donor–acceptor polymer (PDPP4T) consisting of diketopyrrolopyrrole (DPP) and quaterthiophene (4T) to increase the oxidation potential and reduce the photon energy loss in solar cells. To counteract the increased solubility of the PDPPDCBT polymers owing to the ester side chains, linear instead of branched side chains were used on the DPP monomer. The length of the ester side chains was varied to study their effect on the optoelectronic properties, morphology and photovoltaic performance of these polymers in bulk-heterojunction blends with PC71BM as acceptor. The molecular weight of PDPPDCBT is limited, because the bisstannyl-DPP monomer could not be completely purified from mono-functional analogues. By using a non-stoichiometric monomer ratio or a branching unit, the molecular weights were improved to ∼35 kDa. A maximum power conversion efficiency of PCE = 5.7% was obtained. Compared to the parent PDPP4T (PCE 7.0%), the photon energy loss for the best PDPPDCBT was reduced from 0.79 to 0.76 eV, but the photon-to-electron quantum efficiency was reduced, as a consequence of a too coarse phase separation, as studied with two-dimensional grazing-incidence X-ray scattering and transmission electron microscopy.
Introduction
Polymer photovoltaics has received an increasing amount of attention over the past decades. The high extinction coefficients of conjugated polymers and the possibility of solution processing have made flexible, large area solar cells and roll-to-roll processing possible.1–5 However, one of the main hurdles towards commercialization remains the relatively low power conversion efficiency (PCE) when compared to established photovoltaic techniques such as crystalline silicon.6 Bulk heterojunction (BHJ) devices using fullerenes as the acceptor have reached to 11.7%,7 whereas the recent use of non-fullerene acceptors have pushed the efficiencies of polymer solar cells to over 13%.8,9 Deconvolution of the photovoltaic efficiency into three separate parameters has made it easier to understand and improve performance. Since the power conversion efficiency is the product of short-circuit current density (Jsc), open-circuit voltage (Voc) and fill factor, all three need to be maximized to obtain good efficiency. Jsc is directly related to the external quantum efficiency which has already been shown to reach up to or over 80% in favourable cases,10,11 ensuring good current generation and extraction. The fill factor, a measure for charge transport and extraction, has also been shown to reach to high values.12,13 Optimizing the open-circuit voltage is however troubled by the excitonic nature of photoexcitations in organic semiconductors. The energy that is lost when a photon, absorbed at the bandgap (Eg), is converted into a photo-voltage is usually expressed as Eloss = Eg − qVoc,14–16 where Eg is the lowest optical bandgap between donor and acceptor materials and q the electron charge. While thermalization losses associated with a relaxation of the excited state are inevitable, actual losses are usually much higher due to additional energy loss in exciton dissociation at the donor–acceptor interface and non-radiative recombination.17,18 Especially for lower bandgap materials about half of the excitation energy is lost. Empirically, the open-circuit voltage is related to the energy level of highest occupied molecular orbital (HOMO) of the donor and the lowest unoccupied molecular orbital (LUMO) of the acceptor via qVoc = EHOMO,D − ELUMO,A − 0.3 eV.19 Hence a higher Voc and concomitant decreased energy loss can be achieved by either raising the LUMO of the acceptor or lowering the HOMO of the donor. However, care has to be taken to maintain sufficient difference between the LUMO and HOMO energy levels of the donor and acceptor (estimated to be of 0.3 eV) to facilitate efficient charge separation, especially for fullerene based acceptors.The diketopyrrolopyrrole (DPP) unit has been a popular candidate for the donor–acceptor type conjugated polymers used in organic photovoltaics. DPP containing polymers often show low bandgaps due to their strongly accepting nature which extends their absorption to the near infrared. Furthermore, the high tendency to crystallize enables high charge carrier mobilities for these polymers.20–22 DPP polymers are among the most efficient low band gap donor polymers for photovoltaic applications, reporting PCEs up to 9.6%,23,24 and can be particularly useful for multi-junction solar cells.25,26 However, other than the flanking aromatic moiety, the DPP unit offers little in substitution positions that can be used to modify and optimize energy levels. Hence, a wide variety of donor monomers have been used to co-polymerize with DPP. Due to their low optical band gap, the Voc of most DPP polymers is lower, but the photon energy loss can be in the range of 0.6 eV,16 similar to other recent high performing materials. The recent surge of non-fullerene acceptors,27 has not yet resulted in higher efficiencies in combination with DPP-based polymers. For example with the well-known non-fullerene acceptor 3,9-bis(2-methylene-(3-(1,1-dicyanomethylene)-indanone))-5,5,11,11-tetrakis(4-hexylphenyl)-dithieno[2,3-d:2′,3′-d′]-s-indaceno-[1,2-b:5,6-b′]dithiophene (ITIC), DPP-polymers show lower PCEs than with fullerene acceptors, which has been attributed to a coarser blend morphology.28
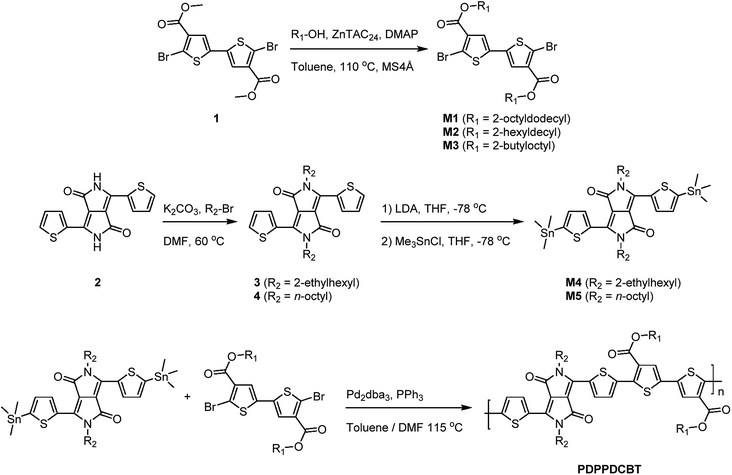
One of the more successful DPP polymers is the PDPP4T polymer, in which DPP is alternating with quaterthienyl (4T).29–31 With Eg = 1.43 eV and Voc = 0.64 eV the photon energy loss of PDPP4T-fullerene based solar cells is about 0.79 eV, and much more than the empirical threshold ∼0.6 eV.16 Because the HOMO level of this polymer is primarily determined by the electron rich 4T unit, it can be lowered by introducing electron withdrawing groups on this moiety. The introduction of ester side chains has proven an effective way to lower the HOMO and LUMO energy levels in wide bandgap solar cells.32,33 Hence, it is of interest to investigate introducing a dicarboxylic ester bithiophene moiety as central part of the quaterthienyl (4T) unit of PDPP4T to reduce the HOMO energy level. With the introduction of additional ester side chains, the effect on the morphology needs to be controlled as the solubility of the polymer is known to have a large influence on the fibre width in BHJ blends.22,34 To that extent the length and nature of the solubilizing side chains has been varied to obtain four structurally different PDPP4T derivatives (Scheme 1). Furthermore, the importance of monomer purity and its effect on molecular weight and photovoltaic performance is highlighted. Poor morphology due to limited molecular weight can be contested by the introduction of branching in the polymer backbone as was shown before.35
Results and discussion
To investigate the effect of lowering the energy levels of the PDPP4T polymers, four polymers consisting of the diketopyrrolopyrrole acceptor block and the dicarboxcylic ester bithiophene donor block were synthesized via Stille polycondensation reactions. Different side-chains were introduced to optimize the morphology and study the effect on the aggregation behaviour of the polymer. Monomers M1–M3 were obtained in high yield and high purity via the zinc catalysed transesterification reaction of 1 using an excess of the corresponding alcohol.36,37 Precursor 1 was synthesized via a previously reported procedure.38 Monomers M4 and M5 were obtained by functionalizing 3,6-di(thiophen-2-yl)-2,5-dihydropyrrolo[3,4-c]pyrrole-1,4-dione (2) with the corresponding alkyl-bromide side-chain followed by lithiation and stannylation. It has to be noted that the resulting DPP-bisstannyl compounds M4 and M5 are highly unstable, complicating purification using available techniques. The highest purities reached were ∼98% for M4 and ∼97% for M5 as inferred from 1H-NMR (Fig. S1–S3, ESI†). The remaining impurity in each case is primarily the mono-stannylated derivative, which hinders polymerization and limits molecular weight by acting as an end-capper. Due to the condensation nature of the Stille coupling reaction, the Stille polycondensation is assumed to fall into the class of step-growth polymerizations.39 Although catalyst transfer can change the kinetics of the polymerization towards that of a chain-growth polymerization, such behavior has mainly been seen for A–B type monomers rather than the A–A/B–B mixtures.40–42 For such step-growth polymerizations to be successful, three conditions have to be satisfied in order to obtain high molecular weight polymers. First, a high yielding reaction needs to be used with a minimum of side reactions. Second, a perfectly balanced stoichiometry of the monomers needs to be ensured. Third, both monomers need to be of high purity. When these conditions are met, this type of polymerization can be approached mathematically as was proposed by Carothers:43,44 | (1) |
![[X with combining macron]](https://www.rsc.org/images/entities/i_char_0058_0304.gif) n is the number average degree of polymerization and p the fraction of monomer conversion. However, upon introduction of impurities in either one of the monomers, in this case the DPP-stannyl, two effects can be expected. The presence of the impurity, regardless, of its nature will introduce a stoichiometric imbalance between the two monomers. If not properly corrected for the imbalance, this will limit the degree of polymerization following:
n is the number average degree of polymerization and p the fraction of monomer conversion. However, upon introduction of impurities in either one of the monomers, in this case the DPP-stannyl, two effects can be expected. The presence of the impurity, regardless, of its nature will introduce a stoichiometric imbalance between the two monomers. If not properly corrected for the imbalance, this will limit the degree of polymerization following: | (2) |
Polymerizations were carried out as conventionally heated Stille polycondensation reactions using (dibenzylideneacetone)dipalladium(0) (Pd2dba3) as palladium source and triphenylphosphine (PPh3) as ligand. The resulting polymers were then treated with ethylenediaminetetraacetic acid for scavenging palladium, followed by an extraction with water, concentration of the solution and precipitation in methanol. The precipitated solid was then subjected to Soxhlet extraction and fractionation using acetone, hexane, dichloromethane and chloroform. Any remaining solids were dissolved in 1,1,2,2-tetrachloroethane (TCE) at 140 °C. Molecular weights measured by high-temperature (140 °C) gel permeation chromatography (GPC) in o-dichlorobenzene (oDCB) are collected in Table 1. Despite the fractionation, trends similar to those predicted by Carothers can be seen. For the C8-HD polymers an increase in monomer purity (M5) from 76% to 97% brings about an increase in molecular weight from 20.5 for C8-HD(L) to 29.9 kDa for C8-HD(H). All other polymers synthesized with a purer bistannyl monomer M5 show molecular weights around 30 kDa. According to eqn (2), the molecular weight can be further increased by compensating the amount of bistannyl monomer for the degree of impurity. When 3% of additional monomer M5 was added to the reaction mixture, the molecular weight of C8-OD increased from 27.2 kDa for C8-OD(L) to 33.8 kDa for C8-OD(H). An alternative way of increasing molecular weight and polymer–polymer interaction is by introducing branching into the polymer chain. Previously it was shown that a small amount of branching can impact the solubility of the polymer greatly, resulting in enhanced photovoltaic performance.29 With the introduction of 1 mol% of 1,3,5-tribromobenzene as branching reagent, the number average molecular weight of the resulting polymer (C8-OD(B)) increases to 33.2 kDa, i.e. a 22% increase compared to the reference (C8-OD(L)).
| R1 | R2 |
![[M with combining macron]](https://www.rsc.org/images/entities/i_char_004d_0304.gif) n [kDa]
n [kDa] |
PDI | λ max [nm] | E g [eV] | |
|---|---|---|---|---|---|---|
| a Corresponding to the highest wavelength vibronic peak (shoulder) of the polymer in chloroform solution. b Corresponding to the onset of absorption of thin films. c Synthesized from M4 (98% pure). d Synthesized from M5 (97% pure). e Synthesized using 3 mol% excess of M5. f Synthesized with 1 mol% 1,3,5-tribromobenzene. g Synthesized from M5 (76% pure). | ||||||
| EH-OD | OD | EH | 19.5 | 3.08 | 746(832) | 1.40 |
| C8-OD(L) | OD | C8 | 27.2 | 2.28 | 775 | 1.42 |
| C8-OD(H) , | OD | C8 | 33.8 | 2.30 | 774 | 1.42 |
| C8-OD(B) , | OD | C8 | 33.2 | 2.28 | 775 | 1.43 |
| C8-HD(L) | HD | C8 | 20.5 | 2.47 | 774 | 1.39 |
| C8-HD(H) | HD | C8 | 29.9 | 1.98 | 776 | 1.39 |
| C8-BO | BO | C8 | 15.3 | 1.61 | 806 | 1.38 |
For a step-growth polymerization the expressions for number average ![[M with combining macron]](https://www.rsc.org/images/entities/i_char_004d_0304.gif) n and weight average molecular weight
n and weight average molecular weight ![[M with combining macron]](https://www.rsc.org/images/entities/i_char_004d_0304.gif) w, as well as the polydispersity index (PDI) are:
w, as well as the polydispersity index (PDI) are:
 | (3) |
The optical absorption spectra recorded in chloroform solution are shown for EH-OD, C8-OD(B), C8-HD(H) and C8-BO in Fig. 1a. For the other C8-OD(L,H) and C8-HD(L) polymers the spectra are virtually identical to those of C8-OD(B), C8-HD(H) (Fig. S4 and S5, ESI†). The absorption coefficients, determined in dilute chloroform solution, show an overall increasing trend with increased conjugation length (Fig. S6, ESI†). The EH-OD polymer is more soluble and shows less aggregation due to the branched nature of the 2-ethylhexyl side chains on the DPP unit. Accordingly, a more blue-shifted absorption spectrum is observed with only a small contribution of the high wavelength aggregation shoulder. Additional backbone twisting can account for both the blue-shifted spectrum as well as the decreased absorption coefficient. Breaking of the conjugation by the introduction of cross-conjugated branching monomers might explain a similar drop of the absorption coefficient for C8-OD(B) with respect to that of C8-OD(L). The shorter side chains of the C8-BO polymer result in a poorly soluble material, exhibiting a high degree of aggregation. Due to increased π–π interaction and a more planar backbone, an increased delocalization of the excitation results in a small red shift of the absorption spectrum. A small, but distinct effect of the length of the ester side chain can be seen in thin film spectra (Fig. 1b) of the C8 polymers. The bandgap decreases with decreasing side-chain length. The more disordered nature of the branched side-chain EH-OD polymer shows through the absence of vibrionic fine structure, even though the bandgap is somewhat smaller than that of its linear side-chain counterpart (C8-OD). Overall, the optical bandgaps of the PDPPDCBT polymers are very similar to that of the PDPP4T polymer with Eg = 1.43 eV.23
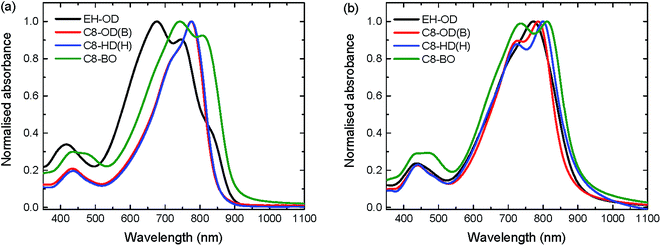 | ||
| Fig. 1 UV-vis absorption spectra of a selection of PDPPDCBT polymers. (a) In chloroform solution. (b) As thin film cast from chloroform solution. | ||
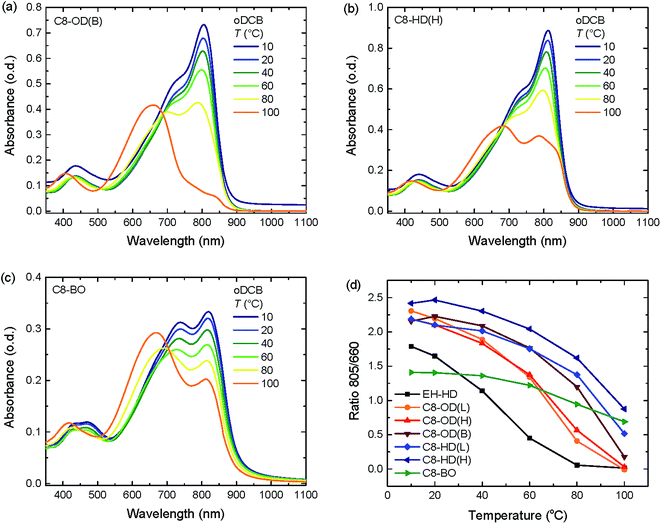
Temperature dependent absorption spectra, measured in oDCB solution (Fig. 2 and S7 ESI†) show that there is less residual aggregation for the C8-DPP polymers at higher temperatures when the ester sider chains increase in length. For the EH-OD derivative, no aggregation can be observed at 100 °C (Fig. S7c, ESI†). This emphasizes the more disordered nature of this polymer, which is in line with the branched side-chain substitution on both DPP and DCBT. The C8-BO polymer, on the other hand, shows only a minor loss in aggregation at high temperatures (Fig. 2c). This behaviour is related to the poor solubility of the polymer in oDCB, even at 100 °C. The remaining polymers follow the trend of increasing aggregation with decreasing side-chain length. Furthermore, an additional trend can be seen between lower and higher molecular weight polymers, were the higher molecular weight causes more inter-chain interactions leading to more aggregation. Finally, prolonged retention of aggregation at higher temperatures can be observed for the branched C8-OD(B) polymer with respect to the other C8-OD(L) and C8-OD(H) polymers (Fig. 2).
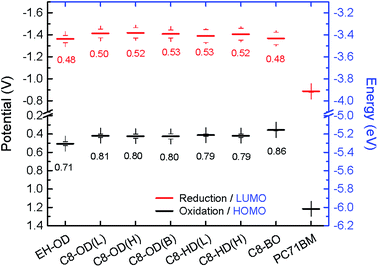
The energy levels of the PDPPDCBT polymers were measured by square wave voltammetry, using a platinum wire dipped in a 2 mg mL−1 polymer solution in chloroform as working electrode (Fig. 3, Table 2). The obtained onsets of oxidation/reduction referenced vs. the ferrocene/ferrocenium redox couple were converted into HOMO/LUMO levels by using the relation EHOMO/LUMO = −(Eox/red + 4.8). Electrochemical potentials are generally affected by interactions between polymer, electrolyte and electrode. To facilitate comparison, energy levels of PC71BM ([6,6]-phenyl-C71-butylric acid methyl ester) were measured under identical conditions. The HOMO and LUMO offset are plotted in Fig. 3. From these data it can be seen that all polymers have a sufficiently large (>0.3 eV) HOMO and LUMO offset with PC71BM. It can be seen that energy levels of the PDPPDCBT polymers are fairly similar, analogous to the results obtained by UV-vis absorption spectroscopy. C8-BO shows a slightly decrease in electronic bandgap, most likely due to the more aggregated nature of the polymer. EH-OD shows somewhat decreased energy levels reflecting its more amorphous nature.
| E ox [V] | E HOMO [eV] | E red [V] | E LUMO [eV] | |
|---|---|---|---|---|
| EH-OD | 0.51 | −5.31 | −1.36 | −3.44 |
| C8-OD(L) | 0.42 | −5.22 | −1.41 | −3.39 |
| C8-OD(H) | 0.42 | −5.22 | −1.42 | −3.38 |
| C8-OD(B) | 0.43 | −5.23 | −1.41 | −3.39 |
| C8-HD(L) | 0.41 | −5.21 | −1.39 | −3.41 |
| C8-HD(H) | 0.42 | −5.22 | −1.41 | −3.39 |
| C8-BO | 0.35 | −5.16 | −1.37 | −3.43 |
The photovoltaic characteristics of the PDPPDCBT polymers were studied in a conventional device architecture using PC71BM as the acceptor. A bulk heterojunction blend of PDPPDCBT polymer donor and PC71BM acceptor was placed between an ITO/PEDOT:PSS hole-collecting electrode and LiF/Al electron-collecting electrode. Characterization was carried out by measuring current density–voltage (J–V) characteristics in the dark and under 100 mW cm−2 of simulated AM1.5G light (Table 3, Fig. 4a, S8 and S9, ESI†). All active layers were processed from a room temperature solution in chloroform, containing the active layer blend and diphenyl ether (DPE) as co-solvent. The exception was the C8-BO polymer, which was processed from a hot (100 °C) TCE solution, also using DPE as co-solvent. The cells were optimized for donor–acceptor ratio, layer thickness and amount of co-solvent (Fig. S10, ESI†). Device statistics for optimized conditions can be found in Table S1 (ESI†).
| d [nm] | J sc [mA cm−2] | V oc [V] | FF | PCE [%] | EQEmaxc | |
|---|---|---|---|---|---|---|
| a Active layer thickness. b Corrected for spectral mismatch by integrating the EQE with the AM1.5G spectrum. c For the wavelength region above 680 nm. | ||||||
| EH-OD | 110 | 10.41 | 0.67 | 0.49 | 3.42 | 0.32 |
| C8-OD(L) | 110 | 9.64 | 0.67 | 0.72 | 4.65 | 0.27 |
| C8-OD(H) | 120 | 11.81 | 0.68 | 0.69 | 5.54 | 0.38 |
| C8-OD(B) | 116 | 12.14 | 0.67 | 0.70 | 5.69 | 0.41 |
| C8-HD(L) | 124 | 10.09 | 0.67 | 0.71 | 4.80 | 0.31 |
| C8-HD(H) | 121 | 11.51 | 0.67 | 0.65 | 5.01 | 0.39 |
| C8-BO | 128 | 13.51 | 0.66 | 0.59 | 5.26 | 0.45 |
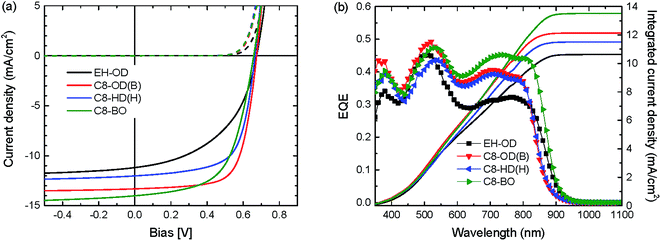 | ||
| Fig. 4 (a) J–V and (b) EQE characteristics of optimized bulk heterojunction solar cells of a selection of PDPPDCBT polymers. Solid lines in panel (b) are AM1.5G integrated currents. | ||
For the optimized cells, only minor variations in Voc (0.66 to 0.68 V) are observed for the different polymers. The Vocs for are all PDPPDCBT are slightly higher than the Voc reported for the PDPP4T polymer (Voc = 0.64 V).23 The Jscs clearly reflect the differences in aggregation and in particular that of the molecular weight. However the Jscs are lower than that found previously for PDPP4T (16 mA cm−2). Only the Jsc of the C8-BO polymer approaches the value reported for PDPP4T.23 Despite the higher current produced by the C8-BO polymer, the branched C8-OD polymer performs best due to a significantly higher fill factor at a PCE of 5.7% (Jsc = 12.14 mA cm−2, Voc = 0.67 V, FF = 0.71). Compared to the maximum EQE of 60% for PDPP4T:PC71BM, the EQE of the C8-OD(B):PC71BM blend is only 41%. For most blends, the EQE shows a large difference between the contributions of the polymer (at 650–800 nm) and the fullerene (at ∼500 nm) (Fig. 4b). Since the HOMO–HOMO offset and the LUMO–LUMO offset between polymer donor and fullerene acceptor are believed to be sufficient and the imbalance in contribution decreases with decreasing solubility, it is thought to be related to the donor domain spacing.23 Highly crystalline polymers, and DPP polymers in particular, are notorious for their short exciton lifetimes,45 resulting in relatively low exciton diffusion lengths. Upon increasing the domain size of the PDPPDCBT polymers a lower fraction of excitons will reach the donor/acceptor interface and contribute to photocurrent generation. Previous studies have shown that solubility and molecular weight play an important role in fibre formation and therefore determine to a large extend the polymer domain size.28 A possible explanation is the relatively low molecular weight of the polymer used in this study (15.3–33.8 kDa) compared to those obtained for PDPP4T (219 kDa). It has to be noted that the molecular weight of PDPP4T has been measured at a lower temperature, increasing the amount of aggregation and the overestimation of the molecular weight.
To elucidate the role of the side chains on the layer morphology we measured two-dimensional grazing-incidence wide-angle X-ray scattering (2D-GIWAXS) on the pristine PDPPDCBT polymers and their photoactive blends with PC71BM (Fig. S11 and S12, ESI†). The out-of-plane and in-plane line cuts of the 2D-GIWAXS patterns for the four PDPPDCBT:PC71BM blends are shown in Fig. 5 and the corresponding line cuts for the pristine polymers are shown in Fig. S13 (ESI†). The 2D-GIWAXS results reveal that the polymer with EH-OD side chains is essentially amorphous, showing only a weak amorphous halo caused by the lamellar spacing in the in-plane direction. In contrast, the three polymers with C8-OD, C8-HD and C8-BO side chains show pronounced crystallinity and are predominantly “face-on” oriented in the pristine and blend films as evidenced by the (010) reflection corresponding to the π–π stacking in the out-of-plane direction at q = 1.73 ± 0.02 Å−1 and by the (100) reflection of the lamellar spacing in the in-plane direction q = 0.26 ± 0.02 Å−1. With the exception of C8-HD, the blends do not show higher order (k00) diffraction peaks in the 2D-GIWAXS that are characteristic of highly ordered crystalline properties. The reflection of PC71BM is seen at q = 1.34 ± 0.01 Å−1 in the blends. The crystallographic parameters of the PDPPDCBT polymers are collected in Table 4. Interestingly, the π–π stacking distance is reduced from 3.63 to 3.51 Å, when going to shorter ester side chains. This suggests that the longer and more voluminous side chains also disturb the π–π stacking. As expected, the lamellar spacing of the three C8 polymers decreases, going from the longest OD, via HD to the shortest BO side chains. Introducing a branching side-chain on the DPP, however, interrupts the packing greatly and we surmise that the linear side chains on the DPP unit enhance the tendency for these polymers to aggregate.
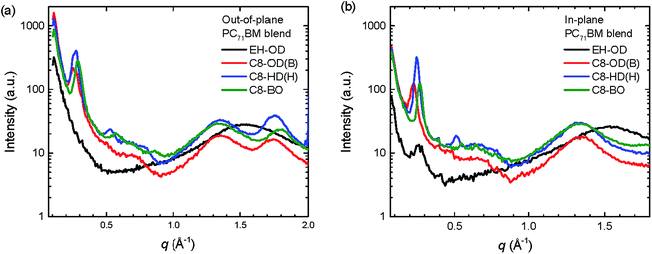 | ||
| Fig. 5 Out-of-plane (a) and in-plane (b) line cuts of the 2D-GIWAXS patterns of PDPPDCBT:PC71BM blends. | ||
| 2D-GIWAXS | TEM | ||
|---|---|---|---|
| Lamellar (Å) | π–π (Å) | Lamellar (Å) | |
| EH-OD | 24.3 ± 0.4 | ||
| C8-OD(B) | 26.9 ± 1.0 | 3.63 ± 0.02 | 26 |
| C8-HD(H) | 25.4 ± 0.3 | 3.59 ± 0.02 | 24 |
| C8-BO | 22.8 ± 0.3 | 3.51 ± 0.01 | 23 |
To obtain insight into the donor and acceptor domain sizes, transmission electron microscopy (TEM) was carried out. The active layers of optimized devices were floated by dissolving the underlying layer of PEDOT:PSS and transferred to a TEM grid. The TEM images show clear nanoscale phase separation with bright fibrillary structures of the PDPPDCBT polymers and darker domains of PC71BM (Fig. 6 and S13, ESI†). In the TEM images of the film containing the EH-OD polymer (Fig. 6a), the fibrils seem less well-defined and more curved but distinct differences in the morphologies of the PC71BM blends with C8-OD(B), C8-OD(H) or C8-BO polymers are difficult to identify (Fig. 6b–d).
At higher magnification, the TEM images show that in all films (except EH-OD) the polymer fibrils are semi-crystalline. Clear lattice fringes corresponding to the lamellar spacing are observed. We note that the appearance of the lamellar spacing in (top view) TEM is consistent with the “face-on” orientation of the polymers as identified from 2D-GIWAXS. Fig. 7 shows the TEM images of the PC71BM blends with the three C8-OD polymers and that of C8-BO at higher magnification. The corresponding images for the three other polymers are shown in Fig. S15 (ESI†). In the C8-OD(L) blend (Fig. 7a) the lateral dimensions of the fibrils appear larger than those of C8-OD(H) and C8-OD(B) (Fig. 7b and c), which in turn are larger than those of C8-BO (Fig. 7d). The crystalline regions in the C8-OD(L) blend are several tens of nanometres wide, which exceeds the typical exciton diffusion length of ∼5 nm in semiconducting polymers.39,46 For the C8-OD polymers the decrease in fibril width corresponds to increasing molecular weight. This reduction of fibril width for the different polymers is related to a decreasing solubility.28,29 The fibrillary networks are formed in a process governed by nucleation-and-growth of free polymers, and less soluble polymers have a smaller critical nucleus size.28 The decrease in fibril width in the series C8-OD(L) > C8-OD(H) > C8-OD(B) > C8-BO is reflected in the steady increase in EQEmax from 0.27 for C8-OD(L) to 0.45 for C8-BO (Table 3). This inverse relation between width and EQE is related to the limited exciton diffusion in conjugated polymers, which limits the fraction of excitons that reaches the interface with the PC71BM to generate charges.
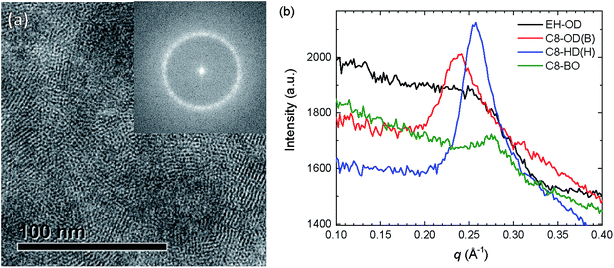
In order to verify the crystallinity of the polymers, the high-magnification TEM micrographs were subjected to Fourier transformation (Fig. 8a and S16, ESI†). Fig. 8a shows clearly the crystalline domains of C8-HD(H) in the blend with PC71BM. The Fourier transformed image was then radially integrated and its intensity plotted against the reciprocal distance (Fig. 8b and S17, ESI†). From this plot we can estimate the degree of crystallinity. Clear peaks can be seen for the blends based on the C8-OD and C8-HD polymers. For the EH-OD polymer no peak can be observed indicating the absence of crystalline fringes in the TEM and confirming the amorphous nature of the polymer inferred from 2D-GIWAXS. Peak positions show agreement with the expected changes in d-spacing for the differently side-chained polymers, and very similar d-spacing are found for blends based on polymers with identical side chains. The average d-spacing changes from ∼26 Å for C8-OD, via ∼24 Å for C8-HD, to ∼23 Å for C8-BO, and is in good agreement with the distances inferred from 2D-GIWAX (Table 4). Fig. S16 (ESI†) reveals a preferred orientation of the lamellar spacing in the blend films as inferred from the presence of two symmetric arcs rather than (pixelated) full circle patterns in the Fourier transforms. We have not analysed this phenomenon in detail, which would involve a full statistical analysis over many positions in the film, but it suggests that in some cases the preferred orientation of the crystallites extends over an area of 350 × 350 nm2 (size of the image), even though the semi-crystalline regions themselves are much smaller.
Conclusion
In conclusion, we have synthesized a series of different polymers consisting of the same DPPDCBT backbone, but varying the nature and/or length of the side-chains on either the DPP or the DCBT moiety. These polymers were studied for their optical properties and the effect of the side chains on their aggregation behaviour and photovoltaic performance. The synthesis of these polymers shows once more the need for highly pure monomers and the corresponding impact of impurities on the molecular weight. Due to the identical backbones the optical and electronic properties of these polymers were very similar, showing a weak trend with that of solubility, i.e. side-chain length and molecular weight. Photovoltaic results show slightly higher open-circuit voltages (0.66–0.68 V) than that of reference polymer PDPP4T (0.64 V), while the latter shows higher short-circuit currents. EQE and TEM measurements reveal that this is a consequence of too large donor domains, causing a larger fraction of excitons to decay before reaching the donor–acceptor interface.23 The coarse phase separation is in turn likely brought forth by the limited molecular weight of the polymers.28 The best performance was found for C8-OD(B) which uses a combination of n-octyl side chain on the DPP moiety, 2-octyldodecyl side chains on the DCBT and a small amount of a branching monomer, to provide a PCE = 5.7% (Jsc = 12.14 mA cm−2, Voc = 0.67 V, FF = 0.70). The branching increases the molecular weight and reduces the solubility, resulting in an increased EQE (41%) compared to the C8-OD(L) reference material without branching units, for which the EQE is only 27% in the near infrared region. A similar effect, but slightly lower EQE of 39%, was obtained for C8-OD(H) for which the molecular weight was increased by adjusting the monomer ratio. The results highlight the relation between polymer structure and molecular weight as determining factors for blend morphology and photovoltaic performance.Experimental section
Materials and methods
3,6-Di(thiophen-2-yl)-2,5-dihydropyrrolo[3,4-c]pyrrole-1,4-dione (2) and the alkyl functionalized derivatives (3 and 4) were synthesized according to literature procedures.47 The precursor to the DCBT monomers, dimethyl 5,5′-dibromo-[2,2′-bithiophene]-4,4′-dicarboxylate (1) was synthesized according to a previously reported procedure.32 Tris(dibenzylideneacetone)dipalladium (Pd2dba3) (Strem Chemicals Inc) and oxo[hexa(trifluoroacetato)]tetrazinc (ZnTAC24) (TCI) were used as received. Triphenylphosphine (PPh3) was recrystallized from absolute ethanol. All solid monomers were freshly recrystallized from absolute ethanol prior to use, liquid monomers were subjected to column chromatography and used within two days.1H and 13C NMR spectra were recorded at respectively 400 and 100 MHz on a Bruker Avance III spectrometer at 25 °C. Molecular weights of small molecules were determined using matrix assisted laser desorption ionization time of flight (MALDI-TOF) mass spectroscopy (Bruker Autoflex Speed spectrometer) or gas chromatography/mass spectroscopy (GC–MS) (Shimadzu GC-2010 chromatograph, equipped with a Zebron ZB-5MS column and a GCMS-QP2010 plus mass spectrometer). Molecular weights of polymers were determined by gel permeation chromatography (GPC) on a PL-GPC 220 using a PL-GEL 10 μm MIXED-B column. The system was operated at 140 °C with o-dichlorobenzene (oDCB) as the eluent. Samples, dissolved at 0.1 mg mL−1, were measured against polystyrene standards. UV/visible/NIR spectroscopy was conducted on a PerkinElmer Lambda 1050 spectrophotometer equipped with a 3D WB PMT/InGaAs/PbS detector module. Temperature control was realized with a PerkinElmer PTP1 Peltier temperature programmer. Square wave voltammetry was carried out using an AutoLab PGSTAT 30 in an inert atmosphere. The electrolyte consisted of 0.1 M tetrabutylammonium hexafluorophosphate in acetonitrile. The working electrode consisted of a thin polymer film on platinum, applied by dipping a platinum wire in a 2 mg mL−1 solution of polymer in chloroform. A silver rod was used as counter electrode and a silver chloride coated silver rod (Ag/AgCl) as quasi-reference electrode. The measurements were performed at a scan speed of 0.2 V s−1 and potentials are quoted vs. Fc/Fc+ as external standard. For conversion to energy levels vs. vacuum we used EFc/Fc+ = −4.8 eV.
Photovoltaic devices were fabricated with active areas of 0.09 and 0.16 cm2. Poly(ethylenedioxythiophene):poly(styrenesulfonate) (PEDOT:PSS) (Clevios P, VP Al4083) was spin coated at 3000 rpm on pre-cleaned, patterned indium tin oxide (ITO)/glass substrates (Naranjo Substrates). The active layer was spin coated from a chloroform/(co-solvent) solution (6 mg mL−1 polymer, 9 mg mL−1 [6,6]-phenyl-C71-butyric acid methyl ester (PC71BM)). The back electrode was evaporated at ∼10−7 mbar and consisted of LiF (1 nm) and Al (100 nm) layers. Current density–voltage (J–V) characteristics were recorded with a Keithley 2400 source meter using a tungsten-halogen lamp as light source. The light was filtered by a Schott GG385 UV filter and a Hoya LB120 daylight filter to provide 100 mW cm−2 AM1.5G light. Short-circuit currents and PCEs were calculated by integrating the solar spectrum and the spectral response of the cells. External quantum efficiencies (EQE) were determined using modulated monochromatic light from a 50 W tungsten-halogen lamp (Philips Focusline) passing through a monochromator (Oriel, Cornerstone 130) and a mechanical chopper. The response was recorded as the voltage produced by a preamplifier (Stanford Research Systems SR570) with a lock-in amplifier (SR830). All measurements were done against a Si-reference cell with known spectral response.
The two-dimensional (2D) GIWAXS experiments were carried out on a GANESHA 300XL+ system from JJ X-ray in the X-ray lab at DSM Materials Sciences Center (DMSC). The instrument is equipped with a Pilatus 300K detector, with pixel size of 172 μm × 172 μm. The X-ray source is a Genix 3D Microfocus Sealed Tube X-ray Cu-source with integrated Monochromator (multilayer optic “3D version” optimized for SAXS) (30 W). The wavelength used is λ = 1.5408 Å. The detector moves in a vacuum chamber with sample-to-detector distance varied between 0.115 m and 1.47 m depending on the configuration used, as calibrated using silver behenate (d001 = 58.380 Å). The minimized background scattering plus high-performance detector allows for a detectable q-range varying from 3 × 10⁻³ to 3 Å−1 (0.2 to 210 nm). The sample was placed vertically on the goniometer and tilted to a glancing angle of 0.2° with respect to the incoming beam. A small beam was used to obtain sharper features in the scattering pattern. The primary slit has a size of 0.3 mm × 0.5 mm, and the guard slit has a size of 0.1 mm × 0.3 mm. The accumulation time was 6 h for each measurement. Data plot and data reduction was conducted using GIXSGUI48 and SAXSGUI program.
Transmission electron microscopy (TEM) was performed on Tecnai G2 Sphera transmission electron microscope (FEI) operating at 200 kV. Layer thicknesses were determined using a Veeco Dektak 150 profilometer, subtracting the thickness of any underlying layers.
Synthesis of monomers
Polymerization reactions
Conflicts of interest
There are no conflicts to declare.Acknowledgements
The authors would like to thank Gaël Heintges for providing the monomer precursor (1) used in this study. The research received funding from the European Research Council under the European Union's Seventh Framework Programme (FP/2007–2013)/ERC Grant Agreement No. 339031 and from the Ministry of Education, Culture and Science (Gravity program 024.001.035).References
- H. J. Son, F. He, B. Carsten and L. Yu, J. Mater. Chem., 2011, 21, 18934–18945 RSC.
- S. Günes, H. Neugebauer and N. S. Sariciftci, Chem. Rev., 2007, 107, 1324–1338 CrossRef PubMed.
- F. C. Krebs, Sol. Energy Mater. Sol. Cells, 2009, 93, 394–412 CrossRef CAS.
- L. Dou, J. You, Z. Hong, Z. Xu, G. Li, R. A. Street and Y. Yang, Adv. Mater., 2013, 25, 6642–6671 CrossRef CAS PubMed.
- C. Duan, F. Huang and Y. Cao, Polym. Chem., 2015, 6, 8081–8098 RSC.
- K. Yoshikawa, H. Kawasaki, W. Yoshida, T. Irie, K. Konishi, K. Nakano, T. Uto, D. Adachi, M. Kanematsu, H. Uzu and K. Yamamoto, Nat. Energy, 2017, 2, 17032 CrossRef CAS.
- J. Zhao, Y. Li, G. Yang, K. Jiang, H. Lin, H. Ade, W. Ma and H. Yan, Nat. Energy, 2016, 1, 15027 CrossRef CAS.
- Z. Fei, F. D. Eisner, X. Jiao, M. Azzouzi, J. A. Röhr, Y. Han, M. Shahid, A. S. R. Chesman, C. D. Easton, C. R. McNeill, T. D. Anthopoulos, J. Nelson and M. Heeney, Adv. Mater., 2018, 30, 1705209 CrossRef PubMed.
- S. Zhang, Y. Qin, J. Zhu and J. Hou, Adv. Mater., 2018, 30, 1800868 CrossRef PubMed.
- Q. An, W. Gao, F. Zhang, J. Wang, M. Zhang, K. Wu, X. Ma, Z. Hu, C. Jiao and C. Yang, J. Mater. Chem. A, 2018, 6, 2468–2475 RSC.
- C. Gu, D. Liu, J. Wang, Q. Niu, C. Gu, B. Shahid, B. Yu, H. Cong and R. Yang, J. Mater. Chem. A, 2018, 6, 2371–2378 RSC.
- J.-L. Wang, K.-K. Liu, J. Yan, Z. Wu, F. Liu, F. Xiao, Z.-F. Chang, H.-B. Wu, Y. Cao and T. P. Russell, J. Am. Chem. Soc., 2016, 138, 7687–7697 CrossRef CAS PubMed.
- D. Ding, J. Wang, Z. Du, F. Li, W. Chen, F. Liu, H. Li, M. Sun and R. Yang, J. Mater. Chem. A, 2017, 5, 10430–10436 RSC.
- D. Veldman, S. C. J. Meskers and R. A. J. Janssen, Adv. Funct. Mater., 2009, 19, 1939–1948 CrossRef CAS.
- R. A. J. Janssen and J. Nelson, Adv. Mater., 2012, 25, 1847–1858 CrossRef PubMed.
- W. Li, K. H. Hendriks, A. Furlan, M. M. Wienk and R. A. J. Janssen, J. Am. Chem. Soc., 2015, 137, 2231–2234 CrossRef CAS PubMed.
- C. Wang, X. Xu, W. Zhang, J. Bergqvist, Y. Xia, X. Meng, K. Bini, W. Ma, A. Yartsev, K. Vandewal, M. R. Andersson, O. Inganäs, M. Fahlman and E. Wang, Adv. Energy Mater., 2016, 6, 1600148 CrossRef.
- U. Hörmann, J. Kraus, M. Gruber, C. Schuhmair, T. Linderl, S. Grob, S. Kapfinger, K. Klein, M. Stutzman, H. J. Krenner and W. Brütting, Phys. Rev. B, 2013, 88, 235307 CrossRef.
- M. C. Scharber, D. Mühlbacher, M. Koppe, P. Denk, C. Waldauf, A. J. Heeger and C. J. Brabec, Adv. Mater., 2006, 18, 789–794 CrossRef CAS.
- Y. Li, P. Sonar, L. Murphy and E. Hong, Energy Environ. Sci., 2013, 6, 1684–1710 RSC.
- C. B. Nielsen, M. Turbiez and I. McCulloch, Adv. Mater., 2013, 25, 1859–1880 CrossRef CAS PubMed.
- W. Li, K. H. Hendriks, M. N. Wienk and R. A. J. Janssen, Acc. Chem. Res., 2016, 49, 78–85 CrossRef CAS PubMed.
- Y. Liu, G. Li, Z. Zhang, L. Wu, J. Chen, X. Xu, X. Chen, W. Ma and Z. Bo, J. Mater. Chem. A, 2016, 4, 13265–13270 RSC.
- M. Li, D. Di Carlo Rasi, F. J. M. Colberts, J. Wang, G. H. L. Heintges, B. Lin, W. Li, W. Ma, M. M. Wienk and R. A. J. Janssen, Adv. Energy Mater., 2018, 8, 1800550 CrossRef.
- L. Dou, J. Gao, E. Richard, J. You, C.-C. Chen, K. C. Cha, Y. He, G. Li and Y. Yang, J. Am. Chem. Soc., 2012, 134, 10071–10079 CrossRef CAS PubMed.
- W. Li, A. Furlan, K. H. Hendriks, M. M. Wienk and R. A. J. Janssen, J. Am. Chem. Soc., 2013, 135, 5529–5532 CrossRef CAS PubMed.
- G. Zhang, J. Zhao, P. C. Y. Chow, K. Jiang, J. Zhang, Z. Zhu, J. Zhang, F. Huang and H. Yan, Chem. Rev., 2018, 118, 3447–3507 CrossRef CAS PubMed.
- X. Jiang, Y. Xu, X. Wang, Y. Wu, G. Feng, C. Li, W. Ma and W. Li, Phys. Chem. Chem. Phys., 2017, 19, 8069–8075 RSC.
- W. Li, K. H. Hendriks, A. Furlan, W. S. C. Roelofs, M. M. Wienk and R. A. J. Janssen, J. Am. Chem. Soc., 2013, 135, 18942–18948 CrossRef CAS PubMed.
- J. Yao, C. Yu, Z. Liu, H. Luo, Y. Yang, G. Zhang and D. J. Zhang, J. Am. Chem. Soc., 2015, 138, 173–185 CrossRef PubMed.
- F. Liu, Y. Gu, C. Wang, W. Zhao, D. Chen, A. Briseno and T. P. Russell, Adv. Mater., 2012, 24, 3947–3951 CrossRef CAS PubMed.
- M. Zhang, X. Guo, W. Ma, H. Ade and J. Hou, Adv. Mater., 2014, 26, 5880–5885 CrossRef CAS PubMed.
- Z. Zheng, S. Zhang, M. Zhang, K. Zhao, L. Ye, Y. Chen, B. Yang and J. Hou, Adv. Mater., 2014, 27, 1189–1194 CrossRef PubMed.
- J. J. van Franeker, G. H. L. Heintges, C. Schaefer, G. Portale, W. Li, M. M. Wienk, P. van der Schoot and R. A. J. Janssen, J. Am. Chem. Soc., 2015, 137, 11783–11794 CrossRef CAS PubMed.
- G. H. L. Heintges, J. J. van Franeker, M. M. Wienk and R. A. J. Janssen, Chem. Commun., 2016, 52, 92–95 RSC.
- T. Iwasaki, Y. Maegawa, Y. Hayashi, T. Ohshima and K. Mashima, J. Org. Chem., 2008, 73, 5147–5150 CrossRef CAS PubMed.
- Y. Maegawa, T. Ohshima, Y. Hayashi, K. Agura, T. Iwasaki and K. Mashima, ACS Catal., 2011, 1, 1178–1182 CrossRef CAS.
- R. Heuvel, F. J. M. Colberts, M. M. Wienk and R. A. J. Janssen, J. Mater. Chem. C, 2018, 6, 3731–3742 RSC.
- K. Müllen, J. R. Reynolds and T. Masuda, Conjugated Polymers: A Practical Guide to Synthesis, Royal Society of Chemistry, Cambridge, 2013 Search PubMed.
- A. Yokoyama, H. Suzuki, Y. Kubota, K. Ohuchi, H. Higashimura and T. Yokozawa, J. Am. Chem. Soc., 2007, 129, 7236–7237 CrossRef CAS PubMed.
- S. Kang, R. J. Ono and C. W. Bielawski, J. Am. Chem. Soc., 2013, 135, 4984–4987 CrossRef CAS PubMed.
- R. Tkachov, V. Senkovskyy, T. Beryozkina, K. Boyko, V. Bakulev, A. Lederer, K. Sahre, B. Voit and A. Kiriy, Angew. Chem., Int. Ed., 2014, 53, 2402–2407 CrossRef CAS PubMed.
- W. H. Carothers, Trans. Faraday Soc., 1936, 32, 39–49 RSC.
- J. K. Stille, J. Chem. Educ., 1981, 58, 862–866 CrossRef CAS.
- Y. Tamai, H. Ohkita, H. Benten and S. Ito, J. Phys. Chem. Lett., 2015, 6, 3417–3428 CrossRef CAS PubMed.
- O. V. Mikhnenko, P. W. M. Blom and T.-Q. Nguyen, Energy Environ. Sci., 2015, 8, 1867–1888 RSC.
- L. Bürgi, M. Turbiez, R. Pfeiffer, F. Bienewald, J.-J. Kirner and C. Winnewisser, Adv. Mater., 2008, 20, 2217–2224 CrossRef.
- Z. Jiang, J. Appl. Crystallogr., 2015, 48, 917–926 CrossRef CAS.
Footnote |
| † Electronic supplementary information (ESI) available. See DOI: 10.1039/c8ta05238g |
| This journal is © The Royal Society of Chemistry 2018 |


![[thin space (1/6-em)]](https://www.rsc.org/images/entities/char_2009.gif) :
:
