A new energy conversion and storage device of cobalt oxide nanosheets†
Saran
Kalasina
,
Nutthaphon
Phattharasupakun
and
Montree
Sawangphruk
 *
*
Department of Chemical and Biomolecular Engineering, School of Energy Science and Engineering, Vidyasirimedhi Institute of Science and Technology, Rayong 21210, Thailand. E-mail: montree.s@vistec.ac.th; Fax: +66 33-01-4445; Tel: +66 33-01-4251
First published on 27th November 2017
Abstract
A new design of a single hybrid energy conversion and storage cell of cobalt oxide (Co3O4) nanosheets, which can absorb the whole visible spectrum, exhibits the highest volumetric capacitance of 80.8 F cm−3 under light illumination (white LED), which is 2.2-fold higher than that under dark conditions at 1.5 A cm−3.
Energy storage devices i.e. supercapacitors and batteries are widely used in many applications including smartphones, tablets, hybrid transport, automobiles and grid energy balancing systems. The batteries provide high specific energy (10–200 W h kg−1) and the supercapacitors offer high specific power (∼500–10
![[thin space (1/6-em)]](https://www.rsc.org/images/entities/char_2009.gif) 000 W kg−1) and long cycle life (>100
000 W kg−1) and long cycle life (>100![[thin space (1/6-em)]](https://www.rsc.org/images/entities/char_2009.gif) 000 cycles).1,2 On the other hand, energy conversion devices such as thermoelectric and photovoltaic cells are also of interest since they can convert heat and photons (free energy) into electrical energy. However, a single hybrid energy conversion and storage (HECS) cell has not yet been investigated until we have found that a semiconducting α-Co(OH)2 material with an energy band gap of 2.85 eV can absorb blue light and generate photoelectrons via the photoelectric effect.3 The semiconductor material plays an important role by absorbing external light and generating electron–hole pairs. This process is well known in semiconductor/liquid junction photovoltaic cells and dye-sensitized solar cells.4,5
000 cycles).1,2 On the other hand, energy conversion devices such as thermoelectric and photovoltaic cells are also of interest since they can convert heat and photons (free energy) into electrical energy. However, a single hybrid energy conversion and storage (HECS) cell has not yet been investigated until we have found that a semiconducting α-Co(OH)2 material with an energy band gap of 2.85 eV can absorb blue light and generate photoelectrons via the photoelectric effect.3 The semiconductor material plays an important role by absorbing external light and generating electron–hole pairs. This process is well known in semiconductor/liquid junction photovoltaic cells and dye-sensitized solar cells.4,5
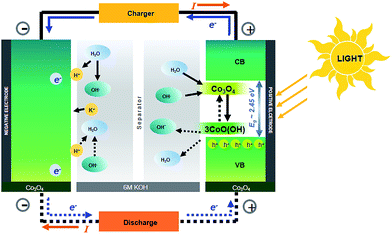
In this work, we further prove this concept using a high-profile pseudocapacitor material namely Co3O4, which is more stable even in 6 M KOH. This material with a black colour can absorb the whole range of visible light. Note that α-Co(OH)2 is not so stable in KOH since it transforms into β-Co(OH)2 and Co3O4, respectively, after being charged/discharged over 500 cycles.3 The α-Co(OH)2 can mainly absorb only blue light limiting its photoactive application.3 Alternatively, Co3O4 has a high theoretical capacitance of 3560 F g−1 and good electrochemical properties and is very stable in basic solution e.g., 1–6 M KOH.6–8 It is a good and well-known pseudocapacitive material having a cubic spinel structure including the tetrahedral Co2+ (d7) and the octahedral Co3+ (d6) in Co 3d states. The band gap energy of Co3O4 depends on its shape, size and dimension.9–13 As Co3O4 can absorb the whole visible spectrum, in this work, we therefore used it as the photoactive electrode material for the HECS cell (see Fig. 1). Note that the schematic of the HECS cell in Fig. 1 is an analogy to those of NiMH and NiCd batteries. The charge storage mechanism of the photoactive Co3O4 was also investigated by in situ electrochemical X-ray absorption spectroscopy (XAS).
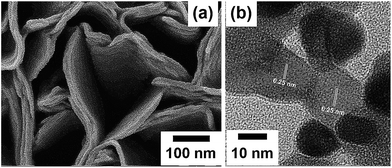
The as-electrodeposited Co(OH)2 film on an FTO glass substrate produced by following our previous report3 was utilized as a precursor for obtaining the Co3O4 film. The morphology of the Co3O4 film after the post-heat treatment process at 200 °C was firstly studied by field emission scanning electron microscopy (FESEM) and high-resolution transmission electron microscopy (HRTEM). An FESEM image shows a stacked-nanosheet structure for which the thickness of the nanosheet is ca. 10 nm as shown in Fig. 2a. After the heat treatment, the surface of the Co3O4 nanosheets becomes relatively rougher than that of the as-electrodeposited Co(OH)2 nanosheets. The stacking of the Co3O4 nanosheets can be clearly observed by FESEM (see Fig. S1†). This is owing to a dehydration reaction during the heat treatment significantly affecting the deformation of tetrahedral (Co2+) to octahedral (Co3+) forming a cubic spinel structure of Co3O4. Fig. 2b displays a HRTEM image of Co3O4 clearly indicating the atomic crystallographic plane of Co3O4 with a d-spacing of ca. 0.25 nm.
Powder X-ray diffraction (PXRD) was used to identify the crystalline phase of the Co3O4 nanosheets as shown in Fig. 3a. The PXRD of the Co3O4 nanosheets presents seven peaks at 19.0°, 31.8°, 36.8°, 38.8°, 45.1°, 59.3° and 65.3°, corresponding to the (111), (220), (311), (222), (400), (511) and (440) planes of Co3O4, respectively. Selected area electron diffraction (SAED) also shows the diffraction rings of those crystalline planes observed by XRD (see Fig. 3b). X-ray photoelectron spectroscopy (XPS) was also carried out to investigate the elemental composition and the electronic state of the material at the surface (see the wide scan spectrum in Fig. S2†). To gain a better understanding of the XPS result, the Co 2p spectrum was deconvoluted, and the fitted XPS spectra of the Co3O4 nanosheets are shown in Fig. 3c. The figure presents two main peaks at 780.0 and 795.8 eV for Co 2p3/2 and Co 2p1/2, respectively. After being fitted, two peaks at 781.4 and 797.2 eV can be assigned to the configuration of Co2+ 2p3/2 and Co2+ 2p1/2, respectively, whilst two peaks at 779.3 and 795.1 eV can be assigned to the configuration of Co3+ 2p3/2 and Co3+ 2p1/2, respectively. Finally, there are two peaks at 786.0 and 802.3 eV because of the multiple electron excitation (shake up) of Co2+ in Co3O4. The binding energy difference between Co 2p3/2 and Co 2p1/2 is about 15.8 eV. This suggests that the Co3O4 film consists of both Co2+ and Co3+. The average oxidation number of Co calculated from each peak area is ca. 2.5. In addition, the elemental analysis of the Co3O4 nanosheets investigated by EDX shows a good agreement with the wide scan XPS spectrum of this material (see Fig. S3†). The Brunauer–Emmett–Teller (BET) specific surface area of the Co3O4 nanosheets is about 106.8 m2 g−1, as investigated by N2 adsorption–desorption measurements and shown in Fig. 3d.
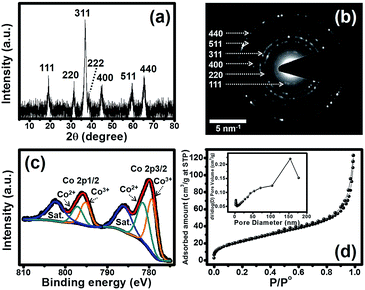 | ||
| Fig. 3 (a) XRD pattern, (b) SAED pattern, (c) Co 2p XPS spectrum, and (d) N2 adsorption–desorption isotherm with a pore size distribution (inset) of the Co3O4 nanosheets. | ||
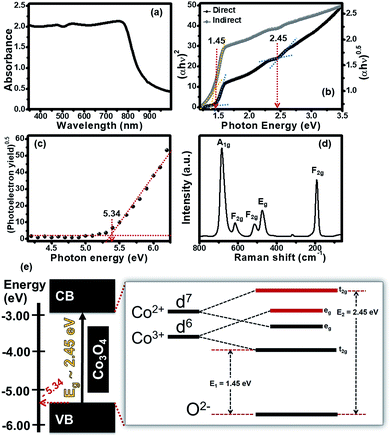
The UV-visible diffuse reflectance spectrum of the Co3O4 nanosheets is shown in Fig. 4a. The absorption spectrum of the Co3O4 nanosheets exhibits a wide absorption feature in the whole visible spectrum (ca. 300–800 nm). The Co3O4 nanosheets even absorb near infrared indicating that they are ideal to be used as the photoactive materials for HECS cells. The absorption spectrum was also used to find the optical band gap energy based on the Tauc formula.14 The relationship between (αhν)n and photon energy was plotted with n = 1/2 for an indirect band gap and n = 2 for a direct band gap as shown in Fig. 4b. Both direct and indirect band gaps can be found on the X-intercept of straight lines as shown in Fig. 4b. The indirect and direct band gaps are 1.45 eV and 2.45 eV, respectively, which are in good agreement with other previous reports.9–12,15 The existence of both energy gaps is a result of a combination of energy edges of the 3d orbital of tetrahedral (Co2+) and octahedral (Co3+) and an energy edge of the 2p orbital of tetrahedral (O2−).10,11,16 For better understanding the energy level of the Co3O4 nanosheets, an ultraviolet photoelectron spectroscopy (UPS) was also used to measure the ionization energy or work function of the Co3O4 nanosheet film and to estimate the minimum amount of photon energy for electron excitation corresponding to the valence band (VB) edge. The VB edge can be obtained from the relationship between the square root of photoelectron emission yield and photon energy as shown in Fig. 4c. The VB of the Co3O4 nanosheet film is about −5.34 eV with respect to a vacuum state (0 eV) as shown in black-colour circles in Fig. 4c. In addition, the Co–O coordination of tetrahedral (Co2+) and octahedral (Co3+) which was also studied by Raman spectroscopy with an excitation wavelength of 785 nm (1.58 eV) is shown in Fig. 4d. There are five peaks at 192, 473, 514, 616 and 682 cm−1. These peaks correspond to three types of Raman active modes: F2g, Eg and A1g as labelled in Fig. 4d. A peak at around 682 cm−1 is assigned to the A1g symmetry mode of Co–O in octahedral sites while a peak at 192 cm−1 is assigned to the F2g symmetry mode of Co–O in tetrahedral sites. This suggests that the Co3O4 nanosheets consist of tetrahedral (Co2+) and octahedral (Co3+) of a cubic spinel structure. Three peaks at 473, 514 and 616 cm−1 correspond to the Eg, F2g and F2g symmetry species of Co–O, respectively. This implies that the excitation energy at 785 nm (1.58 eV) is sufficient to excite electrons from the ground state to the excited state. Note that this energy can also generate Raman scattering.
For better understanding the energy level splitting of the Co3O4 nanosheets, their schematic energy diagram is shown in Fig. 4e. The indirect band gap (E1) is about 1.45 eV, corresponding to the transition state of 2p (O2−) → t2g 3d (Co3+) while the direct band gap (E2) is about 2.45 eV, corresponding to the transition state of 2p (O2−) → t2g 3d (Co2+). Co3O4 has a spinel structure consisting of Co2+ and Co3+. The electron configurations of Co2+ and Co3+ are d7 and d6, respectively.9,11,12 The difference in the electron configurations of Co2+ and Co3+ leads to an overlapping energy level in the 3d orbital for which the t2g state of Co3+ is the lowest energy level while the t2g state of Co2+ is the highest energy level. There are two eg states between these t2g states serving as the sub energy levels of E2 (2.45 eV). The energy difference between the t2g states is about 1 eV. The schematic energy diagram suggests that the photon energy of ∼1.45 eV is sufficient to excite electrons from the valence band (2p, O2−) to the conduction band (t2g 3d, Co2+) of the Co3O4 nanosheets via two eg states to the conduction band.
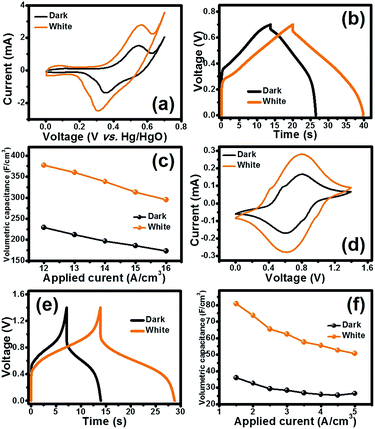
The photo-electrochemical properties of the half-cell Co3O4 electrode were investigated by cyclic voltammetry (CV) and galvanostatic charge–discharge (GCD). The half-cell electrode of the Co3O4 film was firstly investigated by CV in 6 M KOH electrolyte with a potential range of 0–0.7 V vs. Hg/HgO at the scan rates of 10, 25, 50, 75 and 100 mV s−1 under dark conditions and white LED light illumination as shown in Fig. 5a. In addition, the CV and GCD were also tested under three LED light illuminations including blue, green, and red (see the CV and GCD results in Fig. S8†). The CV curves under dark conditions and white LED light illumination exhibit the symmetric redox peaks indicating the reversible redox reaction of the Co3O4 film in 6 M KOH. This indicates that Co3O4 can electrochemically react with OH− forming CoO(OH) and an electron. Interestingly, the larger current density of the electrode under light illumination can be clearly observed when compared to that under dark conditions. Note that among the three LED light illuminations, the red LED light exhibits the highest current density when compared to green and blue LEDs (see Fig. S8†). This is in good agreement with the optical properties and Raman results.
The increment of the response current under light illumination is due to the photo-charging mechanism of the Co3O4 nanosheets as proposed by the following reactions (1) and (2). The Co3O4 nanosheets can initially be excited with LED lights generating the Co3O4+ hole and electron (e−) pairs namely “exciton” as shown in the following reaction (1). Then, OH− and H2O can react with Co3O4+ hole providing the CoO(OH) product as shown in the following reaction (2). The CoO(OH) is reduced back to Co3O4 at the discharge process as shown in the overall reversible redox reaction (3). Note that the charge storage mechanism was further investigated in this work by in situ electrochemical XAS.
 | (1) |
| CoO3O4+ + OH− + H2O ↔ 3CoO(OH) | (2) |
 | (3) |
GCD was further investigated by applying various currents (12–16 A cm−3) in a potential window of 0–0.7 V. GCD curves obtained at 12 A cm−3 are shown in Fig. 5b. The GCD curves under illumination display longer charge/discharge time than that under dark conditions. The longest discharge time was obtained under white LED illumination, followed by the red, green and blue LED illuminations, respectively (see Fig. S8†). This indicates that Co3O4 can store charges under light illumination (see the schematic in Fig. 1).
The calculated volumetric capacitances from the GCD vs. the applied currents are shown in Fig. 5c. At 12 A cm−3, the half-cell electrode of the Co3O4 film under white LED light illumination exhibits the highest volumetric capacitance of 376 F cm−3 which is 1.6-fold higher than that under dark conditions (229 F cm−3). The volumetric capacitances at the applied currents of 13, 14, 15 and 16 A cm−3 under dark conditions are 197, 186 and 173 F cm−3, respectively. At the same applied currents, the volumetric capacitances are 360, 338, 313 and 295 F cm−3, respectively, under white LED light illumination.
The photo-electrochemical performance of the symmetric HECS cell was also investigated by CV and GCD. The symmetric cell of Co3O4//Co3O4 was fabricated using a hydrolysed polyethylene paper (PE-OH) and 6 M KOH as the separator and the electrolyte, respectively. Theoretically, the cell will have 2-fold working voltage compared to the half cell. The cell was firstly evaluated by CV at a cell voltage window from 0 to 1.4 V, which is 2-fold higher than 0.7 V vs. Hg/HgO of the half-cell electrode at 10, 25, 50, 75 and 100 mV s−1. The CV curves of the cell are shown in Fig. 5d in which the redox peaks clearly observed resulted from the redox reactions of Co3O4, following the proposed reactions (1)–(3). Note that the small peaks at ∼0.5 V and ∼0.9 V are due to the conversion of CoO in the chemical structure of Co3O4 to CoO(OH) as shown in the following reaction (4).17
| CoO + OH− ↔ CoO(OH) + e− | (4) |
When the HECS cell is operated under white LED light illumination, it exhibits higher current and pseudocapacitance than the cell operated under dark conditions. The GCD was also investigated by applying various current densities (1.5–5.0 A cm−3) at a cell voltage window of 1.4 V. The GCD curves obtained at 1.5 A cm−3 are shown in Fig. 5e. The GCD curves under white light illumination exhibit longer charge–discharge time than those under dark conditions supporting the CV results. The calculated volumetric capacitances as a function of applied current densities are shown in Fig. 5f. At 1.5 A cm−3, the Co3O4 HECS cell under white LED light illumination exhibits higher volumetric capacitance (80.8 F cm−3), which is 2.2-fold higher than that under dark conditions (35.9 F cm−3). The volumetric capacitances of the HECS cell under light illumination are 73.8, 65.5, 62.5, 57.5, 55.6, 52.7 and 50.8 F cm−3 at 2.0, 2.5, 3.0, 3.5, 4.0, and 5.0 A cm−3, respectively.
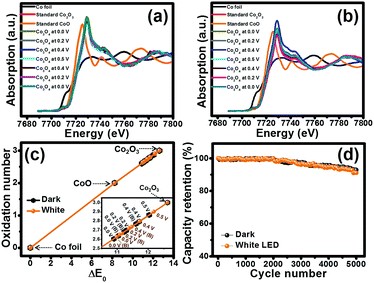
To investigate the oxidation state and the charge storage behaviour of the Co3O4 nanosheets during charging/discharging, the Co3O4 film was studied by in situ XAS together with chronoamperometry in 6 M KOH by applying the potentials stepped from 0.0, 0.2, 0.4 and 0.5 V vs. Hg/HgO, followed by the backward scan at the applied potentials from 0.4, 0.2 and 0.0 V vs. Hg/HgO under dark conditions and white LED light illumination. Note that the Co K-edge XANES spectra of the samples were recorded and compared with Co foil, CoO and Co2O3 standards. Fig. 6a displays the Co K-edge XANES spectra of the Co3O4 electrode and Co standard compounds in fluorescence modes at 0.0, 0.2, 0.4, 0.5, 0.4, 0.2 and 0.0 V. Firstly, the fluorescence energy of the Co3O4 electrode in 6 M KOH is 7719.63 eV (Co2.60+) and the adsorption energy slightly increases to 7719.65 eV (Co2.61+) when being charged at 0.0 V vs. Hg/HgO. The adsorption energy continuously increases when being charged at 0.2, 0.4 and 0.5 V vs. Hg/HgO, and the energy values are 7720.05 (Co2.70+), 7720.47 (Co2.79+) and 7720.79 (Co2.87+), respectively (see Fig. 6c and Table S1†). When being charged at 0.0 V vs. Hg/HgO under white light illumination as shown in Fig. 6b, the adsorption energy increases to 7719.84 eV (Co2.65+). The adsorption energy continuously increases when being charged at 0.2, 0.4 and 0.5 V vs. Hg/HgO, and the energy values are 7720.14 (Co2.72+), 7720.48 (Co2.79+) and 7720.94 (Co2.90+), respectively, which are slightly higher than those under dark conditions (see Fig. 6c). This is due to the oxidation reaction of Co3O4+ with OH− under light illumination providing CoO(OH). Upon the backward or discharge process, the oxidation state of Co is reduced back to the original number indicating a “reversible process”. These results confirm the redox reactions of Co3O4 to CoO(OH) by following the reactions (1)–(4).
Finally, the cycling performance of the Co3O4 HECS cells was investigated under dark conditions and white LED light illumination at an applied current of 1.5 A cm−3 for 5000 cycles as shown in Fig. 6d. The cells exhibit good capacity retention over 90% under both dark conditions and white LED light illumination.
In summary, although Co3O4 is widely used as the pseudocapacitor electrode, its photoactive properties have not yet been fully investigated. The Co3O4 nanosheets having an indirect band gap of 1.45 eV and a direct band gap of 2.45 eV produced by an electrodeposition and post-heat treatment can absorb the whole visible spectrum, which are ideal to be used as the photoactive electrode materials. The single hybrid energy conversion and storage (HECS) cell of fabricated Co3O4 exhibits the highest volumetric capacitance of 80.8 F cm−3 under white LED light illumination, which is 2.2-fold higher than that under dark conditions (35.9 F cm−3) at 1.5 A cm−3. In situ electrochemical XAS shows a reversible reaction process of Co3O4 during charging/discharging. The HECS of the Co3O4 nanosheets may be a solution for renewable energies.
Contributions
M. S. conceived and designed this work and wrote the paper; S. K. carried out the experiment; N. P. performed SEM. All the authors participated in the analysis and discussion of the results.Conflicts of interest
There is no conflict of interest.Acknowledgements
This work was financially supported by the Thailand Research Fund (RSA5880043) and the Vidyasirimedhi Institute of Science and Technology. S. K. appreciates the Postdoctoral Fellowship from the Vidyasirimedhi Institute of Science and Technology (VISTEC). Instrumental support from the Frontier Research Centre at VISTEC is also acknowledged. Synchrotron Light Research Institute (BL5.2) (Public Organization), Thailand, for XANES is appreciated.Notes and references
- M. Winter and R. J. Brodd, Chem. Rev., 2004, 104, 4245–4270 CrossRef CAS PubMed.
- P. Simon and Y. Gogotsi, Nat. Mater., 2008, 7, 845–854 CrossRef CAS PubMed.
- S. Kalasina, P. Pattanasattayavong, M. Suksomboon, N. Phattharasupakun, J. Wutthiprom and M. Sawangphruk, Chem. Commun., 2017, 53, 709–712 RSC.
- S. G. Yan, L. A. Lyon, B. I. Lemon, J. S. Preiskorn and J. T. Hupp, J. Chem. Educ., 1997, 74, 657 CrossRef CAS.
- X. Dang and J. T. Hupp, J. Am. Chem. Soc., 1999, 121, 8399–8400 CrossRef CAS.
- C. Yuan, L. Yang, L. Hou, L. Shen, X. Zhang and X. W. Lou, Energy Environ. Sci., 2012, 5, 7883–7887 CAS.
- Y. Liang, Y. Li, H. Wang, J. Zhou, J. Wang, T. Regier and H. Dai, Nat. Mater., 2011, 10, 780–786 CrossRef CAS PubMed.
- Q. Liao, N. Li, S. Jin, G. Yang and C. Wang, ACS Nano, 2015, 9, 5310–5317 CrossRef CAS PubMed.
- F. Gu, C. Li, Y. Hu and L. Zhang, J. Cryst. Growth, 2007, 304, 369–373 CrossRef CAS.
- S. Thota, A. Kumar and J. Kumar, Mater. Sci. Eng., B, 2009, 164, 30–37 CrossRef CAS.
- P. H. T. Ngamou and N. Bahlawane, Chem. Mater., 2010, 22, 4158–4165 CrossRef CAS.
- V. R. Shinde, S. B. Mahadik, T. P. Gujar and C. D. Lokhande, Appl. Surf. Sci., 2006, 252, 7487–7492 CrossRef CAS.
- S. K. Meher and G. R. Rao, J. Phys. Chem. C, 2011, 115, 15646–15654 CAS.
- J. Tauc, R. Grigorovici and A. Vancu, Phys. Status Solidi B, 1966, 15, 627–637 CrossRef CAS.
- S. K. Jesudoss, J. Judith Vijaya, P. Iyyappa Rajan, K. Kaviyarasu, M. Sivachidambaram, L. John Kennedy, H. A. Al-Lohedan, R. Jothiramalingam and M. A. Munusamy, Photochem. Photobiol. Sci., 2017, 16, 766–778 CAS.
- S. A. Makhlouf, Z. H. Bakr, K. I. Aly and M. S. Moustafa, Superlattices Microstruct., 2013, 64, 107–117 CrossRef CAS.
- K. K. Lee, W. S. Chin and C. H. Sow, J. Mater. Chem. A, 2014, 2, 17212–17248 CAS.
Footnote |
| † Electronic supplementary information (ESI) available: XPS, SEM-EDX and experimental details. See DOI: 10.1039/c7ta08736e |
| This journal is © The Royal Society of Chemistry 2018 |

