 Open Access Article
Creative Commons Attribution 3.0 Unported Licence
Interpreting the interfacial and colloidal stability of bulk nanobubbles
N.
Nirmalkar
,
A. W.
Pacek
and
M.
Barigou
 *
*
School of Chemical Engineering, University of Birmingham, Edgbaston, Birmingham B15 2TT, UK. E-mail: m.barigou@bham.ac.uk
First published on 12th November 2018
Abstract
This paper elucidates parts of the mystery behind the interfacial and colloidal stability of the novel bubble system of bulk nanobubbles. Stable bulk nanobubble suspensions have been generated in pure water using hydrodynamic cavitation in a high-pressure microfluidic device. The effects of pH adjustment, addition of different types of surfactant molecules and salts on the nanobubble suspensions have been studied. Results show that nanobubble interfaces in pure water are negatively charged, suggesting the formation of an electric double layer around the nanobubbles. It is presumed that the external electrostatic pressure created by the charged nanobubble interface, balances the internal Laplace pressure; therefore, no net diffusion of gas occurs at equilibrium and the nanobubbles are stable. Such stability increases with increasing alkalinity of the suspending medium. The addition of mono- and multi-valent salts leads to the screening of the electric double layer, hence, destabilizing the nanobubbles. Different surfactant molecules (non-ionic, anionic, cationic) affect the stability of bulk nanobubbles in different ways. Calculations based on the DLVO theory predict a stable colloidal system for bulk nanobubbles in pure water and this could be a further reason for their observed longevity. All in all, in pure water, the long-term stability of bulk nanobubbles seems to be caused by a combination of ion-stabilisation of their interface against dissolution and colloidal stability of the suspension.
1. Introduction
Bulk nanobubbles are a novel type of nanoscale bubble system. They have a typical mean spherical diameter of 100–200 nanometres and they exist in bulk liquid.1 The most peculiar characteristic of these bulk nanobubbles is their extraordinary longevity. Whilst the lifetime of macrobubbles (>1 mm) is on the order of minutes and that of microbubbles (1–1000 microns) is on the order of seconds, nanobubbles have been reported to last for weeks and months.1,2 The Young–Laplace equation, however, predicts a huge inner gas pressure (e.g., around 30 atm inside a typical 100 nm nanobubble in pure water) and, consequently, bubble dynamics theory of Epstein–Plesset3 predicts that they would dissolve extremely quickly on a timescale of about 1–100 μs. The existence of bulk nanobubbles has been reported in recent years by a number of academic researchers,1,2 but due to their unusual behaviour there is still some scepticism around the subject and their existence is not widely accepted.Though bulk nanobubbles are a relatively new field, because of their unusual longevity they are already attracting a lot of industrial attention and many potential applications have been proposed. Thus, there is immense scope for nanobubbles to impact and even revolutionise many current industrial processes such as wastewater treatment,4 surface cleaning,5–7 froth flotation,8–12 nanobubbles as ultrasound contrast agent,13–19 therapeutic drug delivery,17,19,20 drag reduction,21 sterilisation of bacteria,22 enhanced germination rate of seeds,23 promotion of physiological activity of living organisms,24 improved blood oxygenation,25 and improved engine performance using hydrogen nanobubbles.26,27 To fully exploit these potential benefits, however, a thorough understanding of the formation, stability and dynamic behaviour of bulk nanobubbles is needed.
From a scientific point of view, the mystery behind the longevity of bulk nanobubbles has led to many different speculations as to the reasons for this phenomenon. Some workers have considered them as preserved heterogeneities similar to imperfections in a crystalline structure.28 Some investigators reported that bulk nanobubbles can be removed by degassing or repeated filtering and restored by subsequent gas sparging, thus, suggesting that the nucleation centres are preserved.29 Others have suggested that interfacial composition and structure are behind nanobubble stability, with some suggesting that the surface of nanobubbles contains hard hydrogen bonds which may reduce gas diffusivity.2 It has also been speculated that nanobubbles are stable because of ‘universal’ contamination, i.e. each nanobubble is protected by a shell of insoluble contaminant (organic or surfactant molecules) which reduces the interfacial tension, and hence the inner Laplace pressure, and provides stability against dissolution.30 Some authors have reported the existence of bulk nanobubbles in aqueous organic solvent mixtures.31,32 The idea of ‘universal’ contamination is not plausible, however, because: (i) if it were true, then nanobubbles would exist in normal tap water or even distilled water, but routine analysis tests show that they do not normally exist; however, with external energy input they can be generated even in ultrapure water; and (ii) thermal fluctuations are expected to erode the contaminant shell and lead to nanobubble dissolution over a timescale much shorter than the observed lifetime of bulk nanobubbles.
Bunkin et al.33–35 speculated the existence of an external electrostatic pressure due to the adsorption of ions at the interface which balances the Laplace pressure. On the other hand, Weijs et al.1 suggested, based on molecular dynamics simulations, the idea that diffusive shielding stabilises bulk nanobubble clusters, i.e. in a cluster bulk nanobubbles protect each other from diffusion by a shielding effect. More recently, a dynamic equilibrium model36 suggested that bulk nanobubbles could be partly covered by hydrophobic material and there is continuous inflow and outflow of gas to maintain the size of nanobubbles constant. Based on the assumptions that the total change in entropy and energy is zero at equilibrium state, they showed numerically that nanobubbles are stable when the surface coverage fraction lies within 0.5–1. However, this is an old model which was previously proposed for surface nanobubbles but which had been criticised as it seems to violate the second law of thermodynamics.37
Amongst other suggestions is that the nano-entities observed are not bubbles but could be supramolecular structures,38 solid nanoparticles or nanodroplets. This is a key question which needs to be resolved. Ohgaki et al.2 observed that the density of water reduces significantly when such nano-entities are present, thus, suggesting they must be bubbles. In addition, their observation of hollow hemispherical structures via scanning electron microscopy based on a free-fracture replica technique also indicated the existence of cavities. Bunkin et al.35 used a modulation interference microscope to examine gas-filled nanobubbles on the basis of their refractive index (n = 1.26) and reported stable nanobubbles of size 250–750 nm; in contrast, silica nanoparticles had a refractive index of n = 1.46. Tuziuti et al.39 found that the mean bubble diameter increases and the bubble number density decreases after compression of a nanobubble suspension generated by hydrodynamic cavitation, similar to the cavitation process generated in our microfluidic device. Similarly, Leroy and Norisuye40 utilized measurements of the acoustic velocity and attenuation of sound in water to distinguish between bulk nanobubbles and solid nanoparticles. In a nanobubble suspension the velocity of sound reaches a peak value at a certain sound frequency, but there is no such response to the applied ultrasound field in a solid nanoparticle suspension. This is due to the fact that a more compressible material like bubbles is always more sensitive to an acoustic field howsoever small the quantity of the material is.
However, reports are sparse, often conflicting and have not been independently validated. There is no universally accepted theory that explains the existence and stability of bulk nanobubbles. To fully exploit the potential benefits of bulk nanobubbles, our understanding of the fundamental rules governing their existence and their unusual behaviour needs to be substantially improved, and to this end a combination of experimental and theoretical studies is required. Apart from the theoretical challenges, there are a number of experimental challenges including developing efficient techniques for the generation of bulk nanobubble suspensions with meaningful gas fractions as well as their characterization, including the ability to easily distinguish between nanobubbles and solid nanoparticles.
In this paper, we study the generation of bulk nanobubbles in pure water using a high-pressure microfluidic device. We also study the effects of pH adjustment as well as the addition of different types of surfactants and salts on the nanobubble suspensions and their stability. Finally, using our experimental measurements, we provide a description of the colloidal stability of the nanobubble suspensions based on the DLVO theory.
2. Experimental section
2.1 Materials
Sodium chloride (NaCl, 99.5% Bioextra), sodium dodecyl sulphate (SDS, AR >99%), cetyl trimethylammonium bromide (CTAB, 99% Bioextra), Tween® 20, calcium iodide (CaI2, 99%), aluminium chloride (AlCl3, 99.9%) and buffer solutions (pH = 4, 7 and 10) were purchased from Sigma Aldrich. Sodium hydroxide (NaOH, 98%) and hydrochloric acid (37% HCl AR grade) were purchased from VMR Chemicals (UK). All stock solutions and nanobubble samples were prepared using purified water (from here on referred to as pure water) from an Aquatron water still A4000D. Pure water had an electrical conductivity of 1.7 μS cm−1 and a pH of 6.5. Stock solutions of SDS were prepared by dissolving SDS in pure water using a magnetic stirrer at 25 °C in order to achieve complete dissolution. Stock solutions of CTAB and Tween 20 were prepared by gentle stirring for 12 hours at room temperature using a magnetic stirrer. Similarly, stock solutions of NaOH, HCl, NaCl, CaI2, and AlCl3 were prepared by gentle stirring for 30 min. All stock solutions were filtered by a 0.45 μm Millipore filter (Merck Millipore limited, UK). Prior to experimentation, purified water and all stock solutions were initially examined for any nanoscale impurities using a NanoSight instrument (used for characterising the nanobubble size distributions, as described further below), and no significant amount of nanoscale entities were observed. Extra precaution was adopted in cleaning and handling of the experimental setup. The microfluidics cell used to generate the bulk nanobubbles was cleaned thoroughly several times using AR grade propanol, purified nitrogen and purified water. To avoid contamination, disposable glass vials and rubber and silicon-free syringes were used.412.2 Generation of bulk nanobubbles
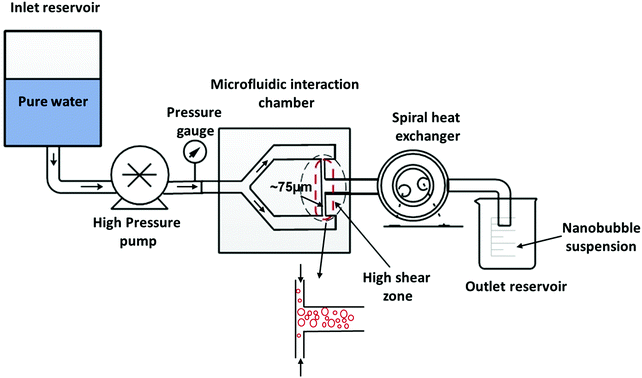
Bulk nanobubbles were generated using a high-pressure Y-type microfluidic cell (Microfluidics Corporation, M-110S, USA). A schematic diagram of the experimental setup is shown in Fig. 1. Non-degassed pure water is pumped using an air-powered intensifier pump from the inlet reservoir through the microfluidic interaction chamber where air-filled nanobubbles are generated. The nanobubble suspension then passes through a spiral-coil cooling heat exchanger to reduce its temperature before being collected at the outlet. The operating pressure and volumetric flowrate used were varied, respectively, within the ranges 300–1500 bar and 150–300 mL min−1. The width of the microchannel (see Fig. 1) was 75 μm, giving an operating mean velocity in the microchannel in the range 440–880 m s−1.Hydrodynamic cavitation occurs inside the microfluidic interaction chamber when water passes through the sudden expansion, which leads to the nucleation of bulk nanobubbles. According to Bernoulli's principle of mechanical energy conservation, an increase in the velocity of a liquid stream due to a reduction in the area of flow leads to a decrease in liquid static pressure. If the local pressure falls below the vapour pressure of the liquid, the liquid cavitates and tiny bubbles form. Two categories of bubbles are produced: microbubbles which form a visible cloud and are inherently unstable, and bulk nanobubbles which exhibit long-term stability. It is not clear a priori if the nanobubbles result from the microbubbles as they collapse or whether they form directly during the cavitation process, or both.
Cavitation is most likely to occur at the vena contracta where the liquid velocity is highest and the pressure is lowest. A first order measure of cavitation is determined from the dimensionless cavitation number defined as:42
 | (1) |
2.3 Characterisation of bulk nanobubble suspensions
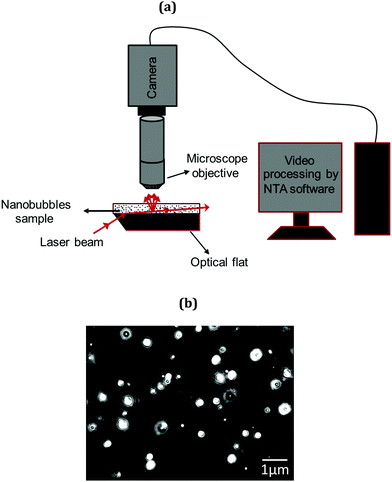 | ||
| Fig. 2 NTA characterisation system: (a) schematic diagram; (b) typical micrograph showing bulk nanobubbles. | ||
Brownian motion occurs in three dimensions but the NTA instrument observes motion only in two dimensions. The two-dimensional tracking of nanobubbles can be utilized to calculate the diffusion coefficient of the nanobubbles using the well-known Einstein–Stokes equation, as follows:44
 | (2) |
 is the mean square displacement of a nanoparticle in two-dimensions measured in time t. The parameters Dt, kB, T, μ and d are, respectively, diffusion coefficient, Boltzmann constant, temperature, viscosity and diameter of the particle. Due to the fact that the NTA technique can simultaneously analyse a population of nanoparticles on an individual basis, it is ideally suited for the real-time analysis of polydisperse systems ranging from 10 to 2000 nm in size and 107 to 109 particles mL−1 in particle number density.45 Prior to the analysis of the nanobubble samples, standard suspensions of solid latex nanospheres were used to verify the accuracy and precision of the NTA system and to adjust the instrument settings accordingly.
3. Results and discussion
3.1 Characterisation of bulk nanobubble suspensions
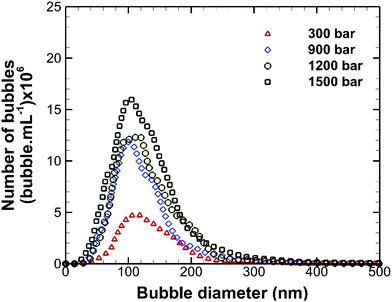
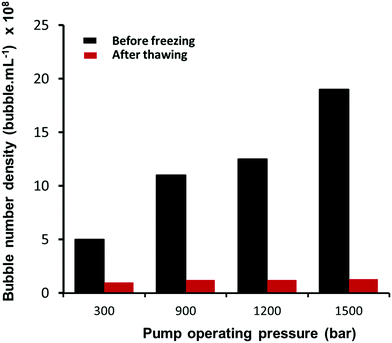
The effects of operating pump pressure, measured at the inlet to the interaction chamber (see Fig. 1), on the bubble size distribution are depicted in Fig. 3. The shape of the bubble size distribution is more or less unaffected and the mean bubble diameter remains constant at ∼130 nm, but the bubble number density increases considerably with the operating pressure, as shown in Fig. 4. A higher inlet fluid pressure leads to an increase in the fluid velocity head in the microchannel which reduces the cavitation number (see eqn (1)) and, hence, enhances cavitation resulting in more nanobubbles. The zeta potential of the nanobubbles was about −28 mV and was not affected by changes in the operating pressure.3.2 Existence of bulk nanobubbles
We recently reported multiple evidence that the long-term stable (up to a year) nano-entities in suspension generated in pure water via an acoustic cavitation technique were gas-filled bulk nanobubbles because: (i) they disappear after freezing and thawing of the suspension; (ii) when left undisturbed, they gradually disappear as indicated by the reduction in their count monitored over long periods of time; and (iii) their nucleation rate depends strongly on the amount of air dissolved in water.46 Here, given the high operating pressures involved, speculation might also arise as to whether such nanobubbles might actually be solid nanoparticles that could have detached from the solid surfaces of the microfluidic circuit or even nanodroplets that might have been caused by accidental contamination. Based on the NTA measurements, nanoparticles, nanodroplets and nanobubbles cannot be differentiated, however. We verify, therefore, that the nano-entities generated in the microfluidic device are bulk nanobubbles by conducting freeze–thaw experiments on the suspensions and by monitoring their long-term stability, as described in our recent paper.463.3 Effects of pH
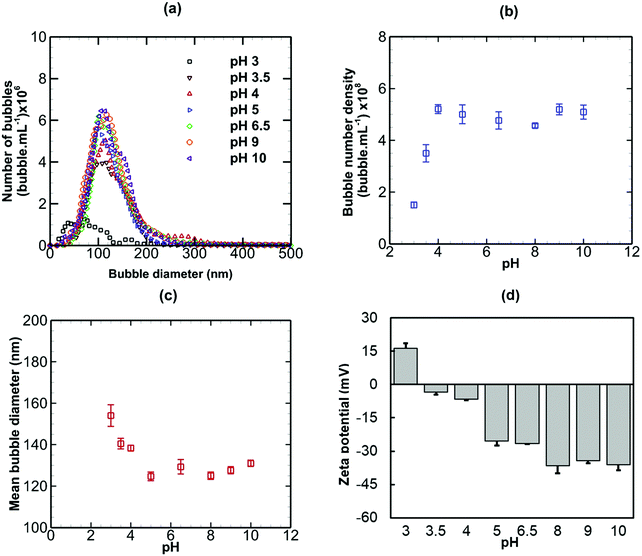
Nanobubble suspensions were initially generated in pure water having a pH of 6.5. The effects of modifying the pH of the suspension on the stability of bulk nanobubbles are presented in Fig. 5, in terms of bubble size distribution, bubble number density, mean diameter and zeta potential. Referring to Fig. 5(a), above pH 4, the bubble size distribution is more or less unaffected. Below pH 4, the peak (i.e. the mode) of the bubble size distribution reduces sharply. This is reflected in a steep fall in the bubble number density as the pH is reduced from 4 to 3, as shown in Fig. 5(b). The mean bubble diameter (Fig. 5(c)), however, increases significantly as the pH falls below 4.The negative zeta potential of the suspension, as shown in Fig. 5(d), reduces in magnitude with decreasing pH and becomes positive below the isoelectric point which occurs between pH 3 and pH 3.5. The overall trend can be explained by the concept of bubbstons which are microbubbles that carry a surface charge and form the basis of ion-stabilised model suggested by Bunkin et al.48 for microbubbles in aqueous solutions of electrolytes. By analogy, therefore, the nanobubble interfaces having a surface potential of about −28 mV in pure water of pH 6.5, are negatively charged (Fig. 5(d)). Thus, an electric double layer should form around the nanobubbles, akin to that observed around solid nanoparticles. According to the ion-stabilised model, the external electrostatic pressure arising from the charged nanobubble interface is assumed to counterbalance the internal Laplace pressure and, therefore, no net diffusion of gas occurs at equilibrium.
Adopting the ion-stabilised model for microbubbles,48 the electrostatic pressure (Pe) in the vicinity of a charged nanobubble can be written as follows, as derived in Appendix A:
 | (3) |
 | (4) |
 | (5) |
The surface charge density is related to the surface potential (ψ0) via the Grahame equation, thus:50
 | (6) |
3.4 Effects of addition of surfactant
For many industrial applications, the adequate adsorption of functional groups is desirable. The adsorption of surfactants and polymer molecules on the surface of nanoparticles has been extensively studied owing to its direct impact on the colloidal behaviour of such suspensions.50 The interaction arising from the adsorbed layer of surfactant molecules hinders coalescence. Here, we examine the effects of the addition of different types of surfactant (anionic, non-ionic and cationic) on nanobubble suspensions including the bubble size distribution, mean diameter, bubble number density and zeta potential.When a non-ionic surfactant (Tween 20) was added to a bulk nanobubble suspension at varying concentrations from 0 to 5 cmc (critical micelle concentration), as shown in Fig. 6, there were no significant effects on the bubble size distribution, bubble number density, mean bubble diameter or zeta potential. The results of adding sodium dodecyl sulphate (SDS, anionic surfactant) to a bulk nanobubble suspension are depicted in Fig. 7. Clearly, whilst there are no significant effects on the bubble size distribution, mean bubble size or bubble number density, the addition of a small amount of SDS (0.1 cmc, equivalent to 0.82 mM) leads to a large increase in the magnitude of the surface potential from −32 mV to −70.8. Further increases in SDS concentration gradually enhance the surface potential to −92 mV at 5 cmc. This enhancement in zeta potential is caused by the hydrophilic ionic head group SO4− of the SDS molecules orientating itself towards the liquid phase whilst the hydrophobic tail orientates itself towards the gas phase. It should be noted that a typical surfactant micelle (e.g. SDS, CTAB) in water has a size of ∼1.75 nm and is made up of about 100 surfactant molecules.51 Such micelles, when present, are too small to be detected by the NTA system and to affect nanobubble size and nanobubble count measurements. Thus, the measurements of nanobubble size distribution and number density are unaffected by the addition of surfactant at all concentrations (Fig. 7).
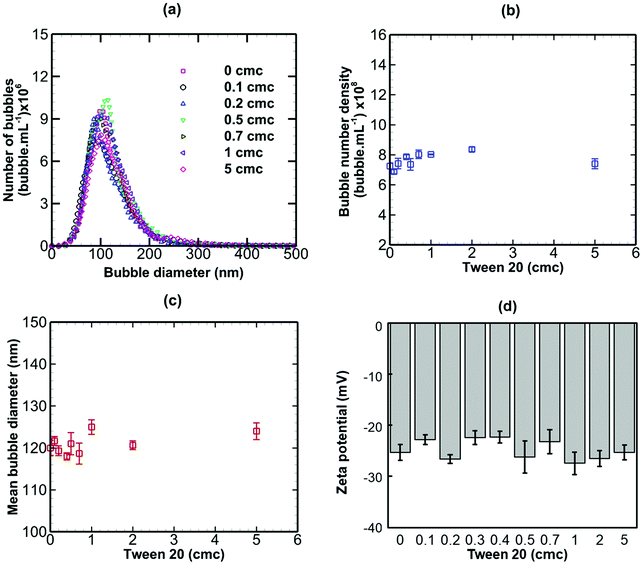 | ||
| Fig. 6 Effects of addition of Tween 20 (non-ionic surfactant; cmc = 0.06 mM) on bulk nanobubbles initially generated in pure water. | ||
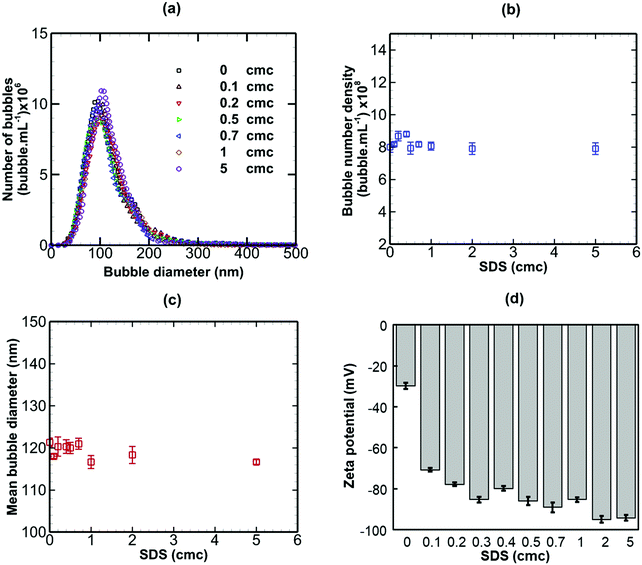 | ||
| Fig. 7 Effects of addition of SDS (anionic surfactant; cmc = 8.2 mM) on bulk nanobubbles initially generated in pure water. | ||
The addition of CTAB (cationic surfactant), however, brought about more complex changes in the nanobubble samples, as shown in Fig. 8. On addition of small amounts of CTAB up to 0.5 cmc, the bubble number density drops sharply (from 7.618 × 10⁸ to 3.437 × 10⁸ bubble mL−1) whilst the mean bubble diameter increases sharply (from 121 to 146 nm). Above 0.5 cmc, both trends are reversed with bubble number density rising and mean diameter falling steeply levelling off at about 1 cmc. The magnitude of the zeta potential of the nanobubble suspension increases steadily from approximately −32 mV to +32 mV as the CTAB concentration is increased from 0 to 5 cmc. The change in sign occurs at the isoelectric point close to 0.5 cmc CTAB, where the bubble number density is minimum and the mean bubble diameter is maximum. Initially, the nanobubbles in pure water are negatively charged. Upon gradual addition of CTAB, the hydrophilic ionic head group terminated with CTA+ adsorbs at the nanobubble interfaces and this, in turn, gradually neutralizes the negative charge of the nanobubbles, leading to a charge reversal at the isoelectric point.
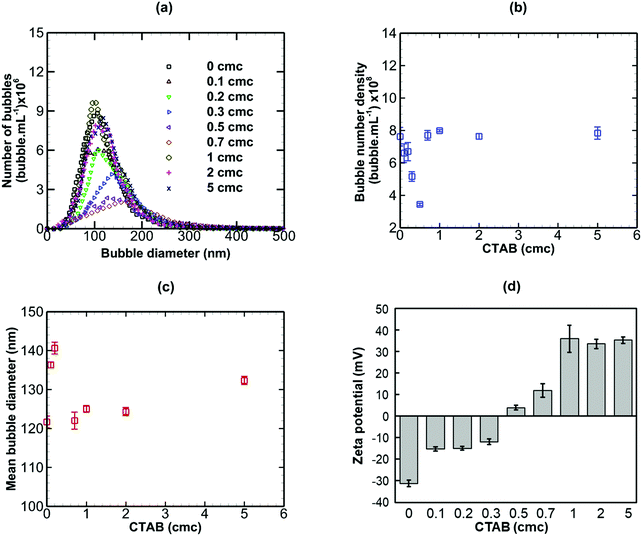 | ||
| Fig. 8 Effects of addition of CTAB (cationic surfactant; cmc = 0.92 mM) on bulk nanobubbles initially generated in pure water. | ||
In conclusion, an anionic surfactant increases the magnitude of the negative value of surface potential due to the adsorption of an anionic group. Thus, the stability of nanobubbles, improves with increased surfactant concentration, but there are no effects on the nanobubble number density or size distribution. The addition of a non-ionic surfactant produces no effects on the nanobubble size distribution, their number density or zeta potential. This is expected, however, to lead to steric stabilisation of the nanobubbles without affecting their surface charge. A cationic surfactant, on the other hand, gradually decreases the magnitude of the negative value of surface potential due to the adsorption of a cationic group, leading to a charge reversal at the interface of the nanobubbles as the concentration is increased. This initially would be expected to reduce the stability of the nanobubbles as the surface potential is gradually neutralised. However, the stability of nanobubbles is expected to improve again beyond the point at which the surface charge reversal occurs. As a result, complex effects on the nanobubble number density and size distribution ensue.
3.5 Effects of addition of mono- and multi-valent salts
As pointed out earlier, charged bulk nanobubbles in water should form an electric double layer owing to the presence of counter-ions (OH−) and co-ions (H+). From the theory of colloidal stability, the thickness of this double layer, the so-called Debye length (κ−1), is given by:50 | (7) |
The effects of adding three salts of different valence, namely NaCl (monovalent), CaI2 (divalent) and AlCl3 (trivalent) to a bulk nanobubble suspension were investigated. Values of κ−1 for nanobubble suspensions with these added salts were estimated using eqn (7) based on measured values of the surface potential. These values will be used in the calculation of electrostatic interaction potentials in the next section.
Results are presented for the three salts in Fig. 9–11, in terms of bubble size distribution, bubble number density, mean bubble diameter and zeta potential. In all cases, the addition of a small amount of any salt leads to a sharp drop in bubble number density which is accompanied by a steep rise in mean bubble diameter. The magnitude of the negative zeta potential decreases considerably but stays negative in the case of NaCl, whereas it drops to zero in the case of CaI2, and changes to positive at the highest concentration in the case of AlCl3. Thus, divalent and trivalent salts have a much more dramatic impact on zeta potential than the monovalent salt. This is not surprising because, as expected from eqn (7), the electric double layer around the nanobubbles deteriorates (i.e. κ−1 reduces) for a higher salt valence. Furthermore, the increase in the mean nanobubble diameter on addition of salt can be explained by eqn (5). Due to the screening of the electric double layer caused by the co-ions, the external negative electrostatic pressure, as discussed above, decreases leading to a pressure imbalance across the nanobubble interfaces which then expand. Smaller nanobubbles would be expected to be completely neutralised and destabilised, thus, leading to the observed reduction in bubble number density. Thus, nanobubble stability in acidic medium is expected to be much less compared to an alkaline medium. Similarly, the presence of any salt is expected to reduce nanobubble stability, the effects being more pronounced for higher valence salts. However, surfactant addition introduces steric stability to the nanobubbles which is expected to improve their long-term stability.
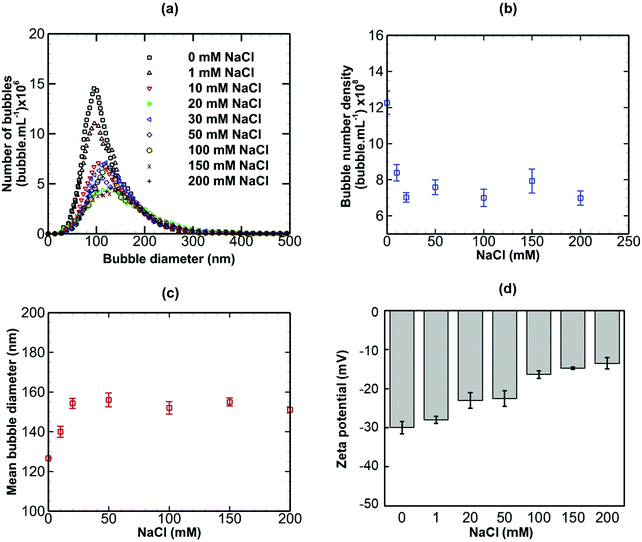 | ||
| Fig. 9 Effects of addition of NaCl (monovalent) on bulk nanobubbles initially generated in pure water. | ||
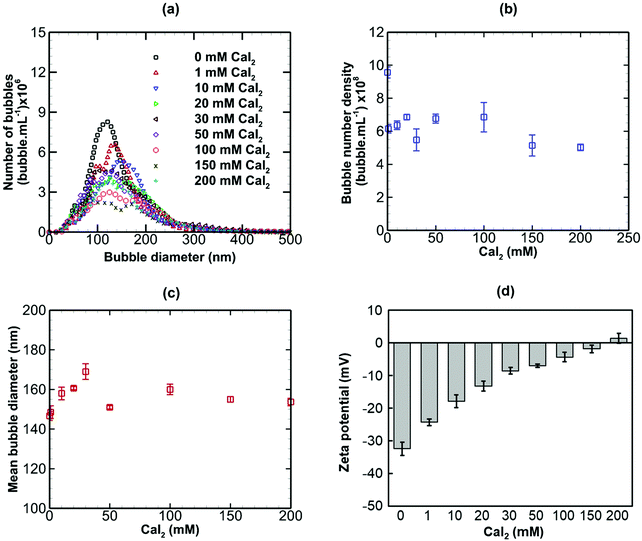 | ||
| Fig. 10 Effects of addition of CaI2 (divalent) on bulk nanobubbles initially generated in pure water. | ||
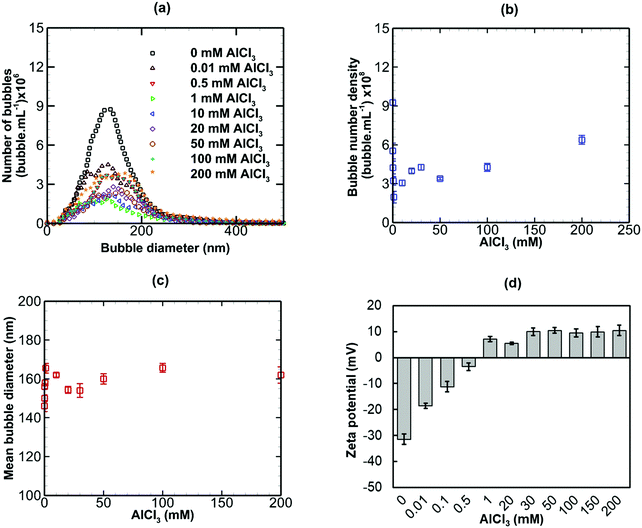 | ||
| Fig. 11 Effects of addition of AlCl3 (trivalent) on bulk nanobubbles initially generated in pure water. | ||
Colloidal stability could also be one of the reasons behind the longevity of bulk nanobubbles and this is discussed in terms of DLVO interaction potentials in the next section. The mean bubble diameter and surface potential measurements obtained in the above sections are used to estimate the electrostatic interaction potential of bulk nanobubbles.
3.6 DLVO potentials of nanobubble suspensions
Bulk nanobubbles suspended in water undergo Brownian motion and here we attempt to explain the colloidal stability of bulk nanobubbles based on the DLVO theory; this is different from their interfacial stability discussed above. For an air–water system, other non-DLVO forces such as solvation, structural, hydration and steric can be safely neglected.50 Therefore, the total interaction potential (wT(D)) between nanobubbles, consisting of the van der Waals and electrostatic interaction potentials can be written as follows:50| wT(D) = wR(D) + wA(D) | (8) |
 | (9) |
 | (10) |
 | (11) |
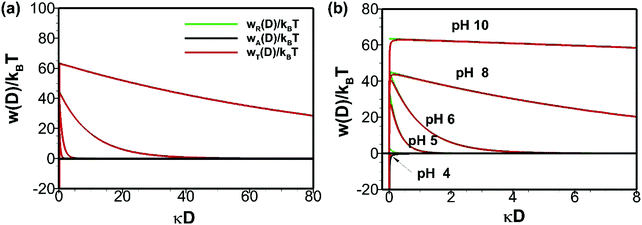 | ||
| Fig. 12 Effects of pH on DLVO interaction potentials of bulk nanobubbles initially generated in pure water: (b) is enlarged view of (a). | ||
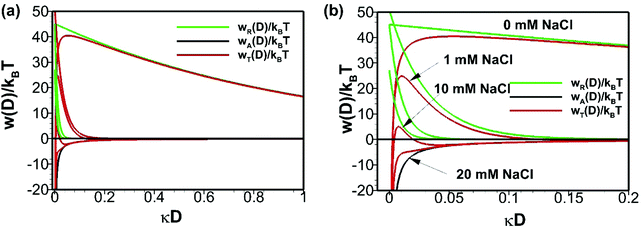 | ||
| Fig. 13 Effects of addition of NaCl on DLVO interaction potentials of bulk nanobubbles initially generated in pure water: (b) is enlarged view of (a). | ||
As expected from the earlier zeta potential measurements, above pH 4 the energy barrier is positive and it varies approximately from 20kBT to 60kBT as the pH increases from 4 to 10 (Fig. 12). Clearly, therefore, the DLVO theory predicts a stable colloidal system for bulk nanobubbles above pH 4. This is the reason why the number density of bulk nanobubbles drops sharply with a reduction in pH below the value of 4, as shown in Fig. 5(b).
On addition of NaCl (monovalent), owing to the screening of the electric double layer, the electrostatic contribution to the total potential decreases and, hence, the energy barrier in the total interaction potential plot decreases (Fig. 13). Beyond a certain critical concentration of NaCl (somewhere between 10–20 mM), the system becomes unstable. However, from eqn (9), it is clear that such a critical concentration for divalent (e.g. CaI2) and trivalent (e.g. AlCl3) salts will be much smaller. In conclusion, calculations based on the DLVO theory predict a stable colloidal system for bulk nanobubbles in pure water and this could be one of the reasons for their observed longevity. All in all, it seems therefore that in pure water the long-term stability of bulk nanobubbles is achieved through a combination of two factors: (i) the ion-stabilisation of their interface against dissolution; and (ii) their colloidal stability.
From the above discussion, bulk nanobubbles are expected to be stable due to the presence of a surface charge which exerts an external electrostatic pressure to balance the internal Laplace pressure. The surface charge also contributes to the colloidal stability of the nanobubble suspension in terms of electrostatic potential. The experimental results discussed above, demonstrate for the first time that the ion-stabilised model provides a plausible explanation for the stability of isolated nanobubbles against dissolution, whereas the DLVO theory provides a good interpretation of the colloidal stability of a nanobubble suspension against aggregation.
4. Conclusions
Bulk nanobubble suspensions were generated in pure water using a microfluidic device. The setup used was characterised by extremely low cavitation numbers, leading to intense hydrodynamic cavitation and, hence, the formation of bulk nanobubbles in concentrations exceeding 109 bubble mL−1.The effects of pH adjustment, addition of different types of surfactant and salt on the nanobubble suspensions were systematically studied. Results showed that bulk nanobubbles are much more stable in alkaline environments than acidic ones. The mean size of nanobubbles increases with a decrease in pH whereas the bubble number density decreases. The negative zeta potential of the suspension reduces in magnitude with decreasing pH, turning positive below the isoelectric point. The nanobubble interfaces in pure water being negatively charged, an electric double layer is formed around the nanobubbles due to the adsorption of OH− ions, akin to that observed around solid nanoparticles. We conjecture that the external electrostatic pressure created by the charged nanobubble interface balances the internal Laplace pressure and, therefore, no net diffusion of gas is expected at equilibrium.
The addition of a non-ionic surfactant does not affect the nanobubble size distribution, number density or surface charge, but is expected to provide steric stabilisation to the suspension. An anionic surfactant does not affect the nanobubble number density or size distribution, but it is expected to enhance the stability of the nanobubbles by the so-called electro-steric stabilization mechanism as the surface charge increases with surfactant concentration. A cationic surfactant, on the other hand, gradually neutralises the surface potential leading to a charge reversal at the interface of the nanobubbles and, as a result, produces complex effects on the nanobubble number density and size distribution. This is expected to destabilise the suspension at low surfactant concentrations, but stability is restored at higher concentrations as the surface charge increases again beyond the point of charge reversal.
The addition of a small amount of any valence salt leads to a sharp drop in bubble number density which is accompanied by a steep rise in mean bubble diameter. The magnitude of the negative zeta potential decreases considerably but stays negative in the case of a monovalent salt, whereas it drops to zero in the case of divalent salt, and changes to positive at the highest concentration in the case of trivalent salt. The electric double layer around the nanobubbles deteriorates (i.e. the Debye length reduces) for higher salt valance. The addition of salt leads to screening of the electric double layer caused by the co-ions. As a result, the external negative electrostatic pressure decreases leading to a pressure imbalance across the interface of a nanobubble which then expands. Finally, calculations based on the DLVO theory predict a stable colloidal system for bulk nanobubbles in pure water and this could be a further reason behind their observed longevity.
Conflicts of interest
There are no conflicts of interest to declare.Appendix-A: derivation of eqn (3)
Consider a spherical nanobubble, as shown in Fig. 14, of radius, R and surface charge, Qs under Brownian motion in the bulk of the liquid. The system of gas and liquid can be assumed to be in thermodynamic equilibrium at a certain fixed temperature and pressure. The presence of ions in the bulk liquid constitutes an electric double layer (EDL) and the adsorbed ions (assumed to be point charge) at the interface are expected to exert an external inward radial force due to Coulomb interactions. For a conservative force field like electric force, the force exerted due to the adsorbed ions can be written in terms of gradient of potential energy as follows:50| F = −∇Ue | (A1) |
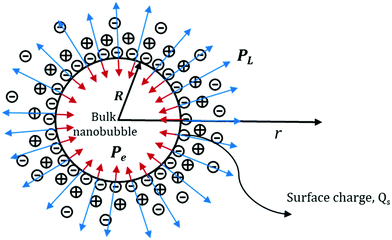 | ||
| Fig. 14 Schematic representation of the Laplace and electrostatic pressures acting on a bulk nanobubble. | ||
Thus, the external electrostatic pressure acting in an opposite direction to the inner Laplace pressure (Fig. 14), can be written as follows:
 | (A2) |
 | (A3) |
 can be expressed in the form:
 | (A4) |
Finally, by combining eqn (A2) and (A4), eqn (3) above for the electrostatic pressure can be obtained as:
 | (A5) |
Acknowledgements
This work was supported by EPSRC Grant EP/L025108/1. The loan of a Zetasizer Nano ZSP by Malvern Instruments (UK) is gratefully acknowledged.References
- J. H. Weijs, J. R. T. Seddon and D. Lohse, ChemPhysChem, 2012, 13, 2197–2204 CrossRef CAS PubMed.
- K. Ohgaki, N. Q. Khanh, Y. Joden, A. Tsuji and T. Nakagawa, Chem. Eng. Sci., 2010, 65, 1296–1300 CrossRef CAS.
- P. S. Epstein and M. S. Plesset, J. Chem. Phys., 1950, 18, 1505–1509 CrossRef CAS.
- A. Agarwal, W. J. Ng and Y. Liu, Chemosphere, 2011, 84, 1175–1180 CrossRef CAS PubMed.
- A. Ghadimkhani, W. Zhang and T. Marhaba, Chemosphere, 2016, 146, 379–384 CrossRef CAS PubMed.
- J. Zhu, H. An, M. Alheshibri, L. Liu, P. M. J. Terpstra, G. Liu and V. S. J. Craig, Langmuir, 2016, 32, 11203–11211 CrossRef CAS PubMed.
- A. Ushida, T. Hasegawa, N. Takahashi, T. Nakajima, S. Murao, T. Narumi and H. Uchiyama, J. Surfactants Deterg., 2012, 15, 695–702 CrossRef CAS.
- S. Calgaroto, K. Q. Wilberg and J. Rubio, Miner. Eng., 2014, 60, 33–40 CrossRef CAS.
- M. Fan, D. Tao, R. Honaker and Z. Luo, Min. Sci. Technol., 2010, 20, 1–19 CAS.
- M. Fan, D. Tao, R. Honaker and Z. Luo, Min. Sci. Technol., 2010, 20, 159–177 CAS.
- S. Calgaroto, A. Azevedo and J. Rubio, Miner. Eng., 2016, 89, 24–29 CrossRef CAS.
- A. Sobhy and D. Tao, Int. J. Miner. Process., 2013, 124, 109–116 CrossRef CAS.
- J. Tian, F. Yang, H. Cui, Y. Zhou, X. Ruan and N. Gu, ACS Appl. Mater. Interfaces, 2015, 7, 26579–26584 CrossRef CAS PubMed.
- T. Yin, P. Wang, R. Zheng, B. Zheng, D. Cheng, X. Zhang and X. Shuai, Int. J. Nanomed., 2012, 7, 895–904 CAS.
- N. Rapoport, Z. Gao and A. Kennedy, J. Natl. Cancer Inst., 2007, 99, 1095–1106 CrossRef CAS PubMed.
- X. Fan, L. Wang, Y. Guo, Z. Tu, L. Li, H. Tong, Y. Xu, R. Li and K. Fang, PLoS One, 2015, 10, e0127419 CrossRef PubMed.
- Y. Wang, X. Li, Y. Zhou, P. Huang and Y. Xu, Int. J. Pharm., 2010, 384, 148–153 CrossRef CAS PubMed.
- S. A. Peyman, J. R. McLaughlan, R. H. Abou-Saleh, G. Marston, B. R. G. Johnson, S. Freear, P. L. Coletta, A. F. Markham and S. D. Evans, Lab Chip, 2016, 16, 679–687 RSC.
- S. K. Misra, G. Ghoshal, M. R. Gartia, Z. Wu, A. K. De, M. Ye, C. R. Bromfield, E. M. Williams, K. Singh, K. V. Tangella, L. Rund, K. Schulten, L. B. Schook, P. S. Ray, E. C. Burdette and D. Pan, ACS Nano, 2015, 9, 10695–10718 CrossRef CAS PubMed.
- M. Meng, J. Gao, C. Wu, X. Zhou, X. Zang, X. Lin, H. Liu, C. Wang, H. Su, K. Liu, Y. Wang, X. Xue and J. Wu, Tumor Biol., 2016, 37, 8673–8680 CrossRef CAS PubMed.
- A. Ushida, T. Hasegawa, T. Nakajima, H. Uchiyama and T. Narumi, Exp. Therm. Fluid Sci., 2012, 39, 54–59 CrossRef CAS.
- F. Kawara, J. Inoue, M. Takenaka, N. Hoshi, A. Masuda, S. Nishiumi, H. Kutsumi, T. Azuma and T. Ohdaira, Digestion, 2014, 90, 10–17 CrossRef CAS.
- S. Liu, S. Oshita, Y. Makino, Q. Wang, Y. Kawagoe and T. Uchida, ACS Sustainable Chem. Eng., 2016, 4, 1347–1353 CrossRef CAS.
- S. Liu, Y. Kawagoe, Y. Makino and S. Oshita, Chem. Eng. Sci., 2013, 93, 250–256 CrossRef CAS.
- N. Matsuki, T. Ishikawa, S. Ichiba, N. Shiba, Y. Ujike and T. Yamaguchi, Int. J. Nanomed., 2014, 9, 4495–4505 CrossRef PubMed.
- S. H. Oh, S. H. Yoon, H. Song, J. G. Han and J.-M. Kim, Int. J. Hydrogen Energy, 2013, 38, 14849–14853 CrossRef CAS.
- S. H. Oh, J. G. Han and J.-M. Kim, Fuel, 2015, 158, 399–404 CrossRef CAS.
- W. B. Zimmerman, V. Tesař and H. C. H. Bandulasena, Curr. Opin. Colloid Interface Sci., 2011, 16, 350–356 CrossRef CAS.
- J. Fan, Y. Jing, H. Liangzhi, L. Hiufung and W. Chi, J. Phys. Chem. B, 2007, 111, 2255–2261 CrossRef PubMed.
- W. A. Ducker, Langmuir, 2009, 25, 8907–8910 CrossRef CAS PubMed.
- A. Häbich, W. Ducker, D. E. Dunstan and X. Zhang, J. Phys. Chem. B, 2010, 114, 6962–6967 CrossRef PubMed.
- J. Qiu, Z. Zou, S. Wang, X. Wang, L. Wang, Y. Dong, H. Zhao, L. Zhang and J. Hu, ChemPhysChem, 2017, 18, 1345–1350 CrossRef CAS PubMed.
- S. O. Yurchenko, A. V. Shkirin, B. W. Ninham, A. A. Sychev, V. A. Babenko, N. V. Penkov, N. P. Kryuchkov and N. F. Bunkin, Langmuir, 2016, 32, 11245–11255 CrossRef CAS PubMed.
- N. F. Bunkin, A. V. Shkirin, N. V. Suyazov, V. A. Babenko, A. A. Sychev, N. V. Penkov, K. N. Belosludtsev and S. V. Gudkov, J. Phys. Chem. B, 2016, 120, 1291–1303 CrossRef CAS PubMed.
- N. F. Bunkin and A. V. Shkirin, J. Chem. Phys., 2012, 137, 054707 CrossRef CAS PubMed.
- K. Yasui, T. Tuziuti, W. Kanematsu and K. Kato, Langmuir, 2016, 32, 11101–11110 CrossRef CAS PubMed.
- J. R. T. Seddon, D. Lohse, W. A. Ducker and V. S. J. Craig, ChemPhysChem, 2012, 13, 2179–2187 CrossRef CAS PubMed.
- M. Sedlák and D. Rak, J. Phys. Chem. B, 2013, 117, 2495–2504 CrossRef PubMed.
- T. Tuziuti, K. Yasui and W. Kanematsu, Ultrason. Sonochem., 2017, 38, 347–350 CrossRef CAS PubMed.
- V. Leroy and T. Norisuye, ChemPhysChem, 2016, 17, 2787–2790 CrossRef CAS PubMed.
- J. A. Carr, K. S. Nalwa, R. Mahadevapuram, Y. Chen, J. Anderegg and S. Chaudhary, ACS Appl. Mater. Interfaces, 2012, 4, 2831–2835 CrossRef CAS PubMed.
- C. E. Brennen, Cavitation and Bubble Dynamics, Cambridge University Press, 2013 Search PubMed.
- C. Mishra and Y. Peles, Phys. Fluids, 2005, 17, 013601 CrossRef.
- W. Sutherland, Philos. Mag., 1905, 9, 781–785 CAS.
- V. Filipe, A. Hawe and W. Jiskoot, Pharm. Res., 2010, 27, 796–810 CrossRef CAS PubMed.
- N. Nirmalkar, A. W. Pacek and M. Barigou, Langmuir, 2018, 34, 10964–10973 CrossRef CAS PubMed.
- K. Ebina, K. Shi, M. Hirao, J. Hashimoto, Y. Kawato, S. Kaneshiro, T. Morimoto, K. Koizumi and H. Yoshikawa, PLoS One, 2013, 8, e65339 CrossRef CAS PubMed.
- N. F. Bunkin and F. V. Bunkin, Sov. Phys. – JETP, 1992, 74, 271–278 Search PubMed.
- H. Liu and G. Cao, Sci. Rep., 2016, 6, 23936 CrossRef CAS PubMed.
- J. N. Israelachvili, Intermolecular and Surface Forces: With Applications to Colloidal and Biological Systems, Academic Press, 1985 Search PubMed.
- G. Duplâtre, M. F. Ferreira Marques and M. da Graça Miguel, J. Phys. Chem., 1996, 100, 16608–16612 CrossRef.
| This journal is © The Royal Society of Chemistry 2018 |

