 Open Access Article
Creative Commons Attribution 3.0 Unported Licence
Combining adhesive contact mechanics with a viscoelastic material model to probe local material properties by AFM†
Christian
Ganser
 *ab,
Caterina
Czibula
ab,
Daniel
Tscharnuter
c,
Thomas
Schöberl
d,
Christian
Teichert
 ab and
Ulrich
Hirn
 be
be
aInstitute of Physics, Montanuniversitaet Leoben, Franz Josef – Str. 18, 8700 Leoben, Austria. E-mail: christian.ganser@alumni.unileoben.ac.at
bChristian Doppler Laboratory for Fiber Swelling and Paper Performance, Graz University of Technology, Inffeldgasse 23, 8010 Graz, Austria
cPolymer Competence Center Leoben GmbH, Roseggerstr. 12, 8700 Leoben, Austria
dErich Schmid Institute, Jahnstr. 12, 8700 Leoben, Austria
eInstitute of Paper, Pulp and Fiber Technology, Graz University of Technology, Inffeldgasse 23, 8010 Graz, Austria
First published on 29th November 2017
Abstract
Viscoelastic properties are often measured using probe based techniques such as nanoindentation (NI) and atomic force microscopy (AFM). Rarely, however, are these methods verified. In this article, we present a method that combines contact mechanics with a viscoelastic model (VEM) composed of springs and dashpots. We further show how to use this model to determine viscoelastic properties from creep curves recorded by a probe based technique. We focus on using the standard linear solid model and the generalized Maxwell model of order 2. The method operates in the range of 0.01 Hz to 1 Hz. Our approach is suitable for rough surfaces by providing a defined contact area using plastic pre-deformation of the material. The very same procedure is used to evaluate AFM based measurements as well as NI measurements performed on polymer samples made from poly(methyl methacrylate) and polycarbonate. The results of these measurements are then compared to those obtained by tensile creep tests also performed on the same samples. It is found that the tensile test results differ considerably from the results obtained by AFM and NI methods. The similarity between the AFM results and NI results suggests that the proposed method is capable of yielding results comparable to NI but with the advantage of the imaging possibilities of AFM. Furthermore, all three methods allowed a clear distinction between PC and PMMA by means of their respective viscoelastic properties.
1 Introduction
Viscoelastic properties of a material can be determined by loading with a defined stress schedule and recording the material's response in terms of strain to obtain a stress-vs.-strain plot. Then, certain models – usually abstract combinations of springs and dashpots, such as the standard linear solid (SLS) model – can be applied to extract elastic and viscous parameters such as elastic moduli and viscosities, respectively. This procedure is straightforward for samples with a well defined geometry, which can be easily tested by a tensile tester. However, samples with a natural variation in geometry and a distinct anisotropy pose additional difficulties. Consider paper fibers: wood tracheids extracted by chemical or physical disintegration of the wood. These fibers are highly anisotropic, measure only several tens of micrometers in diameter and are a few millimeters long. Moreover, their surfaces are very rough and wrinkled in appearance. While it is certainly possible, the longitudinal viscoelastic properties are not easy to obtain and, due to the orthotropic material properties of the fibers, they are different from the transversal properties. The transversal properties, however, are even more difficult to detect because of the rough and wrinkled surfaces of the fibers. It is hard to establish a homogeneous and well-defined contact area to test the whole fiber in the transversal direction. One way is to probe the fibers locally using a stiff tip of well-defined geometry, as in nanoindentation (NI) or atomic force microscopy (AFM). With an AFM-based NI (AFM-NI) method it is possible to circumvent the problem of the rough surface by first scanning the sample and then selecting a locally smooth and flat region to perform the mechanical test. Also, imaging by AFM can be performed without disturbing the surface of soft samples by employing the intermittent contact mode. With classical NI, the detection of viscoelastic properties has already been performed on metals1 as well as polymers,2 while AFM has been used to study the viscoelasticity of polymer membranes,3 gels and cells.4,5By using a probe based technique such as NI or AFM, however, it is not possible to detect stress and strain – only force and indentation depth are directly accessible. In order to obtain stress and strain, contact mechanics needs to be employed. Several theories for contact mechanics are available, the oldest being the Hertz theory, formulated in 1881.6 A more recent take on contact mechanics is the Johnson–Kendall–Roberts (JKR) theory,7 which becomes necessary when adhesion forces need to be considered. Another way to assess adhesion forces is to employ the Derjaguin–Muller–Toporov (DMT) theory.8 Both, DMT and JKR, are extremes of the more general and complex Maugis theory.9
Evidently, in order to determine local viscoelastic properties by using AFM, a viscoelastic model (VEM) needs to be combined with contact mechanics. This has been achieved in several ways already. The most straightforward way is to extract the time dependent elastic modulus from a VEM of choice and insert it in a contact mechanics theory of choice.10,11 The advantage is that such an approach is very easy to use, once the equation that describes the indentation depth as a function of the applied load has been developed. But it is necessary to re-develop the equation every time when the load schedule is changed.
In order to keep the procedure adaptable, a different approach is needed. The probably most flexible way is to simulate the tip–sample interaction – basically the contact mechanics – in combination with the constitutive differential equation of a VEM numerically.12,13 This approach can be – once developed – applied to any arbitrary load schedule and could even be expanded to incorporate the local sample topography. The huge drawback of this approach is that calculating one force–distance curve can take up to several hours, making it painstakingly slow to fit the model to experimentally recorded force–distance curves – potentially hundreds or thousands of them.
A rarely used alternative to the two methods described is a combination of both: a contact mechanics theory is applied to convert the force and indentation depth into stress and strain and these relations are then inserted into the constitutive differential equation of the VEM, which is then solved numerically. Depending on the complexity of the contact mechanics theory and the VEM, the calculation of a single force–distance takes between a second and several minutes (implemented with GNU/Octave on a conventional office computer). In other words, it is feasible to use this approach to fit the calculated indentation–time curves to measured ones in order to extract the viscoelastic parameters.
It should also be mentioned that a common way to characterize viscoelasticity with AFM is dynamical approaches where the load is applied as a harmonic oscillation. The phase lag between excitation and response is detected and used as a measure for the dissipated energy due to viscoelastic effects. This method is commonly applied to polymeric materials.14,15 Another similar approach is to evaluate the hysteresis in the force–distance curve to extract the dissipated energy.16 This type of analysis, however, requires a model for the degree of contact between tip and material as a function of indentation depth, because, due to the surface topography, up to an indentation depth in the scale of the roughness there is only partial contact between the tip and the surface.
Other dynamical approaches to viscoelastic measurements with AFM include contact resonance AFM (CR-AFM)17,18 and amplitude modulation–frequency modulation AFM (AM–FM AFM).19 In the case of CR-AFM, viscoelastic properties are determined from the change of the resonance curve between the free oscillation and during contact with the sample. AM–FM is a bi-modal technique where the dissipation is extracted from the first order excitation (AM) and the elastic part from the second order excitation. Both techniques operate in the region of the AFM cantilever resonance frequency which is in the range of 10 kHz to 1 MHz.
In this article, a procedure to measure viscoelastic properties by AFM is presented. Two polymers poly(methyl methacrylate) (PMMA) and polycarbonate (PC) are investigated by the AFM based method and the results are compared to those obtained by NI and tensile creep tests. As an outlook for further research, viscose fibers fully swollen in water are also tested by the AFM based method to show its applicability to nanoscale cellulosic materials.
2 Materials and methods
2.1 Polymer samples
To test our method, the polymer materials poly(methyl methacrylate) (PMMA) (Plexiglas 7N, Evonik Industries AG) and polycarbonate (PC) (Makrolon 2405, Covestro AG) were selected. From these materials ISO 3167 multi-purpose specimens were manufactured by injection molding. The specimens feature a gauge length of 80 mm and a width and thickness of 10 mm and 4 mm, respectively. After the tensile tests were performed, pieces with a length between 10 mm and 20 mm were cut out for AFM-NI and NI measurements. These pieces were cut from a region which was deformed during tensile testing. However, since the deformations during tensile testing were low (0.5% and 1%), only elastic deformation occurred and this should not affect the subsequent AFM-NI and NI measurements. The PMMA and PC samples exhibited a root mean square (rms) roughness of 12 nm ± 1.4 nm and 8.5 nm ± 4.7 nm, respectively. The rms roughness was determined from three independent 5 μm × 5 μm AFM images.2.2 Cellulose fiber samples
The investigated cellulose fiber samples were viscose fibers with a rectangular cross-section (Kelheim Fibres GmbH, Kelheim, Germany). The fibers were cut at a length of about 4 mm, and were approximately 200 μm wide and 5 μm in thickness. These flat viscose fibers offer a rather smooth and homogeneous surface and are made of almost pure cellulose, rendering them an ideal model system for paper fibers. To investigate the fibers for their mechanical properties with AFM, they need to be fixed on the substrate in such a way that the fibers cannot bend during load application. This is achieved by gluing the fibers on a drop of nail polish placed on a steel sample holder.20 Then, the fibers are embedded in nail polish with only their surface exposed. Using nail polish to fix cellulose fibers for AFM-NI investigations has been proven to work for viscose fibers as well as pulp fibers.21,222.3 Atomic force microscopy
The atomic force microscope in use was an Asylum Research MFP-3D AFM, equipped with a closed-loop scanner. Topography images were recorded in intermittent contact mode at a set-point to free amplitude ratio of 0.7. For topographical studies, Olympus AC160 silicon probes (nominal tip radius: 10 nm, nominal spring constant: 30 N m−1) were used.The AFM based nanoindentation (AFM-NI) as well as the viscoelastic studies were conducted with Team Nanotec LRCH250 silicon probes. These probes have an apex radius between 150 nm and 400 nm. The spring constant of the cantilever in use, measured by the thermal sweep method23 is (65 ± 10) N m−1, the thermal Q is 672 ± 27, and the resonant frequency is (366.7 ± 0.1) kHz (values are given as mean ± standard deviation calculated from 5 independent measurements). As the spring constant determination is not standardized, the Q and resonant frequency are given for comparability.24 Although the LRCH250 probes were characterized with scanning electron microscopy images by the manufacturer, the tip geometry was checked using an NT-MDT TGT01 characterization grid. By utilizing the principle of tip-sample dilation,25 it is possible to image the AFM tip by scanning over such a grid of sharp spikes. In this way, the tip radius of the probe in use was found to be 350 nm. Using large radius AFM tips makes it possible to use high forces while still keeping the deformation low. Also, the strain beneath the indenter is proportional to the reciprocal value of the tip radius.26 This means that by increasing the tip radius, higher indentation depths can be achieved without increasing the strain. Keeping the strain low is important for staying within the linear elastic regime of polymers.27
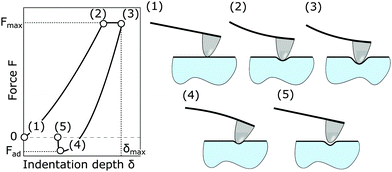
To measure the viscoelastic properties with AFM-NI, force–indentation (F–δ) curves are recorded. Before an F–δ curve is recorded, the AFM tip is approached to the surface with a velocity of 1 μm s−1 until a force of about 50 nN – the so-called trigger point – is reached. From this trigger point onwards, the F–δ curve is measured. Such an F–δ curve is sketched in Fig. 1 on the left side. The right side of Fig. 1 illustrates how the AFM cantilever reacts at certain points in the F–δ curve, indicated from (1) to (5). At point (1), the tip is in contact with the surface, and no external force is applied (besides the necessary 50 nN), so only adhesion forces act. The maximum force is reached at (2) and held constant. But due to the viscoelastic creep effects, the tip penetrates the surface further without an additional increase of the force to reach point (3). Then, the force is reduced again. However, to separate the tip from the surface, a negative force needs to be applied until the lowest point in the F–δ curve is reached at (4). This negative force is called the adhesion force Fad. At this point, the AFM tip separates spontaneously from the sample surface to reach point (5), which denotes the end of the F–δ curve.
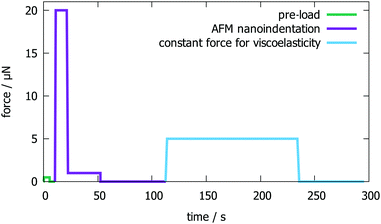
After the trigger point of about 50 nN is reached, the load schedule presented in Fig. 2 is applied. The load schedule consists of three steps: pre-load, plastic deformation, and pure viscoelastic response. The pre-load step is introduced to establish stable contact between the tip and sample by applying 800 nN for 5 s. For plastic deformation, a load of 20 μN is applied by a linear increase of force within 1 s and held for 10 s before unloading to 1 μN with 20 μN s−1 and holding there for 30 s. Then, the force is kept at zero (only with the trigger force of about 50 nN acting) for 60 s to give the material time to recover from the previous loading. In the final step, the force is increased to 5 μN with a loading rate of 3.2 μN s−1 and held there for 120 s before unloading with 3.2 μN s−1 to the trigger force. The force is then kept for another 60 s at the trigger force. In this final step, where 5 μN are applied, the viscoelastic response is measured.
From the second part of the loading schedule, the plastic deformation, it is basically possible to obtain the reduced modulus Er and hardness H according to Oliver and Pharr28 which we described in an earlier work.21 However, the applied 20 μN in the plastic deformation step proved to lead to high cantilever deflections which initiated the sliding of the tip on the surface. This made it impossible to evaluate the data. But we could measure H and Er when a force of only 10 μN was applied, which resulted in H = 450 MPa ± 90 MPa, Er = 2.8 GPa ± 0.5 GPa for PMMA and H = 145 MPa ± 25 MPa, Er = 1.5 GPa ± 0.4 GPa for PC (the values are given as mean ± standard deviation and are averages of 600 single measurements per material). The main reason for the plastic deformation step is not to extract mechanical properties, but to create a defined surface and eliminate as far as possible further plastic effects when measuring the viscoelastic response.29–31 Further details on how to treat the tip indenting in the plastically deformed region and proof that the tip is sliding across the surface are given in Section 2.6.
2.4 Viscoelastic contact mechanics
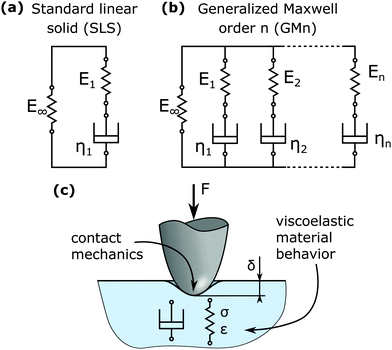
Viscoelastic models (VEMs), as shown in Fig. 3a and b, can be used to relate the stress and strain of a material that exhibits a time dependent behavior under load by using elastic (springs, denoted Ei) and viscous (dashpots, denoted ηi) parts. Dashpots are elements where the stress is proportional to the strain rate: σdashpot = η![[small epsi, Greek, dot above]](https://www.rsc.org/images/entities/i_char_e0a1.gif) . The springs follow Hooke's law and generate stress directly proportional to the strain: σspring = Eε.
. The springs follow Hooke's law and generate stress directly proportional to the strain: σspring = Eε.
The VEM drawn in Fig. 3a is called the standard linear solid (SLS) model and the one presented in Fig. 3b is the generalized Maxwell (GM) model. Here, the order of the GM model indicates the order of the resulting differential equation for stress and strain. In this sense, the SLS model is a GM model of order 1 (GM1). In this work, only the SLS model and the GM2 model are considered for evaluation of the data.
A GMn model results in a material behavior with a finite lower and upper bound for the elastic modulus. Consider the infinitely slow deformation for which ![[small epsi, Greek, dot above]](https://www.rsc.org/images/entities/i_char_e0a1.gif) → 0 and thus σdashpot → 0. This means that no load can be transferred from the dashpot to the spring and, consequently, no branch with a dashpot can contribute to resisting the deformation, so only E∞ remains. If, however, the deformation is applied infinitely fast,
→ 0 and thus σdashpot → 0. This means that no load can be transferred from the dashpot to the spring and, consequently, no branch with a dashpot can contribute to resisting the deformation, so only E∞ remains. If, however, the deformation is applied infinitely fast, ![[small epsi, Greek, dot above]](https://www.rsc.org/images/entities/i_char_e0a1.gif) → ∞ and σdashpot → ∞. Now, the dashpots are basically rigid and only the springs are deformed leading to a modulus
→ ∞ and σdashpot → ∞. Now, the dashpots are basically rigid and only the springs are deformed leading to a modulus  . Thus, the lower bound for the modulus is E∞ and the upper bound is E0.
If such a model is to be applied to a force versus indentation plot recorded by NI or AFM-NI, where a probe with a defined geometry penetrates a material surface, contact mechanics are needed to transform the force F and indentation δ to the stress σ and strain ε, indicated in Fig. 3c. The tip geometry is taken into account by the contact mechanics and the time dependent material behavior by a set of parameters Ei and ηi. Then, the VEM can be rewritten in terms of F and δ and the resulting differential equation solved numerically to describe the time dependent δ(t) for a given load schedule F(t) or vice versa.
The procedure to obtain a constitutive equation for the SLS model in combination with the JKR contact mechanics is outlined in the following. The resulting differential equation is somewhat lengthy for the SLS model and even more so for the GM2 model, thus we refrain from printing it. However, using the outline presented here, it is straightforward to arrive at the final equation, even for the GM2 model.
The constitutive equation for the SLS model is
 | (1) |
 , and
, and  , according to Fig. 3a. The dot above a variable is the common shorthand for the operator
  . The calculation of the average stress and strain beneath a spherical indenter is given in detail in the ESI.† Here, only the results are shown. The average stress beneath a spherical indenter, as given by JKR theory, is
 | (2) |
 | (3) |
 | (4) |
Again, details on how to arrive at eqn (4) are given in the ESI.†
Now, eqn (2) and (4) are substituted for σ and ε in eqn (1) to attain
 | (5) |
The resulting differential equation in δ and F is presented in the ESI† along with the GM2 variant as GNU/Octave representations, ready for use. The differential eqn (5) is then numerically solved using an implementation of Hindmarsh's solver in GNU/Octave.32,33 This numerical solution is then fitted to the experimental data using a GNU/Octave implementation of the Levenberg–Marquardt method.34,35
2.5 Initial parameters and adhesion
The differential equation describing the time dependent indentation δ, resulting from eqn (5), is of first order in δ. This means that one initial condition must be supplied, specifically δ(t = 0) = δ0. In this work we use a pre-loading of F0 = 50 nN, which means that δ0 is not zero. In addition, the adhesion force Fad also causes the tip to penetrate the sample surface, even if no external force is present. If the mechanical parameter E∞ is known and assuming the equilibrium state (t → ∞ and thus E = E∞), δ0 can be calculated from JKR theory for any adhesion force. However, since E∞ is previously unknown, δ0 has to be determined experimentally. This is done by measuring the indentation depth directly after tip–sample contact and the indentation depth after the 5 s pre-loading segment (800 nN). The difference between these two values is then used as δ0. The average δ0 values are 4.8 nm ± 3.4 nm and 4.6 nm ± 3.3 nm for PC and PMMA, respectively. Please note that the correct determination of δ0 is crucial for gaining meaningful results, as was revealed by a sensitivity analysis of the numerical procedure (see Section S6 of the ESI†). The adhesion forces for PC and PMMA, detected from the force distance curves, are 208 nN ± 44 nN and 314 nN ± 49 nN, respectively. The averages of δ0 and Fad are determined from the 576 (PC) and 404 (PMMA) values. Discrepancies between the experimental and theoretical values of δ0 might arise from the plastic deformation of surface asperities during the initial contact formation. As there is no other way to determine δ0, except guessing E∞ beforehand, we use the values found experimentally.In the case of the GM2 model, a second order differential equation describes δ(t), which means that also the initial creep rate  needs to be supplied. This parameter is assumed to be zero.
As mentioned above, the adhesion forces were found to be approximately in the range of 200 nN to 300 nN. This means that the adhesion effects have to be taken into account by a suitable contact mechanics theory, such as the JKR theory. A quantitative study of the influence of the adhesion force on the creep curve and the determined viscoelastic parameters is presented in the ESI.†
2.6 Plastic pre-deformation
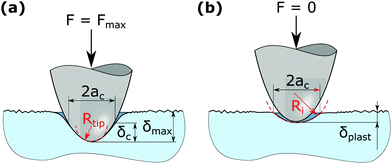
In Section 2.3, the loading schedule (see Fig. 2) was described in detail and introduced a segment where the sample was plastically deformed to create a defined surface. Now, we describe what is happening at this segment. As is sketched in Fig. 4, when deforming a surface plastically by indenting a tip (Fig. 4a), the surface will recover upon unloading the elastic part of the deformation. A depression is left in the surface which is not as deep as the surface profile during maximum load (Fig. 4b). It is possible to estimate the radius of the depression by assuming that the contact radius ac at contact depth δc is identical to the radius of the depression after unloading (see Fig. 4). It is further assumed that the depression is a sphere segment.26 It is then only a matter of simple geometry to get an expression for the radius of the permanent indent, labeled Ri in Fig. 4.When a tip indents a perfectly smooth and flat surface, the effective tip radius R in eqn (2) and (4) is simply the tip radius Rtip. However, if a tip indents in a spherical depression, the resulting contact area is obviously higher than when it is indenting a flat surface or on top of a hill. According to Hertz contact mechanics6 this larger contact area can be taken into account by calculating the effective tip radius as
 | (6) |
To check the validity of the assumptions above, the deformed surface was imaged with a sharp tip. Exemplary AFM images of indents in PMMA and PC after AFM-NI are presented in Fig. 5a and b, and an indent in PC after NI in Fig. 5c. It was not possible to locate the indents in PMMA after NI with an optical microscope, so no images could be recorded. Note that the indents made by AFM-NI are elongated in one direction, as is indicated with the dashed circles in Fig. 5a and b. This elongation of the indent is caused by the bending of the AFM cantilever, which applies not only a force perpendicular to the sample surface but also a lateral force. Thus, the AFM tip slides across the surface during load application, in the direction of the cantilever's long axis.
The indents made by AFM-NI were analyzed by fitting an elliptical paraboloid to the indent, resulting in two separate radii of curvature. The smaller radius value is used for comparison with the estimated radius of curvature, since it is more likely to be related to the tip radius than the larger radius value, which is caused by sliding of the tip. The NI indents were analyzed by fitting a sphere segment to the AFM data. The comparison between the estimated radius of the indent and the one measured by AFM is made in Table 1. The estimation of the indents' radius of curvature always gives a higher value than the actual radius. This means that according to eqn (6) the effective radius Reff is underestimated and the mechanical properties, according to eqn (2) and (4), are overestimated.
| Sample/method | R i,est/Rtip | R i,exp/Rtip |
|---|---|---|
| PMMA/AFM-NI | 4.2 ± 0.5 | 2.3 ± 1.3 |
| PC/AFM-NI | 2.5 ± 0.3 | 1.3 ± 0.3 |
| PC/NI | 1.8 ± 0.1 | 1.3 ± 0.1 |
2.7 Nanoindentation
Nanoindentation (NI) experiments were performed using a Hysitron Triboscope (Hysitron, Minneapolis, USA), an add-on instrument mounted on the scanner unit of a Dimension D3100 (Bruker Inc., Billerica, USA) AFM. The tests were performed in load-controlled mode. Data acquisition was done using the Triboscope 4.1.0 software package. All tests were performed using a conical diamond tip with an average tip radius of 4.81 μm and an opening angle of 60°.The load schedule was adapted for NI so that the indentation depths would scale with the tip radius of the AFM-NI tests. The loading times were the same, but the forces were increased accordingly, leading to a maximum force of 3.8 mN and the constant force to determine the viscoelastic properties was 1 mN. The part with the maximum force, to induce plasticity, was performed in open loop, while the constant force regime was done in closed loop. The evaluation was performed in the same manner as described in Sections 2.4 and 2.6 for AFM-NI.
2.8 Tensile tests
Creep tests on the multi-purpose specimens were performed using an Instron 5500 electro-mechanical testing machine equipped with pneumatic grips and a 10 kN load cell. The tests were conducted at a constant temperature of 23 °C. Monotonic tensile tests were performed to determine the nominal stress for creep tests such that the initial strain in the creep tests was 0.5% for 3 samples and 1% for 3 different samples. This was chosen to minimize the nonlinear effects, which may become apparent already at small strains,36 while still allowing reliable strain measurement using 3D digital image correlation (ARAMIS 4M, GOM GmbH, Germany).3 Results and discussion
3.1 AFM based NI
Creep curves in AFM-NI were recorded by mapping a 5 μm × 5 μm area with a regular grid of force distance measurements. For PMMA, maps were recorded on 11 positions altogether and for PC, maps were recorded on 16 positions. Altogether, 404 curves were recorded for PMMA and 576 curves for PC.By evaluating each creep curve individually and averaging the parameters afterwards, the viscoelastic properties for PMMA using the SLS model are: E∞ = (2.3 ± 0.6) GPa, E1 = 1.2 ± 0.5, E0 = (3.5 ± 0.7) GPa, and η1 = (72 ± 86) GPa s. For PC the results are: E∞ = (1.6 ± 0.5) GPa, E1 = 0.74 ± 0.6, E0 = (2.3 ± 0.7) GPa, and η1 = (43 ± 67) GPa s. Note that the standard deviation in η1 is larger than the average value. This indicates that a reliable detection of this parameter is not possible in this way. Evaluating the creep curves individually using the GM2 model, the elastic parts and η1 seem reasonable, similar to the SLS model. The viscosity η2, however, could also not be determined reliably at all: the average values for PC and PMMA were in the range of 1011 GPa s for PMMA and 1015 GPa s for PC with a standard deviation of 20 to 30 times the average value.
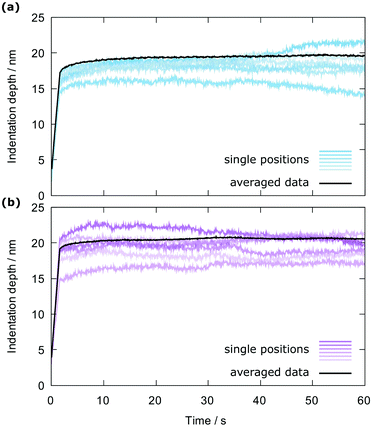
The aforementioned scattering, especially in η1 and η2 is caused by thermal drift and noise, which becomes non-negligible at low indentation depths (here <20 nm). Because of this, when each creep curve is evaluated individually, the scattering of the single curves is carried over to the results. See Fig. 6 for an example of how much the individual curves scatter. Also, the value of the initial indentation depth δ0 scatters a lot between the curves, as is mentioned in Section 2.5. As is shown in the ESI,† this input parameter contributes greatly to the output parameters. Thus, the large scattering in δ0 will also lead to a large scattering in the output parameters.
In order to compensate for these effects, it was necessary to average creep curves of one map (one map consists of 36 curves most of the time, only two maps recorded on PMMA are different: one made up of 64 curves and one of 16 curves) and evaluate these averaged curves with the method described in this work. The results of the AFM-NI measurements of the viscoelastic properties of PMMA and PC are presented in Tables 2 and 3, evaluated with the simple SLS model and with the more complex GM2 model. The E∞ and E0 values of PMMA are larger than the corresponding values of PC. This observation is true for the SLS parameters as well as the GM2 parameters. It is expected that PMMA has a higher elastic modulus than PC (e.g. about 4 GPa vs. 3 GPa37 or 3.8 GPa vs. 2.3 GPa38), thus, these two parameters seem to make sense. The viscosities η1 and η2 are higher for PMMA compared to PC, and this is true for SLS as well as GM2 parameters. The trend of E1 depends on the model in use. E2 (exists only in the GM2 model) is about the same for PMMA and PC. Note that the elastic parameters are very similar to the ones obtained by evaluating every curve individually but with reduced scattering. The viscosity, however, changes significantly in the average value as well as in the scattering (compare the values obtained by the SLS model in Tables 2 and 3 with those given at the beginning of this section).
| Model | Method | E ∞/GPa | E 1/GPa | E 2/GPa | E 0/GPa | η 1/GPa s | η 2/GPa s |
|---|---|---|---|---|---|---|---|
| SLS | AFM-NI | 2.3 ± 0.26 | 1.0 ± 0.32 | — | 3.3 ± 0.26 | 11 ± 5.5 | — |
| NI | 2.4 ± 0.05 | 1.1 ± 0.05 | — | 3.5 ± 0.10 | 12 ± 1.3 | — | |
| Tensile | 2.9 ± 0.17 | 0.30 ± 0.07 | — | 3.2 ± 0.09 | 38 ± 15 | — | |
| GM2 | AFM-NI | 2.3 ± 0.26 | 1.5 ± 0.71 | 0.81 ± 0.33 | 4.7 ± 0.70 | 1.3 ± 1.2 | 13 ± 6.8 |
| NI | 2.4 ± 0.05 | 1.6 ± 0.08 | 0.60 ± 0.05 | 4.5 ± 0.16 | 2.6 ± 0.34 | 12 ± 1.9 | |
| Tensile | 2.8 ± 0.17 | 0.24 ± 0.16 | 0.13 ± 0.07 | 3.4 ± 0.10 | 3.1 ± 1.2 | 26 ± 17 | |
| Model | Method | E ∞/GPa | E 1/GPa | E 2/GPa | E 0/GPa | η 1/GPa s | η 2/GPa s |
|---|---|---|---|---|---|---|---|
| SLS | AFM-NI | 1.5 ± 0.20 | 0.73 ± 0.16 | — | 2.2 ± 0.28 | 5.3 ± 3.0 | — |
| NI | 2.4 ± 0.17 | 0.74 ± 0.16 | — | 3.1 ± 0.32 | 5.3 ± 2.0 | — | |
| Tensile | 2.4 ± 0.07 | 0.05 ± 0.01 | — | 2.4 ± 0.05 | 7.0 ± 2.1 | — | |
| GM2 | AFM-NI | 1.5 ± 0.18 | 1.6 ± 0.84 | 0.62 ± 0.21 | 3.8 ± 0.73 | 0.52 ± 0.22 | 7.2 ± 4.2 |
| NI | 2.4 ± 0.17 | 1.2 ± 0.35 | 0.44 ± 0.11 | 4.0 ± 0.60 | 1.1 ± 0.26 | 7.3 ± 4.0 | |
| Tensile | 2.4 ± 0.06 | 0.037 ± 0.024 | 0.022 ± 0.017 | 2.4 ± 0.35 | 0.027 ± 0.022 | 3.3 ± 2.6 | |
In Fig. 6, six creep curves recorded on PMMA (Fig. 6a) and PC (Fig. 6b) are compared to the averaged creep curve. All plotted curves from one material were recorded within a square of 5 μm × 5 μm and scatter considerably. This scattering is directly reflected in the viscoelastic properties when evaluating every creep curve individually, as discussed above. After averaging all the curves from one map, the resulting curve appears much less erratic than the single curves and clearly exhibits a slow increase of indentation depth under constant load (starting at about 1.6 s). The strong scattering in the single curves could have several reasons. One possibility is local inhomogeneities in the material or contaminations on the surface causing a change of mechanical properties. Another effect could be that the influence of surface roughness is not completely eliminated by the initial plastic deformation. This would give rise to an apparent change in mechanical properties due to under- or overestimation of the contact area, which is performed using JKR theory. A third reason is thermal drift. If the thermal drift occurs at a constant drift rate, it is straightforward to eliminate it by simply subtracting a line with the appropriate slope from the data. However, if the thermal drift is not constant, it cannot be corrected for.
The fact that the averaged creep curves can be described by our viscoelastic model is illustrated in Fig. 7. In Fig. 7a, creep curves for PMMA and PC are presented with the corresponding GM2 fits. Both curves seem to be described well with the GM2 model. To better compare the GM2 model with the SLS model, the first 20 s of the creep curves of Fig. 7a are drawn in Fig. 7b, with the indentation depth ranging from 15 nm to 20 nm. In particular, in this initial part, the GM2 model describes the experimental data much better than the SLS model.
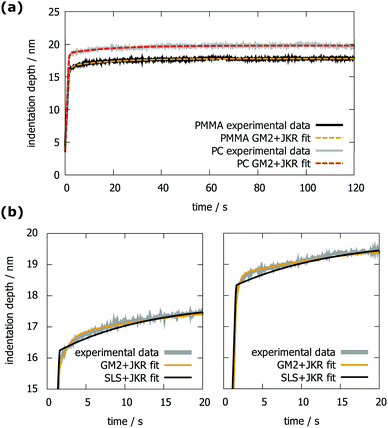 | ||
| Fig. 7 (a) Indentation depth versus time of PMMA and PC measured by AFM-NI and fitted with the GM2 model. (b) Comparison between the SLS and GM2 models for PMMA (left) and PC (right). | ||
3.2 Nanoindentation
Nanoindentation was performed on the same samples as AFM-NI, to compare our AFM based method. The results are presented in Tables 2 and 3. The elastic values obtained by NI show the same trend as those obtained by AFM-NI, but PMMA and PC are closer together with regard to E0. The E∞ is even the same value. Viscosities are determined slightly better with this method, as the scattering is lower compared to AFM-NI. The trend for the mean values of the viscosities, however, is the same as for the AFM-NI values. With NI, we could also obtain the values for hardness and modulus by using the Oliver and Pharr evaluation.28 The hardness values are H = 390 MPa for PMMA and H = 260 MPa for PC, the modulus values are E = 5.7 GPa for PMMA and E = 3.6 GPa for PC. These values give the expected trend, but are likely too high as a significant pile-up was found around the indents.By comparing the results from Tables 2 and 3, it becomes also evident that the scattering is larger on PC. The surface morphology of PC is similar to PMMA, thus it is possible that PC is more inhomogeneous than PMMA.
It is obvious that the GM2 model fits the NI data much better than the SLS model, as is presented in Fig. 8. Starting from 10 to 20 seconds after the constant maximum load has been reached, both models describe the data well. In the initial stage, however, the GM2 model surpasses the SLS model, which is illustrated in Fig. 8b. This is most prominent for the PMMA sample.
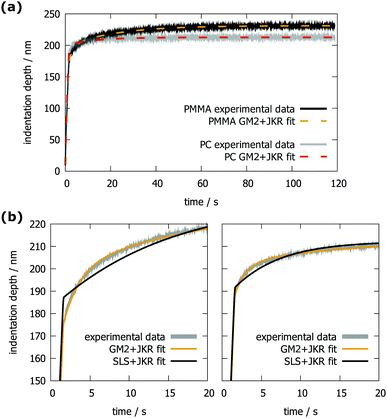 | ||
| Fig. 8 (a) Indentation depth versus time of PMMA and PC, measured by NI and the corresponding GM2 + JKR fits. (b) Comparison between the SLS + JKR and GM2 + JKR fits on PMMA (left) and on PC (right). | ||
Comparing E∞ determined by the SLS model with the value determined by the GM2 model reveals that the result is completely unaffected by the model. This makes sense, as this modulus is basically determined by the indentation depth after an infinitely long creep time. The modulus E0, however, is heavily affected by the choice of model, as is evident from Tables 2 and 3.
3.3 Tensile tests
Before performing AFM-NI and NI, the whole samples were tested in a tensile mode creep test. The results are summarized in Tables 2 and 3. The values of E∞ are higher than those obtained by NI (and, therefore, also higher than those of AFM-NI). The E0 values, however, are similar to those measured by AFM-NI when using the SLS model. Here, the values for E1 – and E2, if applicable – are significantly smaller than those determined by the other methods. The viscosities determined by using the SLS model follow the same trend as observed for the other two methods and the values are of the same order of magnitude.In Fig. 9a, exemplary tensile strain versus time plots of PMMA and PC including GM2 fits are presented. Again, the GM2 model describes the experimental data best, as is illustrated in Fig. 9b, where the SLS and GM2 models are compared. Interestingly, for PC, the SLS model fits the data almost as well as the GM2 model.
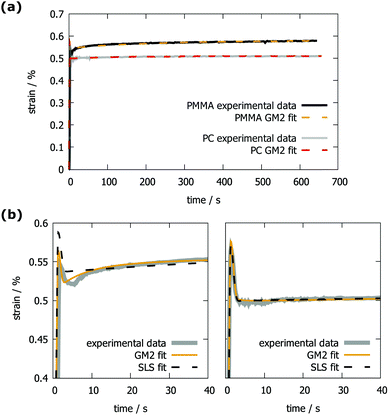 | ||
| Fig. 9 (a) Tensile strain versus time of PMMA and PC and the corresponding GM2 fits. (b) Comparison between the SLS and GM2 fits on PMMA (left) and on PC (right). | ||
3.4 Comparison
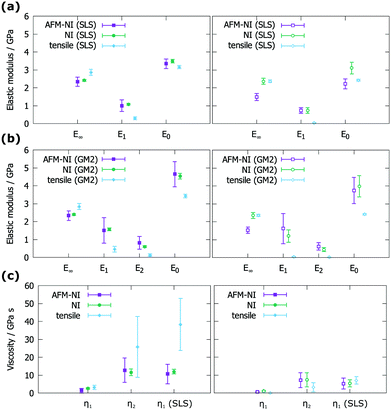
In order to ease the comparison between the three methods, Tables 2 and 3 are represented graphically in Fig. 10. It is easy to see the trends E0 > E∞ > E1 > E2, η1 < η2, and η2 ≈ η1(SLS). The trends hold for all three methods, except for PC measured with AFM-NI, where E∞ ≈ E1. By comparing AFM-NI with NI, it becomes evident that both methods yield similar and comparable results. The only difference is, again, the E∞ of PC, where AFM-NI yields a considerably lower value. To identify which of the two results (E∞ of PC from AFM-NI or NI) is more reasonable, other comparisons can be made. Tensile tests suggest that the E∞ of PMMA is higher than the E∞ of PC. The same is suggested by AFM-NI, whereas E∞ is the same for PC and PMMA when measured by NI. As stated in Section 2.3, the reduced modulus measured by AFM-NI with an Oliver and Pharr28 approach also results in a higher value for PMMA (2.8 GPa) compared to PC (1.5 GPa). Viewed under the light of the lower and upper boundary for the modulus, E∞ and E0, both values are close to the lower bound (in the case of GM2 and AFM-NI). For PC, the reduced modulus is actually identical with the lower boundary. From this, it would be expected that E∞ is higher for PMMA than for PC. It is unclear, however, why NI yields a different value in this case.Another interesting observation is that the elastic values measured by tensile testing differ considerably from the values measured by the other two methods. This is especially the case for E1 and E2. A possible explanation for this discrepancy is the different loading type in AFM-NI and NI compared to tensile testing. In AFM-NI and NI only a small volume of the sample is deformed while during tensile testing the whole sample is deformed. It could be interesting to conduct further studies on this basis, possibly by finite element analysis and additional experiments (such as compression tests to have a loading mode comparable to AFM-NI). Such investigations would help to bridge the gap between macroscopic values and those measured locally. They are, however, beyond the scope of this article, but might be interesting in the future.
In summary, we find good agreement between the results from conventional nanoindentation and the AFM based nanoindentation technique proposed in this work (compare Fig. 10). The values not only show the same trend, for most cases also the absolute values coincide. These results indicate that AFM-NI is able to provide results well comparable to conventional NI, albeit the scattering is larger. Both indentation techniques obtain E∞, η1, and η2 values comparable to those of tensile testing. The values are not identical, which can be attributed to the different loading modes and the scales on which the values are determined (nanometer vs. centimeter).
4 Conclusions
In this article, we presented an AFM based method to measure the viscoelastic properties of polymer materials on the nanometer scale. The presented method uses a loading step to deform the surface plastically before measuring the viscoelastic properties. During this plastic deformation, a surface region is created that is rather well defined in geometry and roughness compared to the pristine surface.The AFM based method is compared to an NI based method and a classical tensile test using PMMA and PC as testing materials. It turns out that the results obtained with the AFM based method are very similar to those obtained by the NI based method, as one would expect. This is different for the tensile tests, where E∞ and the viscous parts are in good agreement with the AFM based method, but E1 and E2 (and thus also E0) are different. A possible explanation for this observation is the difference in loading types between the tensile tests and AFM-NI. Also the tested length scales are completely different: in tensile tests a length of tens of millimeters is tested, whereas in AFM-NI the length scale is in the range of hundreds of nanometers.
Due to the low deformation in the AFM-NI approach, noise and drift have a significant influence in the measured creep curves. It is demonstrated that noise and drift can be compensated by averaging several curves and evaluating the averaged curve. Another possibility would be to increase the deformation; this, however would need AFM probes with a stiffer cantilever to apply sufficient force. Also, a larger tip radius would be favorable to keep the strain low – which is proportional to the reciprocal value of the tip radius26 – to stay in the regime with a linear material response. Refer to Fig. S3 of the ESI† to see how much noise can influence the force vs. indentation depth plots at low deformations.
In conclusion, we have presented an AFM based NI method to evaluate viscoelastic material properties on rough surfaces. The method facilitates the measurement of mechanical properties on the nanoscale with indentation depths around 20 nm. This makes it also useful for characterizing soft coatings on hard substrates with a film thickness of only a few hundred nanometers. The combination of contact mechanics that includes adhesion (here JKR) and a suitable material model (here SLS or GM2), enables quantitative determination of the viscoelastic material properties. The method could also be adapted to simpler models than the SLS model or more complex ones than the GM2 model. Provided the model is of the spring-dashpot-type for linear elastic material behavior, the same strategy can be used as is outlined in this article and the ESI.† Comparisons between AFM-NI, NI, and tensile test results show that the methods operating on the same scale (AFM-NI and NI) yield comparable values. Values from tensile tests differ from the other two, however, similarities are observed and all methods show the same trend (PMMA stiffer than PC). Furthermore, it was possible to distinguish between PMMA and PC reliably with all three methods.
5 Outlook
Future research will focus on determining the viscoelastic properties of cellulose based materials as a function of relative humidity. To give an outlook, the presented AFM-NI method is applied to a viscose fiber swollen in water. An example creep plot recorded on such a fiber is presented in Fig. 11.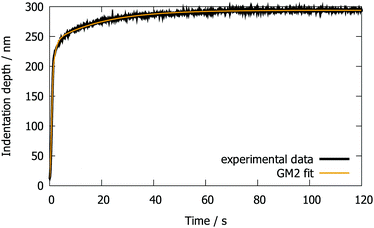 | ||
| Fig. 11 Creep curve measured by AFM-NI of a viscose fiber swollen in water and the corresponding GM2 + JKR fit. | ||
The results are presented in Table 4. From the SLS model, it was found that E0 = (11 ± 2.6) MPa and from the GM2 model that E0 = (22 ± 6.9) MPa. In an earlier work, the reduced modulus of the same type of wet and swollen viscose fibers was measured by AFM-NI to be around 50 MPa.22 This is higher than the upper bound E0 predicted by the GM2 model, but it has to be considered that the value was determined with a different tip geometry which is known to have an influence when measuring cellulosic materials.39 The deformations are also very high (see Fig. 11), which could result in an unwanted non-linear material response. Future investigations will keep the deformations as low as possible. The values (50 MPa and 22 MPa), however, are of the same order of magnitude indicating a plausible result.
| Model | E ∞/MPa | E 1/MPa | E 2/MPa | η 1/MPa s | η 2/MPa s |
|---|---|---|---|---|---|
| SLS | 8.6 ± 1.9 | 2.6 ± 1.2 | — | 25 ± 11 | — |
| GM2 | 8.5 ± 1.9 | 12 ± 5.2 | 1.3 ± 1.0 | 7.1 ± 1.5 | 17 ± 14 |
Conflicts of interest
There are no conflicts to declare.Acknowledgements
The financial support for the CD Laboratory from the Austrian Federal Ministry of Science, Research and Economy and the National Foundation for Research, Technology and Development is gratefully acknowledged. Part of this work was performed at the Polymer Competence Center Leoben GmbH (PCCL, Austria) within the framework of the COMET-program of the Federal Ministry for Transport, Innovation and Technology and the Federal Ministry for Economy, Family and Youth with contributions by the Montanuniversitaet Leoben. The PCCL is funded by the Austrian Government and the State Governments of Styria, Lower Austria and Upper Austria.References
- A. Fischer-Cripps, Mater. Sci. Eng., A, 2004, 385, 74–82 CrossRef.
- C. A. Tweedie and K. J. V. Vliet, J. Mater. Res., 2006, 21, 1576–1589 CrossRef CAS.
- M. Kocun, W. Mueller, M. Maskos, I. Mey, B. Geil, C. Steinem and A. Janshoff, Soft Matter, 2010, 6, 2508–2516 RSC.
- F. M. Hecht, J. Rheinlaender, N. Schierbaum, W. H. Goldmann, B. Fabry and T. E. Schäffer, Soft Matter, 2015, 11, 4584–4591 RSC.
- A. Yango, J. Schäpe, C. Rianna, H. Doschke and M. Radmacher, Soft Matter, 2016, 12, 8297–8306 RSC.
- H. Hertz, J. Reine Angew. Math., 1881, 92, 156–171 Search PubMed.
- K. L. Johnson, K. Kendall and A. D. Roberts, Proc. R. Soc. London, Ser. A, 1971, 324, 301–313 CrossRef CAS.
- B. V. Derjaguin, V. M. Muller and Y. P. Toporov, J. Colloid Interface Sci., 1975, 53, 314–326 CrossRef CAS.
- D. Maugis, J. Colloid Interface Sci., 1992, 150, 243–296 CrossRef CAS.
- M. Chyasnavichyus, S. L. Young and V. V. Tsukruk, Langmuir, 2014, 30, 10566–10582 CrossRef CAS PubMed.
- M. Chyasnavichyus, S. L. Young and V. V. Tsukruk, Jpn. J. Appl. Phys., 2015, 54, 08LA02 CrossRef.
- S. D. Solares, Beilstein J. Nanotechnol., 2014, 5, 1649–1663 CrossRef CAS PubMed.
- S. D. Solares, Beilstein J. Nanotechnol., 2016, 7, 554–571 CrossRef CAS PubMed.
- H. K. Nguyen, M. Ito, S. Fujinami and K. Nakajima, Macromolecules, 2014, 47, 7971–7977 CrossRef CAS.
- D. B. Haviland, C. A. van Eysden, D. Forchheimer, D. Platz, H. G. Kassa and P. Leclère, Soft Matter, 2016, 12, 619–624 RSC.
- G. Ciasca, M. Papi, S. Di Claudio, M. Chiarpotto, V. Palmieri, G. Maulucci, G. Nocca, C. Rossi and M. De Spirito, Nanoscale, 2015, 7, 17030–17037 RSC.
- P. Yuya, D. Hurley and J. A. Turner, J. Appl. Phys., 2008, 104, 074916 CrossRef.
- J. Killgore, D. Yablon, A. Tsou, A. Gannepalli, P. Yuya, J. Turner, R. Proksch and D. Hurley, Langmuir, 2011, 27, 13983–13987 CrossRef CAS PubMed.
- R. Garcia and R. Proksch, Eur. Polym. J., 2013, 49, 1897–1906 CrossRef CAS.
- W. J. Fischer, A. Zankel, C. Ganser, F. J. Schmied, H. Schroettner, U. Hirn, C. Teichert, W. Bauer and R. Schennach, Cellulose, 2014, 21, 251–260 CrossRef.
- C. Ganser, U. Hirn, S. Rohm, R. Schennach and C. Teichert, Holzforschung, 2014, 68, 53–60 CrossRef CAS.
- C. Ganser, P. Kreiml, R. Morak, F. Weber, O. Paris, R. Schennach and C. Teichert, Cellulose, 2015, 22, 2777–2786 CrossRef CAS.
- J. L. Hutter and J. Bechhoefer, Rev. Sci. Instrum., 1993, 64, 1868–1873 CrossRef CAS.
- J. E. Sader, R. Borgani, C. T. Gibson, D. B. Haviland, M. J. Higgins, J. I. Kilpatrick, J. Lu, P. Mulvaney, C. J. Shearer and A. D. Slattery, et al. , Rev. Sci. Instrum., 2016, 87, 093711 CrossRef PubMed.
- J. Villarrubia, Surf. Sci., 1994, 321, 287–300 CrossRef CAS.
- D. Tabor, Rev. Phys. Technol., 1970, 1, 145–179 CrossRef.
- G. Moeller, J. Polym. Sci., Part B: Polym. Phys., 2009, 47, 1573–1587 CrossRef CAS.
- W. C. Oliver and G. M. Pharr, J. Mater. Res., 1992, 7, 1564–1583 CrossRef CAS.
- C. Braunsmann, R. Proksch, I. Revenko and T. E. Schäffer, Polymer, 2014, 55, 219–225 CrossRef CAS.
- A. Jäger and R. Lackner, Strain, 2009, 45, 45–54 CrossRef.
- C. Zhang, Y. Zhang, K. Zeng and L. Shen, J. Mater. Res., 2005, 20, 1597–1605 CrossRef CAS.
- A. C. Hindmarsh, IMACS Transactions on Scientific Computation, North-Holland, Amsterdam, 1983, pp. 55–64 Search PubMed.
- J. W. Eaton, D. Bateman, S. Hauberg and R. Wehbring, GNU Octave version 4.2.0 manual: a high-level interactive language for numerical computations, 2016 Search PubMed.
- K. Levenberg, Q. Appl. Math., 1944, 2, 164–168 CrossRef.
- D. W. Marquardt, SIAM J. Appl. Math., 1963, 11, 431–441 CrossRef.
- D. Tscharnuter, S. Gastl and G. Pinter, Int. J. Eng. Sci., 2012, 60, 37–52 CrossRef CAS.
- B. Briscoe, L. Fiori and E. Pelillo, J. Phys. D: Appl. Phys., 1998, 31, 2395 CrossRef CAS.
- A.-Y. Jee and M. Lee, Polym. Test., 2010, 29, 95–99 CrossRef CAS.
- W. Gindl, J. Konnerth and T. Schöberl, Cellulose, 2006, 13, 1–7 CrossRef CAS.
Footnote |
| † Electronic supplementary information (ESI) available. See DOI: 10.1039/c7sm02057k |
| This journal is © The Royal Society of Chemistry 2018 |

